Trend IdentifierThe “Trend Identifier” indicator is designed to help traders quickly identify trending and sideways market conditions, allowing them to adapt their strategies based on the prevailing market sentiment. By combining several technical analysis tools—ATR (Average True Range), ADX (Average Directional Index), EMA (Exponential Moving Average), and RSI (Relative Strength Index)—this script provides insights into the market’s strength, direction, and volatility to improve trade decision-making.
How It Works
1. ATR (Average True Range):
• ATR measures market volatility. In this script, ATR is used in combination with a moving average to identify periods of rising or falling volatility, which helps differentiate between trending and non-trending conditions.
2. ADX (Average Directional Index):
• ADX is a key component in identifying the strength of a trend. The script uses a threshold system to classify market conditions:
• If ADX is low (below a specified threshold plus a buffer) and ATR indicates low volatility, the market is likely in a sideways condition.
• If ADX is high (above a threshold minus a buffer) with increasing ATR, the market is likely in a trending condition.
3. EMA (Exponential Moving Average):
• A 20-period EMA is used instead of a simple moving average to enhance trend detection speed. The close price’s position relative to the EMA helps identify bullish or bearish trends when combined with ADX and ATR data.
4. RSI (Relative Strength Index):
• RSI acts as a confirmation tool for trend strength. A bullish trend is confirmed if RSI is above 50 and the price is above the EMA, whereas a bearish trend is confirmed if RSI is below 50 and the price is below the EMA.
Market Condition Signals
• Sideways Signal:
• When ADX and ATR indicate a low-volatility, sideways market, the indicator changes the background color to gray, signaling potential low-trend movement or consolidation. A “S” symbol appears above the bars, making it easier to spot this condition.
• Bullish Trend:
• When conditions favor a strong upward trend, the background changes to green. A “B” symbol is displayed below the bar, indicating the onset of a bullish market condition.
• Bearish Trend:
• Conversely, if conditions indicate a downward trend, the background color changes to red. A “S” symbol is displayed below the bar, showing a bearish trend condition.
Using the Indicator
This indicator helps traders understand the current market structure in a glance:
• Sideways (Gray): Low-volatility consolidation period, ideal for range-bound strategies or waiting for a breakout.
• Bullish (Green): Confirmed uptrend, potentially suitable for buying or long entries.
• Bearish (Red): Confirmed downtrend, ideal for short selling or exiting long positions.
The “Trend Identifier” is a powerful tool for traders who seek a clear view of the market structure, using a balanced approach of volatility, trend strength, and momentum. By combining the power of ATR, ADX, EMA, and RSI, this indicator provides a nuanced picture of the market’s behavior, assisting traders in making more informed decisions.
Average Directional Index (ADX)

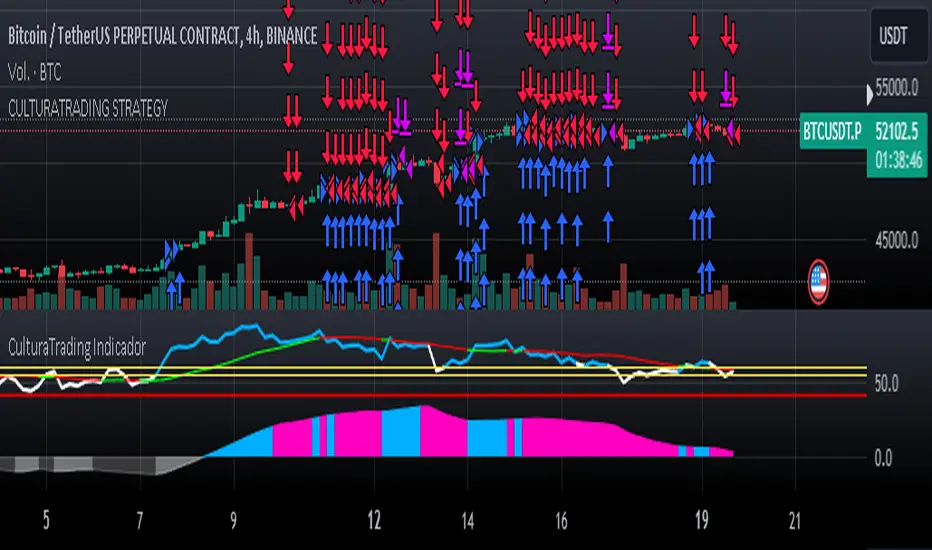
DMI Delta by 0xjcfOverview
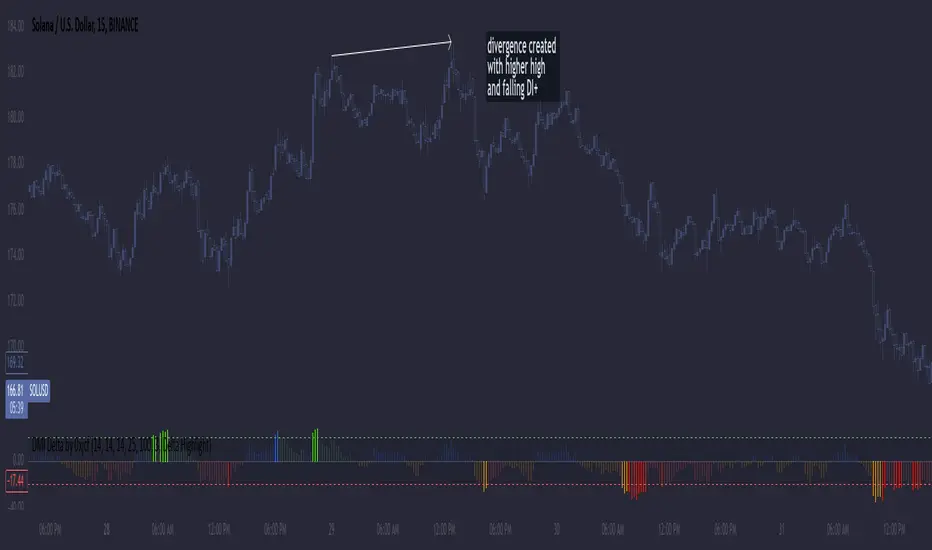
This indicator integrates the Directional Movement Index (DMI), Average Directional Index (ADX), and volume analysis into an Oscillator designed to help traders identify divergence-based trading signals. Unlike typical volume or momentum indicators, this combination provides insight into directional momentum and volume intensity, allowing traders to make well-informed decisions based on multiple facets of market behavior.
Purpose and How Components Work Together
By combining DMI and ADX with volume analysis, this indicator helps traders detect when momentum diverges from price action—a common precursor to potential reversals or significant moves. The ADX filter enhances this by distinguishing trending from range-bound conditions, while volume analysis highlights moments of extreme sentiment, such as solid buying or selling. Together, these elements provide traders with a comprehensive view of market strength, directional bias, and volume surges, which help filter out weaker signals.
Key Features
DMI Delta and Oscillator: The DMI indicator measures directional movement by comparing DI+ and DI- values. This difference (DMI Delta) is calculated and displayed as a histogram, visualizing changes in directional bias. When combined with ADX filtering, this histogram helps traders gauge the strength of momentum and spot directional shifts early. For instance, a rising histogram in a bearish price trend might signal a potential bullish reversal.
Volume Analysis with Extremes: Volume is monitored to reveal when market participation is unusually high, using a customizable multiplier to highlight significant volume spikes. These extreme levels are color-coded directly on the histogram, providing visual cues on whether buying or selling interest is particularly strong. Volume analysis adds depth to the directional insights from DMI, allowing traders to differentiate between regular and powerful moves.
ADX Trending Filter: The ADX component filters trends by measuring the overall strength of a price move, with a default threshold of 25. When ADX is above this level, it suggests that the market is trending strongly, making the DMI Delta readings more reliable. Below this threshold, the market is likely range-bound, cautioning traders that signals might not have as much follow-through.
Using the Indicator in Divergence Strategies
This indicator excels in divergence strategies by highlighting moments when price action diverges from directional momentum. Here’s how it aids in decision-making:
Bullish Divergence: If the price is falling to new lows while the DMI Delta histogram rises, it can indicate weakening bearish momentum and signal a potential price reversal to the upside.
Bearish Divergence: Conversely, if prices are climbing but the DMI Delta histogram falls, it may point to waning bullish momentum, suggesting a bearish reversal.
Visual Cues and Customization
The color-coded output enhances usability:
Bright Green/Red: Extreme volume with strong bullish or bearish signals, often at points of high potential for trend continuation or reversal.
Green/Red Shades: These shades reflect trending conditions (bullish or bearish) based on ADX, factoring in volume. Green signals a bullish trend, and red is a bearish trend.
Blue/Orange Shades: Indicates non-trending or weaker conditions, suggesting a more cautious approach in range-bound markets.
Customizable for Diverse Trading Styles
This indicator allows users to adjust settings like the ADX threshold and volume multiplier to optimize performance for various timeframes and strategies. Whether a trader prefers swing trading or intraday scalping, these parameters enable fine-tuning to enhance signal reliability across different market contexts.
Practical Usage Tips
Entry and Exit Signals: Use this indicator in conjunction with price action. Divergences between the price and DMI Delta histogram can reinforce entry or exit decisions.
Adjust Thresholds: Based on backtesting, customize the ADX Trending Threshold and Volume Multiplier to ensure optimal performance on different timeframes or trading styles.
In summary, this indicator is tailored for traders seeking a multi-dimensional approach to market analysis. It blends momentum, trend strength, and volume insights to support divergence-based strategies, helping traders confidently make informed decisions. Remember to validate signals through backtesting and use it alongside price action for the best results.
RSI Crossover and ADX oscillator [deepakks444]RSI Crossover and ADX Oscillator
The RSI Crossover and ADX Oscillator is a custom indicator designed to help traders identify potential trend reversals and trend strength by analyzing the Relative Strength Index (RSI) across multiple timeframes, combined with the Average Directional Index (ADX) to measure the momentum of a trend. This indicator provides a more comprehensive view of the market, allowing traders to spot possible entry and exit points based on multiple signals and conditions.
How the Script Works:
1. Multi-Timeframe RSI Calculation:
This indicator calculates the RSI for three different timeframes:
RSI 1 (default: 15 minutes)
RSI 2 (default: 1 hour)
RSI 3 (default: Daily)
By comparing the RSI across multiple timeframes, traders can gauge both short-term and longer-term momentum. For example, if the shorter timeframe RSI is moving in the same direction as the longer timeframe RSI, it may confirm the strength of the trend. Conversely, if they diverge, it could signal a potential reversal or weakening of the trend.
Each RSI value can also be smoothed using a variety of smoothing methods (SMA, EMA, WMA, RMA) to reduce noise and produce cleaner signals.
2. RSI Smoothing Options:
The smoothing function helps make RSI readings clearer by filtering out short-term fluctuations. This can be useful in volatile markets where small movements can trigger false signals. The user can select the preferred smoothing method (or choose none) and set the smoothing factor to control the sensitivity of the RSI line.
None: No smoothing applied.
SMA (Simple Moving Average): Averages RSI over a specified period, providing a more straightforward trend line.
EMA (Exponential Moving Average): Puts more weight on recent data points, making the trend line more responsive to recent price movements.
WMA (Weighted Moving Average): A weighted average that emphasizes more recent values.
RMA (Running Moving Average): Another smoothing option similar to SMA but with different calculation properties.
3. ADX Trend Strength Measurement:
The Average Directional Index (ADX) is used to measure the strength of a trend, regardless of its direction. ADX is a widely used tool to confirm whether the market is trending strongly or if the market is in a sideways range.
ADX > 25: Indicates a strong trend.
ADX < 25: Indicates a weak trend or range-bound market.
In this script, the color of the ADX line changes dynamically based on whether the trend is strengthening (green) or weakening (red). This allows traders to quickly assess whether the market conditions are favorable for trend-following strategies.
4. Divergence Detection:
The script includes an option to detect regular bullish and bearish divergence between price and RSI. Divergence occurs when price moves in one direction but RSI moves in the opposite direction, which may indicate that the current trend is weakening and could be about to reverse.
Bullish Divergence: Occurs when the price makes a lower low, but the RSI makes a higher low. This could signal a potential upward reversal.
Bearish Divergence: Occurs when the price makes a higher high, but the RSI makes a lower high. This could signal a potential downward reversal.
These divergence signals help traders spot potential reversal points before they become obvious on the price chart itself.
5. No-Trade Zone:
The no-trade zone is an important feature of this script. It highlights the range between RSI 40 and 60, which represents a neutral or indecisive market condition. When the RSI is within this range, it indicates that the market lacks clear directional momentum, making it a riskier environment for trend-following trades. The script shades this region on the chart, visually warning traders to avoid initiating trades during these periods.
Visual Table Display:
To improve clarity, the script includes a table that shows key values directly on the chart:
RSI 1 (15-minute): Displays the current RSI value for the 15-minute timeframe.
RSI 2 (1-hour): Displays the current RSI value for the 1-hour timeframe.
RSI 3 (Daily): Displays the current RSI value for the Daily timeframe.
ADX: Displays the current ADX value, with color-coding to show whether the trend is strengthening (green) or weakening (red).
Long/Short Signal: This final cell in the table shows whether a potential Long or Short signal is currently active based on RSI crossovers and ADX strength.
The table can be repositioned on the chart according to user preference (Top Right, Top Left, Bottom Right, Bottom Left).
Possible Entry and Exit Points:
Long Entry Criteria:
RSI 1 crosses above RSI 2.
RSI 1 is above its 9-period moving average (to confirm upward momentum).
When these conditions are met, the script will display a potential Long signal in the table, and an alert will be triggered if enabled.
Note : ADX is rising, indicating that the trend strength is increasing. ADX is falling, indicating that the trend is weakening.
Short Entry Criteria:
RSI 1 (15-minute) crosses below RSI 2 (1-hour).
RSI 1 is below its 9-period moving average (to confirm downward momentum).
Note : ADX is rising, indicating that the trend strength is increasing. ADX is falling, indicating that the trend is weakening.
When these conditions are met, the script will display a potential Short signal in the table, and an alert will be triggered if enabled.
Exit Criteria:
Exit a Long position when a Short signal is generated or when a yellow candle appears, which indicates that momentum is weakening.
Exit a Short position when a Long signal is generated or when a yellow candle appears.
Customizable Inputs:
This script offers several customization options for users:
RSI Length and Timeframes:
Adjust the length of the RSI calculation and the timeframes for each RSI (default: 15-minute, 1-hour, Daily). This allows traders to tailor the script to different market conditions and assets.
Smoothing Method:
Choose how the RSI values are smoothed (None, SMA, EMA, WMA, RMA) and adjust the smoothing factor.
ADX Settings:
Toggle the ADX on/off, and adjust the smoothing factor and DI length to match your preferred trend strength calculation.
Divergence Detection:
Enable or disable divergence detection and set the range of bars for detecting divergence patterns.
Table Position:
Change the location of the table on the chart (Top Right, Top Left, Bottom Right, Bottom Left).
Note : I have used RSI 1 = 3 Minutes, RSI 2 = 15 Minutes and RSI 3 = 1 Hour as input in the shown chart.
Important Notes:
This script is intended for educational purposes only. It is designed to help traders learn how to combine RSI and ADX to analyze trends and momentum, but it should not be used as financial advice or a guaranteed trading strategy.
Always test the script in a demo environment before using it in live trading to understand how it behaves with different assets and timeframes.
Proper risk management and additional confirmations should be used alongside this indicator for effective trading.

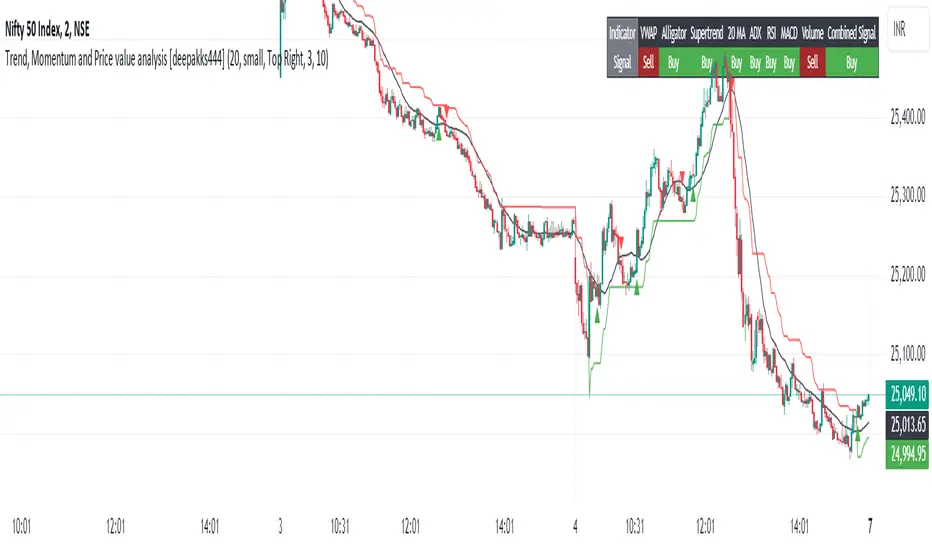
Trend, Momentum and Price value analysis [deepakks444]Trend, Momentum, and Price Value Analysis
This indicator combines several key technical analysis tools to help traders evaluate the market's trend strength, momentum, and overall price behavior. It uses a variety of signals to generate a "Buy," "Sell," or "No Clear Indication" based on multiple indicators and plots them directly on the chart. A customizable table also summarizes these signals, making it easy to interpret the market conditions in real-time.
Key Features:
VWAP (Volume-Weighted Average Price): Indicates whether the price is above or below the VWAP line, helping to identify buying or selling opportunities based on fair value.
Alligator Indicator: Utilizes three simple moving averages (SMAs) to track trend direction, providing a clear "Buy" or "Sell" signal when the averages are aligned.
Supertrend: A widely-used trend-following indicator, this script identifies potential buy or sell zones based on the price's relationship with the Supertrend line.
20-period Moving Average (MA): A simple moving average to track the overall trend direction. The signal is based on the price crossing above or below the MA.
ADX (Average Directional Index): Measures the strength of the trend. A reading above 25 indicates a "Buy" signal, while a reading below suggests a "Sell."
RSI (Relative Strength Index): Generates a buy signal when RSI exceeds 60 and a sell signal when it drops below 40. Values between 40 and 60 indicate a neutral condition.
MACD (Moving Average Convergence Divergence): Provides a signal for buying when the MACD line crosses above the signal line, and selling when it crosses below.
Volume Signal: Compares current volume against the 20-period moving average to identify significant volume spikes. This helps in determining if the market is supported by strong volume.
Customization Options:
Moving Average Length: Customize the 20-period MA length to better fit your trading style or the asset you’re analyzing.
Supertrend Settings: Adjust the Supertrend factor and ATR period for different timeframes or volatility environments.
Table Position: Customize where the signal table is displayed on the chart (Top Right, Top Left, Bottom Right, or Bottom Left).
Table Appearance: Set the table background color and choose between small or tiny text size for better readability.
Signal Summary:
The indicator computes a combined signal based on the number of "Buy" or "Sell" signals from the individual indicators. If 5 or more indicators suggest a "Buy" or "Sell," the table will display a combined signal for easier decision-making. This feature consolidates the signals into one straightforward output, helping you filter noise and act on clear trends.
Table Display:
The customizable table organizes the signals of the key indicators, showing:
Indicator: Lists all the indicators in use, such as VWAP, Alligator, Supertrend, etc.
Signal: Displays "Buy," "Sell," or "Neutral" for each indicator based on the current market conditions.
Intended Use:
This script is designed to help traders monitor multiple technical indicators at once, giving them a clearer view of the market’s trend strength, momentum, and volatility. While it simplifies the process of interpreting various signals, users should use it in combination with their own research and risk management strategies.
Disclaimer: This script is for educational purposes only and should not be considered financial advice. All trading involves risk, and the performance of an indicator in the past does not guarantee future results. Always perform due diligence and use proper risk management techniques.
3 days ago
Release Notes
A "Buy" triangle is plotted below the bar if the signal changes to "Buy".
A "Sell" triangle is plotted above the bar if the signal changes to "Sell".
Script Name: Trend, Momentum, and Price Value Analysis
The Trend, Momentum, and Price Value Analysis script provides a multi-faceted approach to market analysis, combining several technical indicators into a single tool. This script offers an easy-to-interpret table summarizing various indicator signals, along with visual buy/sell signals on the chart.
Key Features:
VWAP (Volume Weighted Average Price):
The VWAP provides insights into whether the current price is above or below the average weighted price, helping traders identify potential buy or sell opportunities.
Alligator Indicator (Simplified):
Using three simple moving averages (SMAs), this tool helps identify the beginning of trends and potential buy/sell zones based on the Alligator jaw, teeth, and lips.
Supertrend:
A trend-following indicator that determines whether the market is in a bullish or bearish phase based on ATR and factor inputs. The Supertrend line is plotted on the chart.
20-period Moving Average (MA):
A basic moving average that assists in gauging price direction and the overall trend.
ADX (Average Directional Index):
Helps identify the strength of a trend. A value above 25 indicates a strong trend.
RSI (Relative Strength Index):
Measures momentum by identifying overbought and oversold conditions. A signal is triggered when RSI is above 60 (buy) or below 40 (sell).
MACD (Moving Average Convergence Divergence):
A momentum indicator that provides signals when the MACD line crosses the signal line.
Volume Signal:
Compares the current volume with a 20-period average to determine if volume supports the current trend direction.
Signal Table:
A table is generated on the chart, displaying real-time signals from each of the above indicators. The table is customizable with background colors and text sizes.
The position of the table can be set to any corner of the chart for convenience.
Combined Signal Logic:
The script calculates a Combined Signal based on the majority of buy or sell signals across all the indicators. If 5 or more indicators give a buy or sell signal, a combined signal is generated.
Buy/Sell Signal Plots:
The script plots buy (green triangle) and sell (red triangle) signals on the chart based on the combined signal when transitioning from a previous opposite signal.
Customizable Inputs:
Users can customize the length of the moving averages, adjust the background and text colors of the table, and choose the position of the table on the chart.
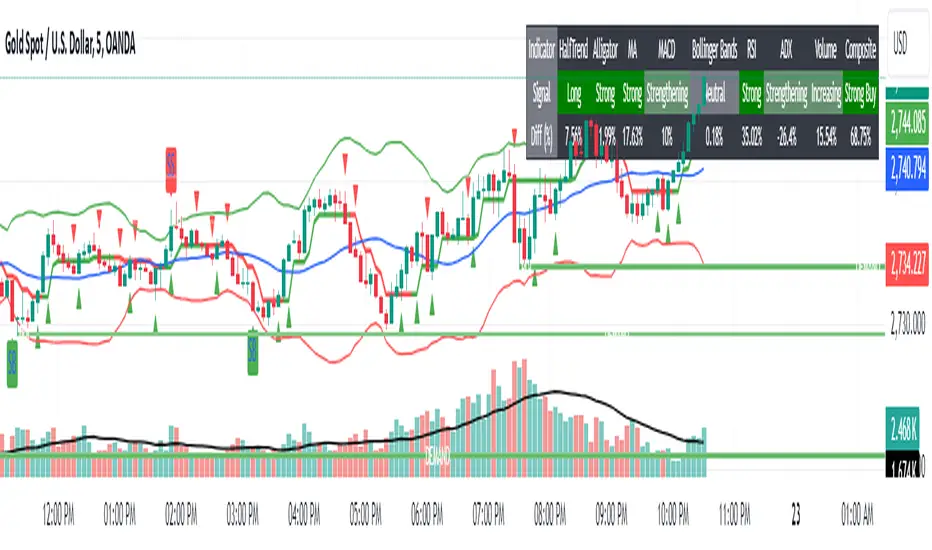
Trend, Momentum and Price value analysis Extended [deepakks444]Trend, Momentum, and Price Value Analysis Extended
This Pine Script™ indicator is designed to offer traders a comprehensive overview of price trends, momentum, and market strength through the use of several widely-recognized technical analysis tools. The indicator integrates multiple signals and plots directly on the chart, as well as a customizable table to help visually organize and interpret the data. Here’s an overview of the key features included:
Key Features:
VWAP (Volume-Weighted Average Price): Calculates the average price weighted by volume to give insight into whether the price is above or below the market's fair value.
Alligator Indicator: Uses a combination of three moving averages (jaw, teeth, and lips) to help identify trending conditions.
Supertrend: A trend-following indicator that signals potential buy or sell opportunities based on price movements relative to a dynamically calculated support/resistance line.
20-period Moving Average (MA): A basic moving average to smooth out price data and highlight the underlying trend.
MACD (Moving Average Convergence Divergence): Helps identify changes in the strength, direction, and momentum of a trend.
Volume with Moving Average: Compares current volume against its moving average to identify potential volume spikes.
RSI (Relative Strength Index): Measures the speed and change of price movements, signaling overbought or oversold conditions.
ADX (Average Directional Index): An indicator used to quantify trend strength, helping traders determine whether the market is trending or in a range.
Pivot Points: Calculates daily pivot points and identifies support and resistance levels based on price movements.
Bollinger Bands: A volatility indicator that uses standard deviation to highlight potential overbought or oversold conditions.
Customization Options:
Modify the length of the price and volume moving averages.
Adjust RSI thresholds for buy and sell signals.
Set the thresholds for ADX to differentiate between weak, average, and strong trends.
Toggle the visibility of the 20-period MA and Supertrend on the chart.
Choose to display the percentage difference between the current price and indicator values in the table.
Table Display:
The indicator includes a table that summarizes the status of all signals, showing:
Signal (Buy/Sell/Neutral): Based on each indicator's interpretation of price action.
Percentage Difference: Optional display of how far the price is from the reference level (e.g., the difference between the price and VWAP, Supertrend line, or Moving Average).
The table allows traders to quickly assess the current market conditions across several indicators in one place, making it easier to gauge overall market sentiment.
Signal Logic:
This indicator uses a scoring system to calculate the percentage of indicators signaling a buy or sell. If the buy or sell score reaches 70% or higher, the indicator will plot buy or sell signals on the chart. The combined signal logic is displayed in the table as "Buy," "Sell," or "No Signal," based on the majority of the contributing indicators.
Intended Use:
This tool is designed to assist traders in their technical analysis by consolidating multiple popular indicators into one script. It provides a clear visual representation of various market signals, helping traders to make informed decisions about potential trade entries and exits. However, this indicator is for educational purposes and should not be used as financial advice. Traders should always use proper risk management and conduct their own research before making any trading decisions.
Disclaimer: This script is for educational purposes only and does not constitute financial advice. Trading involves risk, and past performance of an indicator does not guarantee future results. Please use it alongside proper risk management practices.
Signals for Trending or Ranging market using RSI and WMAThis trading indicator is based on several key components, including the Average Directional Index (ADX), and a combination of RSI and Weighted Moving Average (WMA) to signal trading opportunities in both trending and ranging markets. Here's a breakdown:
ADX Calculation: The script calculates the ADX to identify market trends. A threshold value of ADX is used to distinguish between trending and ranging market conditions.
RSI and WMA for Different Market Conditions: The script calculates two sets of RSI and WMA, one for trending markets and another for ranging markets. This allows the strategy to adjust based on market conditions determined by the ADX value.
Trade Signals: The script generates long and short signals based on the alignment of RSI and WMA.
Long Signals: Triggered when RSI and WMA indicate upward momentum.
Short Signals: Triggered when both RSI and WMA suggest downward movement.
The signals are confirmed by pivot points, with the stop loss placed at the most recent high or low.
Stop Loss and Trade Management: The script includes dynamic stop-loss management. It moves the stop loss in halfway original stop loss after achieving 2R and to break-even after achieving a 4R gain.
Performance Tracking: It tracks the number of winning and losing trades and calculates the total "R" (risk/reward) for the active trades. Debugging labels are added on the chart to display statistics for wins, losses, and total R performance.
Plotting: The script plots the stop loss and entry price on the chart for visual clarity. Additionally, it colors the background green or red based on whether a long or short position is active.
Overall, this indicator combines ADX, RSI, and WMA indicators with a robust trade management system to execute and track trading signals in both trending and ranging markets.

Daksh RSI POINT to ShootHere are the key points and features of the Pine Script provided:
### 1. **Indicator Settings**:
- The indicator is named **"POINT and Shoot"** and is set for non-overlay (`overlay=false`) on the chart.
- `max_bars_back=4000` is defined, indicating the maximum number of bars that the script can reference.
### 2. **Input Parameters**:
- `Src` (Source): The price source, default is `close`.
- `rsilen` (RSI Length): The length for calculating RSI, default is 20.
- `linestylei`: Style for the trend lines (`Solid` or `Dashed`).
- `linewidth`: Width of the plotted lines, between 1 and 4.
- `showbroken`: Option to show broken trend lines.
- `extendlines`: Option to extend trend lines.
- `showpivot`: Show pivot points (highs and lows).
- `showema`: Show a weighted moving average (WMA) line.
- `len`: Length for calculating WMA, default is 9.
### 3. **RSI Calculation**:
- Calculates a custom RSI value using relative moving averages (`ta.rma`), and optionally uses On-Balance Volume (`ta.obv`) if `indi` is set differently.
- Plots RSI values as a green or red line depending on its position relative to the WMA.
### 4. **Pivot Points**:
- Utilizes the `ta.pivothigh` and `ta.pivotlow` functions to detect pivot highs and lows over the defined period.
- Stores up to 10 recent pivot points for highs and lows.
### 5. **Trend Line Drawing**:
- Lines are drawn based on pivot highs and lows.
- Calculates potential trend lines using linear interpolation and validates them by checking if subsequent bars break or respect the trend.
- If the trend is broken, and `showbroken` is enabled, it draws dotted lines to represent these broken trends.
### 6. **Line Management**:
- Initializes multiple lines (`l1` to `l20` and `t1` to `t20`) and uses these lines for drawing uptrend and downtrend lines.
- The maximum number of lines is set to 20 for uptrends and 20 for downtrends, due to a limit on the total number of lines that can be displayed on the chart.
### 7. **Line Style and Color**:
- Defines different colors for uptrend lines (`ulcolor = color.red`) and downtrend lines (`dlcolor = color.blue`).
- Line styles are determined by user input (`linestyle`) and use either solid or dashed patterns.
- Broken lines use a dotted style to indicate invalidated trends.
### 8. **Pivot Point Plotting**:
- Plots labels "H" and "L" for pivot highs and lows, respectively, to visually indicate turning points on the chart.
### 9. **Utility Functions**:
- Uses helper functions to get the values and positions of the last 10 pivot points, such as `getloval`, `getlopos`, `gethival`, and `gethipos`.
- The script uses custom logic for line placement based on whether the pivots are lower lows or higher highs, with lines adjusted dynamically based on price movement.
### 10. **Plotting and Visuals**:
- The main RSI line is plotted using a color gradient based on its position relative to the WMA.
- Horizontal lines (`hline1` and `hline2`) are used for visual reference at RSI levels of 60 and 40.
- Filled regions between these horizontal lines provide visual cues for potential overbought or oversold zones.
These are the main highlights of the script, which focuses on trend detection, visualization of pivot points, and dynamic line plotting based on price action.

ADX Trend Strength Analyzer█ OVERVIEW
This script implements the Average Directional Index (ADX), a powerful tool used to measure the strength of market trends. It works alongside the Directional Movement Index (DMI), which breaks down the directional market pressure into bullish (+DI) and bearish (-DI) components. The purpose of the ADX is to indicate when the market is in a strong trend, without specifying the direction. This indicator can be especially useful for identifying market trends early and validating trading strategies based on trend-following systems.
The ADX component in this script is based on two key parameters:
ADX Smoothing Length (adxlen), which determines the degree of smoothing for the trend strength.
DI Length (dilen), which defines the look-back period for calculating the directional index values.
Additionally, a horizontal line is plotted at the 30 level, providing a widely used threshold that signifies when a trend is considered strong (above 30).
█ CONCEPTS
Directional Movement (DM): The core idea behind this indicator is the calculation of price movement in terms of bullish and bearish forces. By evaluating the change in highs and lows, the script distinguishes between bullish movement (+DM) and bearish movement (-DM). These values are normalized by dividing them by the True Range (TR), creating the +DI and -DI values.
True Range (TR): The True Range is calculated using the Average True Range (ATR) formula, and it serves to smooth out volatility, ensuring that short-term fluctuations don't distort the long-term trend signal.
ADX Calculation: The ADX is derived from the absolute difference between the +DI and -DI. By smoothing this difference and normalizing it, the ADX is able to measure the overall strength of the trend without regard to whether the market is moving up or down. A rising ADX indicates increasing trend strength, while a falling ADX signals weakening trends.
█ METHODOLOGY
Directional Movement Calculation: The script first determines the upward and downward price movement by comparing changes in the high and low prices. If the upward movement is greater than the downward movement, it registers a bullish signal and vice versa for bearish movement.
True Range Adjustment: The script then applies a smoothing function to normalize these movements by dividing them by the True Range (ATR). This ensures that the trend signal is based on relative, rather than absolute, price movements.
ADX Signal Generation: The final step is to calculate the ADX by applying the Relative Moving Average (RMA) to the difference between +DI and -DI. This produces the ADX value, which is plotted in red, making it easy to visualize shifts in market momentum.
Threshold Line: A blue horizontal line is plotted at 30, which serves as a key reference point. When the ADX is above this line, it indicates a strong trend, whether bullish or bearish.
█ HOW TO USE
Trend Strength: Traders typically use the 30 level as a critical threshold. When the ADX is above 30, it signifies a strong trend, making it a favorable environment for trend-following strategies. Conversely, ADX values below 30 suggest a weak or non-trending market.
+DI and -DI Relationship: The indicator also provides insight into whether the trend is bullish or bearish. When +DI is greater than -DI, the market is considered bullish. When -DI is greater than +DI, the market is considered bearish. While this script focuses on the ADX value itself, the underlying +DI and -DI help interpret the trend direction.
Market Conditions: This indicator is effective in trending markets, but not ideal for choppy or sideways conditions. Traders can use it to determine the best entry and exit points when trends are strong, or to avoid trading in periods of low volatility.
Combining with Other Indicators: The ADX is commonly used in conjunction with oscillators like RSI or moving averages, to confirm the trend strength and avoid false signals.
█ METHOD VARIANTS
This script applies the standard approach for calculating the ADX, but could be adapted with the following variants:
Different Timeframes: The script could be modified to calculate ADX values across higher or lower timeframes, depending on the trader's strategy.
Custom Thresholds: Instead of using the default 30 threshold, traders could adjust the horizontal line to suit their own risk tolerance or market conditions.

Trend CCITrend CCI (TCCI) Indicator
Description:
The Trend CCI (TCCI) indicator is a unique combination of the Commodity Channel Index (CCI) and the Average True Range (ATR), designed to identify trends and market reversals with a refined sensitivity to price volatility. The indicator plots the CCI, adjusted by an ATR filter, and color-codes the trendline to signal uptrends and downtrends.
How It Works:
This indicator uses the CCI to measure price momentum and an ATR-based filter to smooth out market noise, making it easier to detect significant shifts in the market trend. Key parameters such as the ATR Period, ATR Multiplier, and CCI Period have been carefully chosen to optimize the indicator's performance:
1. ATR Period (default: 18)
The ATR Period determines the number of periods used to calculate the **Average True Range**, which reflects market volatility. In this case, an **ATR Period of 18** has been selected for several reasons:
Balance between responsiveness and noise reduction : A period of 18 strikes a balance between being responsive to recent price movements and filtering out minor fluctuations. Shorter ATR periods might be too reactive, creating false signals, while longer periods might miss shorter-term trends.
Adaptable to various market conditions : An 18-period ATR is suitable for both intraday and swing trading strategies, making it versatile across different time frames.
Standard industry practice : Many traders use ATR settings between 14 and 20 periods as a convention for detecting reliable volatility levels.
2. ATR Multiplier (default: 1.5)
The ATR Multiplier is applied to the ATR value to define how sensitive the indicator is to volatility. In this case, a multiplier of 1.5 has been chosen:
Avoiding whipsaws in low volatility markets: By setting the multiplier to 1.5, the indicator filters out smaller, less significant price movements, reducing the likelihood of whipsaw signals (i.e., false trend reversals during periods of low volatility).
Optimizing signal accuracy: A moderate multiplier like 1.5 ensures that the indicator only generates signals when the price moves a significant distance from the average range. Higher multipliers (e.g., 2.0) may ignore valid opportunities, while lower multipliers (e.g., 1.0) might create too many signals.
Enhancing trend clarity : The multiplier’s role in widening the range allows the indicator to respond more clearly during periods of strong trends, reducing signal noise and false positives.
3. CCI Period (default: 63)
The CCI Period defines the number of periods used to calculate the Commodity Channel Index. A 63-period CCI is selected based on the following considerations:
Smoothing the momentum calculation: A longer period, such as 63, is used to smooth out the CCI and reduce the effects of short-term price fluctuations. This period captures longer-term momentum, making it ideal for identifying more significant market trends.
-Filtering out short-term noise: While shorter CCI periods (e.g., 14 or 20) may be more reactive, they tend to produce more signals, some of which may be false. A 63-period CCI focuses on stronger and more sustained price movements, providing fewer but higher-quality signals.
Adapted to intermediate trading: A 63-period CCI aligns well with traders looking for medium-term trend-following strategies, striking a balance between long-term trend identification and responsiveness to significant price shifts.
How to Use:
Green Area: When the trendline turns green, it signals that the CCI is positive, reflecting upward momentum. This can be interpreted as a buy signal, indicating the potential for long positions or continuing bullish trades.
Red Area: When the trendline turns red, it signals that the CCI is negative, reflecting downward momentum. This can be interpreted as a sell signal, indicating potential short positions or bearish trades.
ATR Filter: The ATR helps reduce false signals by ignoring minor price movements. Traders can adjust the ATR Multiplier to make the indicator more or less sensitive based on market conditions. A lower multiplier (e.g., 1.2) may increase signal frequency, while a higher multiplier (e.g., 2.0) reduces it.
Originality:
The Trend CCI (TCCI) stands out due to its combination of the CCI and ATR. While many indicators simply plot raw CCI values, this script enhances the CCI’s effectiveness by incorporating an ATR-based volatility filter. This ensures that only significant trends trigger signals, making it a more reliable tool in volatile markets. The choice of the ATR period, multiplier, and CCI period ensures a refined balance between trend detection and noise reduction, distinguishing it as a powerful trend-following indicator.
Additionally, the visual aspect—using color-coded trendlines that dynamically shift between green and red—simplifies the interpretation of market trends, offering traders a clear and immediate understanding of trend direction and momentum strength.
Final Recommendations:
Use in Trending Markets The TCCI is most effective in trending markets, where its signals align with broader market momentum. In sideways or low-volatility markets, consider adjusting the ATR multiplier or using other complementary indicators to confirm the signals.
Risk Management: Always integrate robust risk management practices, such as using stop-loss orders and position sizing, to protect against sudden market reversals or periods of heightened volatility.
Adjust for Volatility: Consider the volatility of the asset being traded. In highly volatile assets, a higher ATR multiplier (e.g., 2.0) may be necessary to filter out noise, while in more stable assets, a lower multiplier (e.g., 1.2) might generate earlier signals.
By using the Trend CCI (TCCI) indicator with a deeper understanding of its key parameters, traders can better identify trends, reduce noise, and improve their overall decision-making in the markets.
Good Profits!

RSI 15/60 and ADX PlotIn this script, the buy and sell criteria are based on the Relative Strength Index (RSI) values calculated for two different timeframes: the 15-minute RSI and the hourly RSI. These timeframes are used together to check signals when certain thresholds are crossed, providing confirmation across both short-term and longer-term momentum.
Buy Criteria:
Condition 1:
Hourly RSI > 60: This means the longer-term momentum shows strength.
15-minute RSI crosses above 60: This shows that the shorter-term momentum is catching up and confirms increasing strength.
Condition 2:
15-minute RSI > 60: This indicates that the short-term trend is already strong.
Hourly RSI crosses above 60: This confirms that the longer-term trend is also gaining strength.
Both conditions aim to capture the moments when the market shows increasing strength across both short and long timeframes, signaling a potential buy opportunity.
Sell Criteria:
Condition 1:
Hourly RSI < 40: This indicates that the longer-term trend is weakening.
15-minute RSI crosses below 40: The short-term momentum is also turning down, confirming the weakening trend.
Condition 2:
15-minute RSI < 40: The short-term trend is already weak.
Hourly RSI crosses below 40: The longer-term trend is now confirming the weakness, indicating a potential sell.
These conditions work to identify when the market is showing weakness in both short-term and long-term timeframes, signaling a potential sell opportunity.
ADX Confirmation :
The Average Directional Index (ADX) is a key tool for measuring the strength of a trend. It can be used alongside the RSI to confirm whether a buy or sell signal is occurring in a strong trend or during market consolidation. Here's how ADX can be integrated:
ADX > 25: This indicates a strong trend. Using this threshold, you can confirm buy or sell signals when there is a strong upward or downward movement in the market.
Buy Example: If a buy signal (RSI > 60) is triggered and the ADX is above 25, this confirms that the market is in a strong uptrend, making the buy signal more reliable.
Sell Example: If a sell signal (RSI < 40) is triggered and the ADX is above 25, it confirms a strong downtrend, validating the sell signal.
ADX < 25: This suggests a weak or non-existent trend. In this case, RSI signals might be less reliable since the market could be moving sideways.
Final Approach:
The RSI criteria help identify potential overbought and oversold conditions in both short and long timeframes.
The ADX confirmation ensures that the signals generated are happening during strong trends, increasing the likelihood of successful trades by filtering out weak or choppy market conditions.
This combination of RSI and ADX can help traders make more informed decisions by ensuring both momentum and trend strength align before entering or exiting trades.

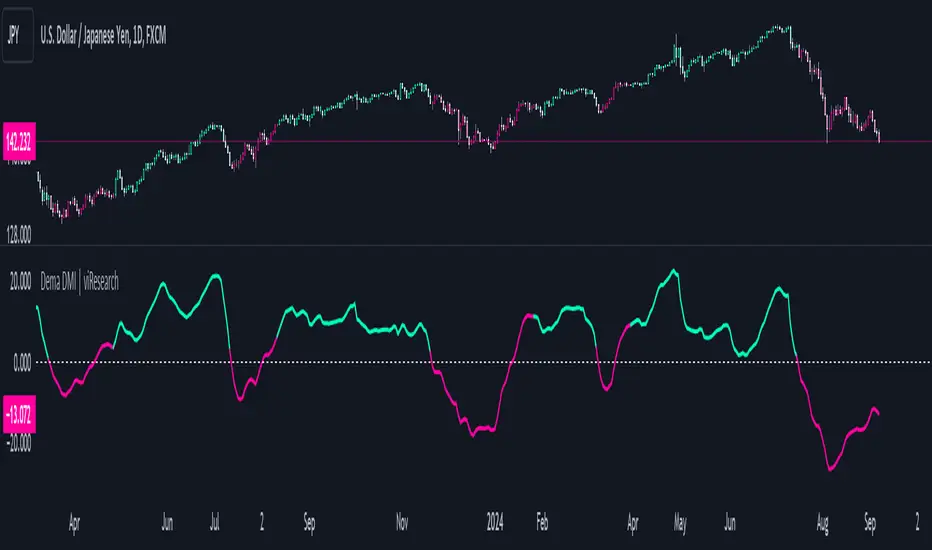
Dema DMI | viResearchDema DMI | viResearch
Conceptual Foundation and Innovation
The "Dema DMI" indicator integrates the Double Exponential Moving Average (DEMA) with the Directional Movement Index (DMI), creating a more responsive and precise trend-following system. The DEMA is used to smooth price data while minimizing lag, making it highly effective for trend detection. The DMI, on the other hand, measures the strength and direction of a trend by analyzing positive and negative directional movements. By combining these two elements, the "Dema DMI" offers traders a powerful tool for identifying trend changes and evaluating the strength of ongoing trends. This combination helps filter out noise in price data while maintaining sensitivity to market movements, providing better trend signals and decision-making opportunities.
Technical Composition and Calculation
The "Dema DMI" script uses two main components: the Double Exponential Moving Average (DEMA) and the Directional Movement Index (DMI). The DEMA is applied to both the high and low prices, creating smoothed versions of these prices based on a user-defined length. The DMI is then calculated by comparing changes in the smoothed high and low prices to measure directional movement. Positive directional movement (DM+) and negative directional movement (DM−) are calculated by evaluating whether the price is trending upward or downward, and the Average Directional Index (ADX) is computed to measure the strength of the trend. The ADX is smoothed to provide a more stable signal of trend strength.
Features and User Inputs
The "Dema DMI" script provides several customizable inputs, enabling traders to tailor the indicator to their strategies. The DEMA Length controls the period over which the DEMA is calculated for both high and low prices. The DMI Length sets the window for calculating directional movement, while the ADX Smoothing Length determines how smooth the ADX line appears, making it easier to assess whether a trend is strengthening or weakening. The script also includes customizable bar colors and alert conditions, providing traders with clear visual cues and notifications when a trend change occurs.
Practical Applications
The "Dema DMI" indicator is designed for traders looking to assess trend strength and direction more effectively. The DEMA smooths price movements, while the DMI highlights shifts in directional movement, providing early signals of potential trend reversals. The ADX helps gauge whether a trend is gaining momentum, allowing traders to improve the timing of trade entries and exits. Additionally, the customizable inputs make the indicator adaptable to different market conditions, ensuring its usefulness in both trending and ranging environments.
Advantages and Strategic Value
The "Dema DMI" script offers significant value by merging the smoothing effects of DEMA with the directional analysis of the DMI. This combination reduces the lag commonly associated with trend-following indicators, providing more timely and accurate trend signals. The ADX further enhances the indicator’s utility by measuring the strength of the trend, helping traders filter out weak signals and stay aligned with stronger trends. This makes the "Dema DMI" an ideal tool for traders seeking to improve their trend-following strategies and optimize their market positioning.
Alerts and Visual Cues
The script includes alert conditions that notify traders when a significant trend change occurs. The "Dema DMI Long" alert is triggered when the indicator detects an upward trend, while the "Dema DMI Short" alert signals a potential downward trend. Visual cues, such as changes in the bar color and the difference between positive and negative directional movement, help traders quickly identify trend shifts and act accordingly.
Summary and Usage Tips
The "Dema DMI | viResearch" indicator combines the smoothing benefits of the DEMA with the directional analysis of the DMI, providing traders with a reliable tool for detecting trend changes and confirming trend strength. By incorporating this script into your trading strategy, you can improve your ability to detect early trend reversals, confirm trend direction, and reduce noise in price data. The "Dema DMI" is a flexible and adaptable solution for traders looking to enhance their technical analysis in various market conditions.
Note: Backtests are based on past results and are not indicative of future performance.
RSI & ADX Controlled Entry Signals[deepakks444]Overview:
The "RSI & ADX Immediate Entry Signals" is a TradingView Pine Script designed to provide traders with timely entry signals based on two widely-used technical indicators: the Relative Strength Index (RSI) and the Average Directional Index (ADX). This script aims to maximize responsiveness to market conditions by generating buy and sell signals that reflect the current momentum and trend strength.
Key Components:
Relative Strength Index (RSI): The RSI is a momentum oscillator that measures the speed and change of price movements. It ranges from 0 to 100, typically identifying overbought conditions above 70 and oversold conditions below 30. This script utilizes an RSI threshold of 50 to determine bullish and bearish trends.
Average Directional Index (ADX): The ADX quantifies the strength of a trend without considering its direction. By setting a configurable threshold (default of 25), the script identifies strong trends in the market, facilitating entry signals based on trend direction.
Signal Generation:
Long Entry Signal: A buy signal is generated when the following conditions are met:
The +DI line (Positive Directional Indicator) is above the -DI line (Negative Directional Indicator).
The ADX exceeds the specified threshold (indicating trend strength).
The RSI is above 50 (indicating bullish momentum).
Short Entry Signal: A sell signal is triggered under these conditions:
The -DI line is above the +DI line.
The ADX exceeds the threshold.
The RSI is below 50 (indicating bearish momentum).
User Customization:
The script allows users to adjust the lengths for both the RSI and ADX calculations directly in the input settings to better suit their trading strategy and preferred timeframe.
Users can also customize the ADX threshold to modify sensitivity.
Benefits:
Responsiveness: This script eliminates lag and minimizes the potential for missed trading opportunities by providing immediate entry signals based on current market conditions.
Simplicity: Designed to assist traders in quickly identifying trend changes, this script makes it easy to visualize potential entry points without complex calculations.
Conclusion:
The "RSI & ADX Immediate Entry Signals" script is an effective tool for traders looking to add systematic, rules-based entry signals to their analysis. By combining momentum and trend strength indicators, this script enhances decision-making and can be easily integrated into larger trading strategies.
For immediate Buy/Sell signals keep ADX length at 3.

Golden Cross Strategy with Trend FilterHere's the English translation:
**Entry for Long Position:** Enter a long position only when the 5SMA crosses above the 25SMA and the current price is above the 75SMA.
**Entry for Short Position:** Enter a short position only when the 5SMA crosses below the 25SMA and the current price is below the 75SMA.
**Exit Position:** Hold the long position until a short signal is generated, and hold the short position until a long signal is generated.
By using the 75SMA to confirm the trend direction and taking positions only in alignment with that trend, you can enhance trading accuracy and potentially improve the profit factor.
Chandelier Exit Strategy with 200 EMA FilterStrategy Name and Purpose
Chandelier Exit Strategy with 200EMA Filter
This strategy uses the Chandelier Exit indicator in combination with a 200-period Exponential Moving Average (EMA) to generate trend-based trading signals. The main purpose of this strategy is to help traders identify high-probability entry points by leveraging the Chandelier Exit for stop loss levels and the EMA for trend confirmation. This strategy aims to provide clear rules for entries and exits, improving overall trading discipline and performance.
Originality and Usefulness
This script integrates two powerful indicators to create a cohesive and effective trading strategy:
Chandelier Exit : This indicator is based on the Average True Range (ATR) and identifies potential stop loss levels. The Chandelier Exit helps manage risk by setting stop loss levels at a distance from the highest high or lowest low over a specified period, multiplied by the ATR. This ensures that the stop loss adapts to market volatility.
200-period Exponential Moving Average (EMA) : The EMA acts as a trend filter. By ensuring trades are only taken in the direction of the overall trend, the strategy improves the probability of success. For long entries, the close price must be above the 200 EMA, indicating a bullish trend. For short entries, the close price must be below the 200 EMA, indicating a bearish trend.
Combining these indicators adds layers of confirmation and risk management, enhancing the strategy's effectiveness. The Chandelier Exit provides dynamic stop loss levels based on market volatility, while the EMA ensures trades align with the prevailing trend.
Entry Conditions
Long Entry
A buy signal is generated by the Chandelier Exit.
The close price is above the 200 EMA, indicating a strong bullish trend.
Short Entry
A sell signal is generated by the Chandelier Exit.
The close price is below the 200 EMA, indicating a strong bearish trend.
Exit Conditions
For long positions: The position is closed when a sell signal is generated by the Chandelier Exit.
For short positions: The position is closed when a buy signal is generated by the Chandelier Exit.
Risk Management
Account Size: 1,000,00 yen
Commission and Slippage: 17 pips commission and 1 pip slippage per trade
Risk per Trade: 10% of account equity
Stop Loss: For long trades, the stop loss is placed slightly below the candle that generated the buy signal. For short trades, the stop loss is placed slightly above the candle that generated the sell signal. The stop loss levels are dynamically adjusted based on the ATR.
Settings Options
ATR Period: Set the period for calculating the ATR to determine the Chandelier Exit levels.
ATR Multiplier: Set the multiplier for ATR to define the distance of stop loss levels from the highest high or lowest low.
Use Close Price for Extremums: Choose whether to use the close price for calculating the extremums.
EMA Period: Set the period for the EMA to adjust the trend filter sensitivity.
Show Buy/Sell Labels: Choose whether to display buy and sell labels on the chart for visual confirmation.
Highlight State: Choose whether to highlight the bullish or bearish state on the chart.
Sufficient Sample Size
The strategy has been backtested with a sufficient sample size to evaluate its performance accurately. This ensures that the strategy's results are statistically significant and reliable.
Notes
This strategy is based on historical data and does not guarantee future results.
Thoroughly backtest and validate results before using in live trading.
Market volatility and other external factors can affect performance and may not yield expected results.
Acknowledgment
This strategy uses the Chandelier Exit indicator. Special thanks to the original contributors for their work on the Chandelier Exit concept.
Clean Chart Explanation
The script is published with a clean chart to ensure that its output is readily identifiable and easy to understand. No other scripts are included on the chart, and any drawings or images used are specifically to illustrate how the script works.

Strategy SEMA SDI WebhookPurpose of the Code:
The strategy utilizes Exponential Moving Averages (EMA) and Smoothed Directional Indicators (SDI) to generate buy and sell signals. It includes features like leverage, take profit, stop loss, and trailing stops. The strategy is intended for backtesting and automating trades based on the specified indicators and conditions.
Key Components and Functionalities:
1.Strategy Settings:
Overlay: The strategy will overlay on the price chart.
Slippage: Set to 1.
Commission Value: Set to 0.035.
Default Quantity Type: Percent of equity.
Default Quantity Value: 50% of equity.
Initial Capital: Set to 1000 units.
Calculation on Order Fills: Enabled.
Process Orders on Close: Enabled.
2.Date and Time Filters:
Inputs for enabling/disabling start and end dates.
Filters to execute strategy only within specified date range.
3.Leverage and Quantity:
Leverage: Adjustable leverage input (default 3).
USD Percentage: Adjustable percentage of equity to use for trades (default 50%).
Initial Capital: Calculated based on leverage and percentage of equity.
4.Take Profit, Stop Loss, and Trailing Stop:
Inputs for enabling/disabling take profit, stop loss, and trailing stop.
Adjustable parameters for take profit percentage (default 25%), stop loss percentage (default 4.8%), and trailing stop percentage (default 1.9%).
Calculations for take profit, stop loss, trailing price, and maximum profit tracking.
5.EMA Calculations:
Fast and slow EMAs.
Smoothed versions of the fast and slow EMAs.
6.SDI Calculations:
Directional movement calculation for positive and negative directional indicators.
Difference between the positive and negative directional indicators, smoothed.
7.Buy/Sell Conditions:
Long (Buy) Condition: Positive DI is greater than negative DI, and fast EMA is greater than slow EMA.
Short (Sell) Condition: Negative DI is greater than positive DI, and fast EMA is less than slow EMA.
8.Strategy Execution:
If buy conditions are met, close any short positions and enter a long position.
If sell conditions are met, close any long positions and enter a short position.
Exit conditions for long and short positions based on take profit, stop loss, and trailing stop levels.
Close all positions if outside the specified date range.
Usage:
This strategy is used to automate trading based on the specified conditions involving EMAs and SDI. It allows backtesting to evaluate performance based on historical data. The strategy includes risk management through take profit, stop loss, and trailing stops to protect gains and limit losses. Traders can customize the parameters to fit their specific trading preferences and risk tolerance. Differently, it can perform leverage analysis and use it as a template.
By using this strategy, traders can systematically execute trades based on technical indicators, helping to remove emotional bias and improve consistency in trading decisions.
Important Note:
This script is provided for educational and template purposes and does not constitute financial advice. Traders and investors should conduct their research and analysis before making any trading decisions.

Filtered MACD with Backtest [UAlgo]The "Filtered MACD with Backtest " indicator is an advanced trading tool designed for the TradingView platform. It combines the Moving Average Convergence Divergence (MACD) with additional filters such as Moving Average (MA) and Average Directional Index (ADX) to enhance trading signals. This indicator aims to provide more reliable entry and exit points by filtering out noise and confirming trends. Additionally, it includes a comprehensive backtesting module to simulate trading strategies and assess their performance based on historical data. The visual backtest module allows traders to see potential trades directly on the chart, making it easier to evaluate the effectiveness of the strategy.
🔶 Customizable Parameters :
Price Source Selection: Users can choose their preferred price source for calculations, providing flexibility in analysis.
Filter Parameters:
MA Filter: Option to use a Moving Average filter with types such as EMA, SMA, WMA, RMA, and VWMA, and a customizable length.
ADX Filter: Option to use an ADX filter with adjustable length and threshold to determine trend strength.
MACD Parameters: Customizable fast length, slow length, and signal smoothing for the MACD indicator.
Backtest Module:
Entry Type: Supports "Buy and Sell", "Buy", and "Sell" strategies.
Stop Loss Types: Choose from ATR-based, fixed point, or X bar high/low stop loss methods.
Reward to Risk Ratio: Set the desired take profit level relative to the stop loss.
Backtest Visuals: Display entry, stop loss, and take profit levels directly on the chart with
colored backgrounds.
Alerts: Configurable alerts for buy and sell signals.
🔶 Filtered MACD : Understanding How Filters Work with ADX and MA
ADX Filter:
The Average Directional Index (ADX) measures the strength of a trend. The script calculates ADX using the user-defined length and applies a threshold value.
Trading Signals with ADX Filter:
Buy Signal: A regular MACD buy signal (crossover of MACD line above the signal line) is only considered valid if the ADX is above the set threshold. This suggests a stronger uptrend to potentially capitalize on.
Sell Signal: Conversely, a regular MACD sell signal (crossunder of MACD line below the signal line) is only considered valid if the ADX is above the threshold, indicating a stronger downtrend for potential shorting opportunities.
Benefits: The ADX filter helps avoid whipsaws or false signals that might occur during choppy market conditions with weak trends.
MA Filter:
You can choose from various Moving Average (MA) types (EMA, SMA, WMA, RMA, VWMA) for the filter. The script calculates the chosen MA based on the user-defined length.
Trading Signals with MA Filter:
Buy Signal: A regular MACD buy signal is only considered valid if the closing price is above the MA value. This suggests a potential uptrend confirmed by the price action staying above the moving average.
Sell Signal: Conversely, a regular MACD sell signal is only considered valid if the closing price is below the MA value. This suggests a potential downtrend confirmed by the price action staying below the moving average.
Benefits: The MA filter helps identify potential trend continuation opportunities by ensuring the price aligns with the chosen moving average direction.
Combining Filters:
You can choose to use either the ADX filter, the MA filter, or both depending on your strategy preference. Using both filters adds an extra layer of confirmation for your signals.
🔶 Backtesting Module
The backtesting module in this script allows you to visually assess how the filtered MACD strategy would have performed on historical data. Here's a deeper dive into its features:
Backtesting Type: You can choose to backtest for buy signals only, sell signals only, or both. This allows you to analyze the strategy's effectiveness in different market conditions.
Stop-Loss Types: You can define how stop-loss orders are placed:
ATR (Average True Range): This uses a volatility measure (ATR) multiplied by a user-defined factor to set the stop-loss level.
Fixed Point: This allows you to specify a fixed dollar amount or percentage value as the stop-loss.
X bar High/Low: This sets the stop-loss at a certain number of bars (defined by the user) above/below the bar's high (for long positions) or low (for short positions).
Reward-to-Risk Ratio: Define the desired ratio between your potential profit and potential loss on each trade. The backtesting module will calculate take-profit levels based on this ratio and the stop-loss placement.
🔶 Disclaimer:
Use with Caution: This indicator is provided for educational and informational purposes only and should not be considered as financial advice. Users should exercise caution and perform their own analysis before making trading decisions based on the indicator's signals.
Not Financial Advice: The information provided by this indicator does not constitute financial advice, and the creator (UAlgo) shall not be held responsible for any trading losses incurred as a result of using this indicator.
Backtesting Recommended: Traders are encouraged to backtest the indicator thoroughly on historical data before using it in live trading to assess its performance and suitability for their trading strategies.
Risk Management: Trading involves inherent risks, and users should implement proper risk management strategies, including but not limited to stop-loss orders and position sizing, to mitigate potential losses.
No Guarantees: The accuracy and reliability of the indicator's signals cannot be guaranteed, as they are based on historical price data and past performance may not be indicative of future results.

Strength Measurement -HTThe Strength Measurement -HT indicator is a tool designed to measure the strength and trend of a security using the Average Directional Index (ADX) across multiple time frames. This script averages the ADX values from five different time frames to provide a comprehensive view of the trend's strength, helping traders make more informed decisions.
Key Features:
Multi-Time Frame Analysis: The indicator calculates ADX values from five different time frames (5 minutes, 15 minutes, 30 minutes, 1 hour, and 4 hours) to offer a more holistic view of the market trend.
Trend Strength Visualization: The average ADX value is plotted as a histogram, with colors indicating the trend strength and direction, making it easy to visualize and interpret.
Reference Levels: The script includes horizontal lines at ADX levels 25, 50, and 75 to signify weak, strong, and very strong trends, respectively.
How It Works
Directional Movement Calculation: The script calculates the positive and negative directional movements (DI+) and (DI-) using the true range over a specified period (default is 14 periods).
ADX Calculation: The ADX value is derived from the smoothed moving average of the absolute difference between DI+ and DI-, normalized by their sum.
Multi-Time Frame ADX: ADX values are computed for the 5-minute, 15-minute, 30-minute, 1-hour, and 4-hour time frames.
Average ADX: The script averages the ADX values from the different time frames to generate a single, comprehensive ADX value.
Trend Visualization: The average ADX value is plotted as a histogram with colors indicating:
Gray for weak trends (ADX < 25)
Green for strengthening trends (25 ≤ ADX < 50)
Dark Green for strong trends (ADX ≥ 50)
Light Red for weakening trends (ADX < 25)
Red for strong trends turning weak (ADX ≥ 25)
Usage
Trend Detection: Use the color-coded histogram to quickly identify the trend strength and direction. Green indicates a strengthening trend, while red signifies a weakening trend.
Reference Levels: Utilize the horizontal lines at ADX levels 25, 50, and 75 as reference points to gauge the trend's strength.
ADX < 25 suggests a weak trend.
ADX between 25 and 50 indicates a moderate to strong trend.
ADX > 50 points to a very strong trend.
Multi-Time Frame Insight: Leverage the averaged ADX value to gain insights from multiple time frames, helping you make more informed trading decisions based on a broader market perspective.
Feel free to explore and integrate this indicator into your trading strategy to enhance your market analysis and decision-making process. Happy trading!

ADX and SADX, SDIThe indicator aims to analyze and visualize the Average Directional Index (ADX) and its smoothed versions, along with directional indicators (DI) to help traders identify trend strength and potential buy/sell signals.
Indicator Settings:
The indicator is named "ADX and SADX, SDI" and is set to display prices with a precision of 2 decimal places.
Users can customize the ADX smoothing length, DI length, ADX smoothing period, and DI smoothing period through input variables.
Directional Movement (DM) Calculation:
The function dirmov calculates the positive and negative directional movements (DM) and the smoothed values of the positive directional index (DI+) and negative directional index (DI-).
This is done using the average true range (ATR) to normalize the DM values.
Average Directional Index (ADX) Calculation:
The function adx calculates the ADX, which measures the strength of a trend.
It uses the DI+ and DI- values to compute the ADX value.
Smoothed ADX and DI Calculation:
The ADX values are further smoothed using a simple moving average (SMA).
The DI difference is also smoothed and used to determine the trend direction.
Buy and Sell Signals:
A buy signal is generated when the DI+ crosses above DI- and the smoothed DI difference is increasing.
A sell signal is generated when the DI- crosses above DI+ and the smoothed DI difference is decreasing.
Plotting:
The ADX, smoothed ADX, smoothed DI difference (SPM), DI+, and DI- values are plotted on the chart.
Horizontal lines are drawn to indicate threshold levels (e.g., level 22).
Background and bar colors change based on buy (lime) and sell (maroon) signals to visually indicate these conditions.
Purpose of the Code:
This Pine Script code is used to create a custom indicator on TradingView that helps traders identify the strength and direction of a trend. The Average Directional Index (ADX) is used to measure trend strength, while the Directional Indicators (DI+ and DI-) are used to determine the direction of the trend. The smoothed versions of these indicators (SADX and SDI) provide additional confirmation and smoothing to reduce noise and false signals. Traders can use the buy and sell signals generated by this indicator to make informed trading decisions based on the trend strength and direction.
Important Note:
This script is provided for educational purposes and does not constitute financial advice. Traders and investors should conduct their research and analysis before making any trading decisions.

Trend Momentum Strength Indicator, Built for Pairs TradingOverview:
This script combines multiple indicators to provide a comprehensive analysis of both trend strength and trend momentum. It is tailored specifically for pairs trading strategies but can also be used for other trading strategies.
Benefit of Comprehensive Analysis:
Having an indicator that evaluates both trend strength and trend momentum is crucial for traders looking to make informed decisions. It allows traders to not only identify the direction and intensity of a trend but also gauge the momentum behind it. This dual capability helps in confirming potential trade opportunities, whether for entering trades with strong trends or considering reversals during overbought or oversold conditions. By integrating both aspects into one tool, traders can gain a holistic view of market dynamics, enhancing their ability to time entries and manage risk effectively.
Features:
* Trend Strength:
Enhanced ADX Formula: The script includes modifications to the standard ADX formula along with DI+ and DI- to provide more responsive trend strength readings.
Directional Indicators: DI+ (green line) indicates positive directional movement, while DI- (red line) indicates negative directional movement.
Trend Momentum:
Modified Stochastic Indicators: The script uses %K and %D indicators, modified and combined with ADX to give a clear indication of trend momentum.
Momentum Strength: This helps determine the strength and direction of the momentum.
Trading Signals:
Combining Indicators: The script combines ADX, DI+, DI-, %K, and %D to generate comprehensive trading signals.
Optimal Entry Points: Designed to identify optimal entry points for trades, particularly in pairs trading.
Colored Area at Bottom:
This area provides two easy-to-read functions:
Color:
Green: Upward momentum (ratio above 1)
Red: Downward momentum (ratio below 1)
Height:
Higher in green: Stronger upward momentum
Lower in red: Stronger downward momentum
Legend:
Green Line: DI+ (Positive)
Red Line: DI- (Negative)
Black Line: ADX
How to Read This Indicator:
1) Trend Direction:
DI+ above DI-: Indicates an upward trend.
DI- above DI+: Indicates a downward trend.
2) Trend Strength:
ADX below 20: Indicates a neutral trend.
ADX between 20 and 25: Indicates a weak trend.
ADX above 25: Indicates a strong trend.
Trading Signals in Pairs Trading:
Neutral Trend: Ideal for pairs trading when no strong trend is detected.
Overbought/Oversold: Uses %K and %D to identify overbought/oversold conditions that support trade decisions.
Entry Signals: Green signals for long positions, red signals for short positions, based on combined criteria of neutral trend strength and supportive momentum.
Application in Pairs Trading:
Neutral trend: In pairs trading strategies, where neutral movement is often sought, this indicator provides signals that are especially relevant during periods of neutral trend strength and supportive momentum, aiding traders in identifying optimal entry
Risk Management: Combining signals from ADX, DI+, DI-, %K, and %D helps traders make more informed decisions regarding entry points, enhancing risk management.
Example Chart (The indicator is on the upper right corner):
Clean Presentation: The chart only includes the necessary elements to demonstrate the indicator’s functionality.
Demonstrates: Overbought/oversold conditions, upward/downward/no momentum, and trading signals with/without specific scenarios.

Average Directional Index ProThe Average Directional Index (ADX) is a moving average of a range, usually 14 days, that's used to quantify the strength and direction of a trend. ADX values are significant in that lower values indicate a weak to non-existent trend, i.e. ADX=14, whereas an ADX=40 is indicative of a strong trend. Additionally, a weak trend could signal that price has entered in to a consolidation phase. A trader could wait for price to rise or fall out of a supply zone while simultaneously looking for ADX values to climb up and over the 25 level, since the ADX could be strong enough for price to trend after the breakout. As a result, this type of setup could be an excellent entry for a trade. Keep in mind that price is the signal most important value on a chart so it's important to use an indicator like this to confirm a particular bias that you may have.
💥💥💥💥💥
Instead of using a single line as most ADX indicators do, I thought that showing the values in terms of histogram bars would be highly intuitive and provide an interesting visual that would illustrate with varying degrees of color where the strength (or lack thereof) lies at any given time. The following are some of the characteristics that I feel make this script stand out from the pack.
💡Histogram plots. ADX values range from 0-100 and it may seem counterintuitive to see an ADX value below a 0 line. With this approach, I've divided up the ADX values between "bull" and "bear", meaning if an ADX histogram bar is above the 0 line (no matter if the value is 5 or 50), it's because the DMI+ value is ABOVE the DMI- value. Conversely, if the ADX histogram bar is below the 0 line, it's because the DMI- value is ABOVE the DMI+ value. DMI and ADX go hand-in-hand and while DMI values do not play a prominent role here, you'll see their values in the Main Label.
💡Main label. The main label's color will correspond to that of the histogram bar. The DMI and ADX values are listed along with the current price of the asset. Whichever DMI value is higher will be listed ahead of the lower value. In other words, from left to right, you'll see the ADX value followed by the higher of the 2 DMI values followed by the lesser of the 2 DMI values. The ADX value will be followed by an icon showing you if the value is rising or falling. Additionally, the main label has some extras: both buy/sell % on the current chart as well as daily chart along with total volume and average volume for the respective time frames. You can also change the MA lengths for the chart and daily TF averages. Both buy/sell % and total/avg volume values come with their own significant values inputs.
💡Color coded histogram bars dependent on ADX values. A few examples: an ADX value between 30 and 40 when DI+ > DI-, you'll see a dark green bar. Conversely, if the ADX value is > 70 and DI- > DI+, you'll get a dark purple bar. All in all, there's 18 possible colors denoted within the histogram.
💡Momentum arrows. There's 4 colors for the up/down arrows that populate above the histogram bar when DI+ and DI- combined with ADX values are showing extreme values. An example would be when DI+ is between 30 and 50 and ADX is greater than 30, you'll get a green arrow. On the flipside, when DI- is greater than -50 and ADX is greater than 40, you'll see a dark red arrow.
💡ADX and price shown on the histogram. You can choose to have the price and ADX values side by side or on top of one another as well as change the decimal value with a "significant figure" input. You can also opt to have neither value shown. The values will show above or below their respective bar dependent upon if DMI+ or DMI- is the dominant value, which in turn determines if the histogram is above or below the 0 line.
💡Weak trend colors. Any ADX values between 0 to 23 will give varying degrees of black to light gray indicating a weak or no trend. An ADX value of 17 could indicate a weak trend but the value could be rising as buyers push price higher. As the ADX approaches 25, wait for price confirmation (and volume) to validate if momentum could continue.
💡Threshold lines. ADX values above +/- 25-30 tend to show a strengthening of trend and you can choose to include these lines or not in your charts.
💡ADX value follow line. Determined by DMI+ being > or < than DMI-. For instance, if the trend changes and DMI- crosses over DMI+, the follow line will switch to follow the ADX histogram bar as it falls below 0. You can choose to enable/disable this line.
💡Colored bars. You can choose to enable the ADX color schemes to your candles further providing an easy view of the current trend.
💥💥💥💥💥
Remember to use any indicator together with price action to confirm a particular bias you may have! You could also use this indicator in confluence with my Directional Movement Pro script for an extra visual on trend direction and strength.
💥💥💥💥💥
Should you have any questions, feedback etc, please do not hesitate to contact the script's author. My hope is that this indicator becomes an invaluable resource to you and you're able to integrate it in to your everyday trading tool bag to make more informed decisions.
SimpleCryptoLife helped me code up this script and he's been an incredible source of knowledge in my trading journey. Without his patience and pine script expertise, this script would not have been possible!

Session MasterSession Master Indicator
Overview
The "Session Master" indicator is a unique tool designed to enhance trading decisions by providing visual cues and relevant information during the critical last 15 minutes of a trading session. It also integrates advanced trend analysis using the Average Directional Index (ADX) and Directional Movement Index (DI) to offer insights into market trends and potential entry/exit points.
Originality and Functionality
This script combines session timing, visual alerts, and trend analysis in a cohesive manner to give traders a comprehensive view of market behavior as the trading day concludes. Here’s a breakdown of its key features:
Last 15 Minutes Highlight : The script identifies the last 15 minutes of the trading session and highlights this period with a semi-transparent blue background, helping traders focus on end-of-day price movements.
Previous Session High and Low : The script dynamically plots the high and low of the previous trading session. These levels are crucial for identifying support and resistance and are highlighted with dashed lines and labeled for easy identification during the last 15 minutes of the current session.
Directional Movement and Trend Analysis : Using a combination of ADX and DI, the script calculates and plots trend strength and direction. A 21-period Exponential Moving Average (EMA) is plotted with color coding (green for bullish and red for bearish) based on the DI difference, offering clear visual cues about the market trend.
Technical Explanation
Last 15 Minutes Highlight:
The script checks the current time and compares it to the session’s last 15 minutes.
If within this period, the background color is changed to a semi-transparent blue to alert the trader.
Previous Session High and Low:
The script retrieves the high and low of the previous daily session.
During the last 15 minutes of the session, these levels are plotted as dashed lines and labeled appropriately.
ADX and DI Calculation:
The script calculates the True Range, Directional Movement (both positive and negative), and smoothes these values over a specified length (28 periods by default).
It then computes the Directional Indicators (DI+ and DI-) and the ADX to gauge trend strength.
The 21-period EMA is plotted with dynamic color changes based on the DI difference to indicate trend direction.
How to Use
Highlight Key Moments: Use the blue background highlight to concentrate on market movements in the critical last 15 minutes of the trading session.
Identify Key Levels: Pay attention to the plotted high and low of the previous session as they often act as significant support and resistance levels.
Assess Trend Strength: Use the ADX and DI values to understand the strength and direction of the market trend, aiding in making informed trading decisions.
EMA for Entry/Exit: Use the color-coded 21-period EMA for potential entry and exit signals based on the trend direction indicated by the DI.
Conclusion
The "Session Master" indicator is a powerful tool designed to help traders make informed decisions during the crucial end-of-session period. By combining session timing, previous session levels, and advanced trend analysis, it provides a comprehensive overview that is both informative and actionable. This script is particularly useful for intraday traders looking to optimize their strategies around session close times.

ADX / Connectable [Azullian]
Streamline your strategy with the ADX indicator. Precisely analyze market strength and direction, integrating these insights for more adaptable trading decisions.
This connectable ADX indicator is part of an indicator system designed to help test, visualize and build strategy configurations without coding. Like all connectable indicators , it interacts through the TradingView input source, which serves as a signal connector to link indicators to each other. All connectable indicators send signal weight to the next node in the system until it reaches either a connectable signal monitor, signal filter and/or strategy.
█ UNIFORM SETTINGS AND A WAY OF WORK
Although connectable indicators may have specific weight scoring conditions, they all aim to follow a standardized general approach to weight scoring settings, as outlined below.
■ Connectable indicators - Settings
• 🗲 Energy: Energy applies an ATR multiplier to the plotted shapes on the chart. A higher value plots shapes farther away from the candle, enhancing visibility.
• ☼ Brightness: Brightness determines the opacity of the shape plotted on the chart, aiding visibility. Indicator weight also influences opacity.
• → Input: Use the input setting to specify a data source for the indicator. Here you can connect the indicator to other indicators.
• ⌥ Flow: Determine where you want to receive signals from:
○ Both: Weights from this indicator and the connected indicator will apply
○ Indicator only: Only weights from this indicator will apply
○ Input only: Only weights from the connected indicator will apply
• ⥅ Weight multiplier: Multiply all weights in the entire indicator by a given factor, useful for quickly testing different indicators in a granular setup.
• ⥇ Threshold: Set a threshold to indicate the minimum amount of weight it should receive to pass it through to the next indicator.
• ⥱ Limiter: Set a hard limit to the maximum amount of weight that can be fed through the indicator.
■ Connectable indicators - Weight scoring settings
▢ Weight scoring conditions
• SM – Signal mode: Enable specific conditions for weight scoring
○ All: All signals will be scored.
○ Entries only: Only entries will score
○ Exits only: Only exits will score.
○ Entries & exits: Both entries and exits will score.
○ Zone: Continuous scoring for each candle within the zone.
• SP – Signal period: Defines a range of candles within which a signal can score.
• SC - Signal count: Specifies the number of bars to retrospectively examine and score.
○ Single: Score for a single occurrence
○ All occurrences: Score for all occurrences
○ Single + Threshold: Score for single occurrences within the signal period (SP)
○ Every + Threshold: Score for all occurrences within the signal period (SP)
▢ Weight scoring direction
• ES: Enter Short weight
• XL: Exit long weight
• EL: Enter Long weight
• XS: Exit Short weight
▢ Weight scoring values
• Weights can hold either positive or negative scores. Positive weights enhance a particular trading direction, while negative weights diminish it.
█ ADX - INDICATOR SETTINGS
■ Main settings
• Enable/Disable Indicator: Toggle the entire indicator on or off.
• S - Source: Choose an alternative data source for the ADX calculation.
• T - Timeframe: Select an alternative timeframe for the ADX calculation.
• SM - Smoothing: Smooth the length averages.
• LE - DI Length: Determine the DI: Directional indicator length.
• TH - Trend threshold: Specify the level the ADX has to cross
• EM - Entry signal mode: Determine entry mode
○ DI: Use only DI+ and DI- crossings
○ DI + ADX: Use DI with increasing ADX
○ DI + ADX + Invert: Use DI with increasing ADX and DI with decreasing ADX
• XM - Exit signal mode: Determine exit mode
○ DI: Use DI crossing to exit
○ ADX: Use decreasing ADX to signal exit
■ Scoring functionality
• The ADX scores long entries when the ADX crosses the TH: Trend threshold and +DM is greater than -DM
• The ADX scores long exits when the ADX falls back below the TH: Trend threshold and +DM is greater than -DM
• The ADX scores long zones the entire time the ADX is above the TH: Trend threshold and +DM is greater than -DM
• The ADX scores short entries when the ADX crosses the TH: Trend threshold and +DM is smaller than -DM
• The ADX scores short exits when the ADX falls back below the TH: Trend threshold and +DM is smaller than -DM
• The ADX scores short zones the entire time the ADX is above the TH: Trend threshold and +DM is smaller than -DM
█ PLOTTING
• Standard: Symbols (EL, XS, ES, XL) appear relative to candles based on set conditions. Their opacity and position vary with weight.
• Conditional Settings: A larger icon appears if global conditions are met. For instance, with a Threshold(⥇) of 12, Signal Period (SP) of 3, and Scoring Condition (SC) set to "EVERY", an ADX signaling over two times in 3 candles (scoring 6 each) triggers a larger icon.
█ USAGE OF CONNECTABLE INDICATORS
■ Connectable chaining mechanism
Connectable indicators can be connected directly to the signal monitor, signal filter or strategy , or they can be daisy chained to each other while the last indicator in the chain connects to the signal monitor, signal filter or strategy. When using a signal filter you can chain the filter to the strategy input to make your chain complete.
• Direct chaining: Connect an indicator directly to the signal monitor, signal filter or strategy through the provided inputs (→).
• Daisy chaining: Connect indicators using the indicator input (→). The first in a daisy chain should have a flow (⌥) set to 'Indicator only'. Subsequent indicators use 'Both' to pass the previous weight. The final indicator connects to the signal monitor, signal filter and/or strategy.
■ Set up this indicator with a signal filter and strategy
The indicator provides visual cues based on signal conditions. However, its weight system is best utilized when paired with a connectable signal filter, signal monitor, and/or strategy .
Let's connect the ADX to a connectable signal filter and a strategy :
1. Load all relevant indicators
• Load ADX / Connectable
• Load Signal filter / Connectable
• Load Strategy / Connectable
2. Signal Filter: Connect the ADX to the Signal Filter
• Open the signal filter settings
• Choose one of the three input dropdowns (1→, 2→, 3→) and choose : ADX / Connectable: Signal Connector
• Toggle the enable box before the connected input to enable the incoming signal
3. Signal Filter: Update the filter signals settings if needed
• The default settings of the filter enable EL (Enter Long), XL (Exit Long), ES (Enter Short) and XS (Exit Short).
4. Signal Filter: Update the weight threshold settings if needed
• All connectable indicators load by default with a score of 6 for each direction (EL, XL, ES, XS)
• By default, weight threshold (TH) is set at 5. This allows each occurrence to score, as the default score in each connectable indicator is 1 point above the threshold. Adjust to your liking.
5. Strategy: Connect the strategy to the signal filter in the strategy settings
• Select a strategy input → and select the Signal filter: Signal connector
6. Strategy: Enable filter compatible directions
• Set the signal mode of the strategy to a compatible direction with the signal filter.
Now that everything is connected, you'll notice green spikes in the signal filter representing long signals, and red spikes indicating short signals. Trades will also appear on the chart, complemented by a performance overview. Your journey is just beginning: delve into different scoring mechanisms, merge diverse connectable indicators, and craft unique chains. Instantly test your results and discover the potential of your configurations. Dive deep and enjoy the process!
█ BENEFITS
• Adaptable Modular Design: Arrange indicators in diverse structures via direct or daisy chaining, allowing tailored configurations to align with your analysis approach.
• Streamlined Backtesting: Simplify the iterative process of testing and adjusting combinations, facilitating a smoother exploration of potential setups.
• Intuitive Interface: Navigate TradingView with added ease. Integrate desired indicators, adjust settings, and establish alerts without delving into complex code.
• Signal Weight Precision: Leverage granular weight allocation among signals, offering a deeper layer of customization in strategy formulation.
• Signal Filtering: Define entry and exit conditions with more clarity, granting an added layer of strategy precision.
• Clear Visual Feedback: Distinct visual signals and cues enhance the readability of charts, promoting informed decision-making.
• Standardized Defaults: Indicators are equipped with universally recognized preset settings, ensuring consistency in initial setups across different types like momentum or volatility.
• Reliability: Our indicators are meticulously developed to prevent repainting. We strictly adhere to TradingView's coding conventions, ensuring our code is both performant and clean.
█ COMPATIBLE INDICATORS
Each indicator that incorporates our open-source 'azLibConnector' library and adheres to our conventions can be effortlessly integrated and used as detailed above.
For clarity and recognition within the TradingView platform, we append the suffix ' / Connectable' to every compatible indicator.
█ COMMON MISTAKES, CLARIFICATIONS AND TIPS
• Removing an indicator from a chain: Deleting a linked indicator and confirming the "remove study tree" alert will also remove all underlying indicators in the object tree. Before removing one, disconnect the adjacent indicators and move it to the object stack's bottom.
• Point systems: The azLibConnector provides 500 points for each direction (EL: Enter long, XL: Exit long, ES: Enter short, XS: Exit short) Remember this cap when devising a point structure.
• Flow misconfiguration: In daisy chains the first indicator should always have a flow (⌥) setting of 'indicator only' while other indicator should have a flow (⌥) setting of 'both'.
• Hide attributes: As connectable indicators send through quite some information you'll notice all the arguments are taking up some screenwidth and cause some visual clutter. You can disable arguments in Chart Settings / Status line.
• Layout and abbreviations: To maintain a consistent structure, we use abbreviations for each input. While this may initially seem complex, you'll quickly become familiar with them. Each abbreviation is also explained in the inline tooltips.
• Inputs: Connecting a connectable indicator directly to the strategy delivers the raw signal without a weight threshold, meaning every signal will trigger a trade.
█ A NOTE OF GRATITUDE
Through years of exploring TradingView and Pine Script, we've drawn immense inspiration from the community's knowledge and innovation. Thank you for being a constant source of motivation and insight.
█ RISK DISCLAIMER
Azullian's content, tools, scripts, articles, and educational offerings are presented purely for educational and informational uses. Please be aware that past performance should not be considered a predictor of future results.

CulturaTrading IndicadorThe CULTURATRADING INDICATOR refines trading signals by integrating advanced analysis techniques across RSI, MACD, and ADX indicators. Here's a deep dive into its functionalities:
RSI Analysis:
Buying Signal Identification: The RSI component is calibrated not just to flag potential reversal points but to identify strong momentum. An RSI exceeding 60 is not merely an overbought signal; it indicates a robust buying momentum when it turns blue, aligning with CULTURATRADING STRATEGY's criteria for a potential long position.
Level 55 Significance: This level acts as a transitional threshold. When the RSI retreats below this point, it suggests a weakening momentum, prompting a reassessment of open positions.
Oversold Condition & Action: An RSI dipping below 40 signals an oversold condition, turning red, and aligning with a potential for a next long signal. staying alert when RSI stay over 40 level again and over on RSI Moving Average Following the idea CULTURATRADING STRATEGY.
Moving Average on RSI (MA RSI):
The inclusion of a Moving Average on the RSI serves as a trend filter. When the RSI is above the MA RSI, it underscores the strength of the current trend; conversely, if the RSI falls below the MA RSI, it calls for close all RSI long trade.
Volatility Histogram:
Color Coding & Market Response: The histogram changes colors based on market volatility and trend strength. Blue indicates a bullish trend continuation, where traders might consider entering long or holding positions. Rose suggests a market shift where traders should be vigilant, potentially taking profits from long or opening shorts positions. Grey denotes low volatility, signaling a period of market indecision where entering new trades may carry higher risk. staying out
Stop-Loss Placement: The histogram assists in identifying optimal stop-loss levels, providing visual cues for setting them just beyond the recent volatility extremes to protect against market whipsaws.
ADX Trend Strength Layer:
This layer offers a visual representation of the trend's strength. A rising ADX above the 25 level with a slope on the MACD line indicates a strong trend and defining directionality to trade (long if it close blue or short if its close rose), reinforcing the confidence in following the trend.
Usage & Importance:
While the CULTURATRADING STRATEGY provides a robust framework for trade execution, the CULTURATRADING INDICATOR is crucial for visualizing and confirming the signals it generates. It simplifies the complex interplay of various technical signals into a coherent visual format, aiding traders in making informed decisions.
The combination of RSI, MA RSI, and the volatility histogram offers a tri-layered approach to market analysis, enabling traders to discern between strong trends, pullbacks, and consolidations.
By integrating these elements, the CULTURATRADING INDICATOR serves as an indispensable tool for traders utilizing the CULTURATRADING STRATEGY, providing clarity and enhancing decision-making efficacy.
Disclaimer:
This indicator is designed for educational purposes to provide a visual aid in market analysis. Traders are advised to use it as part of a comprehensive risk-managed strategy. It is not intended as financial advice.