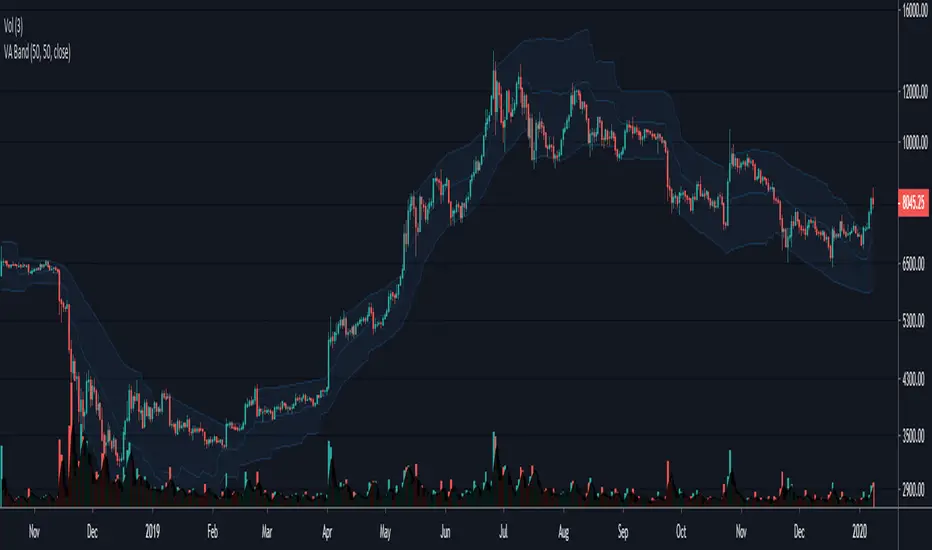
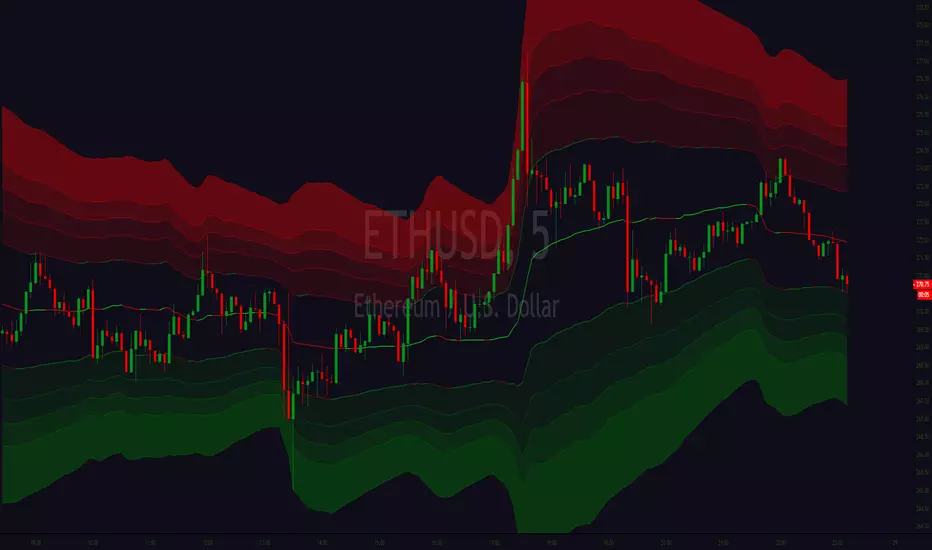
Volatility BandsWe used Marc Chaikin’s Chaikin Volatility as somewhat of a baseline for this indicator and then built on it. Like Chaikin Volatility, our indicator draws primarily upon high-low spreads to quantify a security’s volatility. It also has similarities to Keltner Channels as it uses ATR rather than standard deviations in its calculation of the different bands.
Inputs:
int ‘len0’, lookback window for fast EMA of high-low ranges.
int ‘len1’, lookback window for slow EMA of high-low ranges.
int ‘len2’, lookback window for slow EMA of closing prices.
float ‘m0’, ATR multiplier for first upper and lower volatility bands.
float ‘m1’, ATR multiplier for second upper and lower volatility bands.
float ‘m2’, ATR multiplier for third upper and lower volatility bands.
int ‘lenATR’, window length for ATR calculation.
Output: 3 Upper and Lower Volatility Bands (6 total).
1. Compute High Low Spread for current period.
hlr = (high – low)
2. Calculate Exponential Moving Average of HLR at length len0
fastEMA = ema(hlr, len0)
3. Calculate Exponential Moving average of HLR at length len1 (where len1 > len0)
slowEMA = ema(hlr, len1)
4. Get EMA of closing prices at length len2(where len2 > len1 and len1 > len0)
priceEMA = ema(close, len2)
5. Use adjusted Chaikin Volatility Formula to quantify volatility
v = (fastEMA – slowEMA) / slowEMA
6. Calculate three upper and three lower volatility bands (6 total):
ex:
upper0 = priceEMA + ((1 – cv) * (atrMult0 * atr(lenATR)))
lower0 = priceEMA – ((1 – cv) * (atrMult0 * atr(lenATR)))
One possible way to use this indicator is to enter a long position when the security’s price falls below the lowest volatility band and then exit when it crosses above the third upper band. This seems to get the best results for quick, high frequency trading. Another approach is to enter a position when the bands begin to break out from a compact state and the width between them increases.
Still tweaking the idea, so any feedback would be appreciated.
Bands

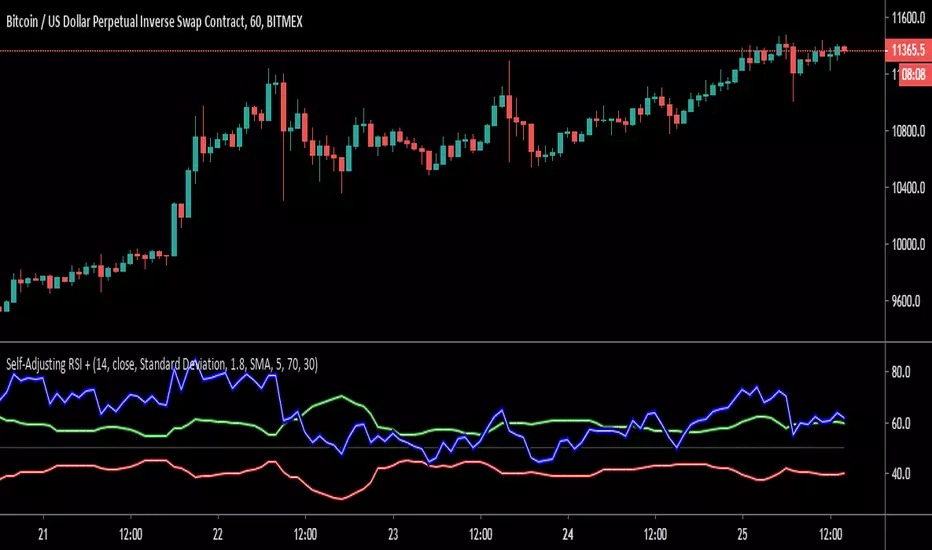
Self-Adjusting RSI +Here is an open source (no request needed!) version of the Self-Adjusting RSI by David Sepiashvili.
Published in Stocks & Commodities V. 24:2 (February, 2006): The Self-Adjusting RSI
David Sepiashvili's article, "The Self-Adjusting RSI," presents a technique to adjust the traditional RSI overbought and oversold thresholds so as to ensure that 70-80% of RSI values lie between the two thresholds. Sepiashvili presents two algorithms for adjusting the thresholds. One is based on standard deviation, the other on a simple moving average of the RSI.
This script allows you to choose between plotting the Self-Adjusting bands or the traditional bands. You can also plot a smoothed RSI (SMA or EMA) and change the theme color for dark or light charts.
If you find this code useful, please pass it forward by sharing open source!
Thank you to all of the open source heroes out there!
"If I have seen a little further it is by standing on the shoulders of Giants."
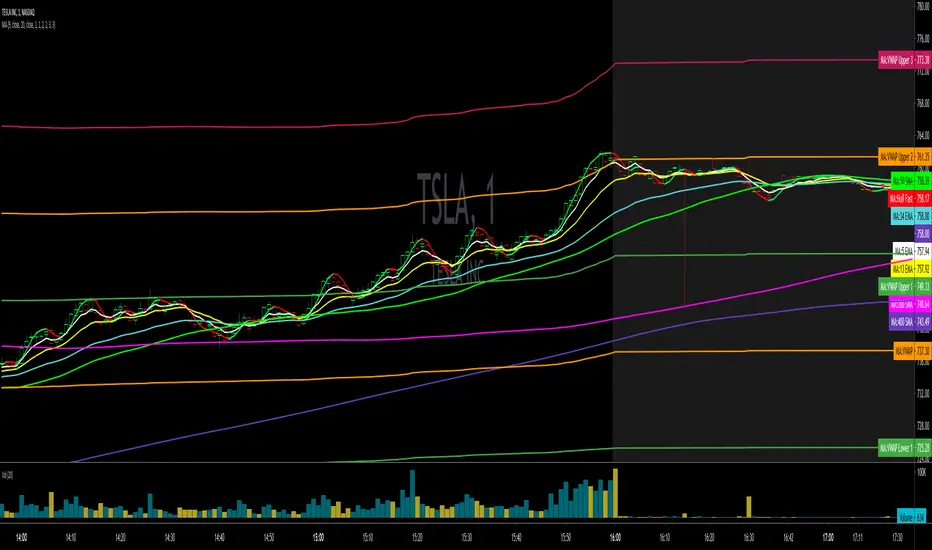
Moving Averages + VWAPA moving average (MA) is a widely used indicator in technical analysis that helps smooth out price action by filtering out the “noise” from random short-term price fluctuations. It is a trend-following, or lagging, indicator because it is based on past prices.
The two basic and commonly used moving averages are the simple moving average (SMA), which is the simple average of a security over a defined number of time periods, and the exponential moving average (EMA), which gives greater weight to more recent prices.
The most common applications of moving averages are to identify the trend direction and to determine support and resistance levels.
Script includes
4 EMA
5 EMA
8 EMA
9 EMA
13 EMA
20 EMA
20 SMA
21 EMA
34 EMA
50 EMA
50 SMA
55 EMA
200 SMA
The volume weighted average price (VWAP) is a trading benchmark used by traders that gives the average price a security has traded at throughout the day, based on both volume and price. It is important because it provides traders with insight into both the trend and value of a security.
VWAP + VWAP bands
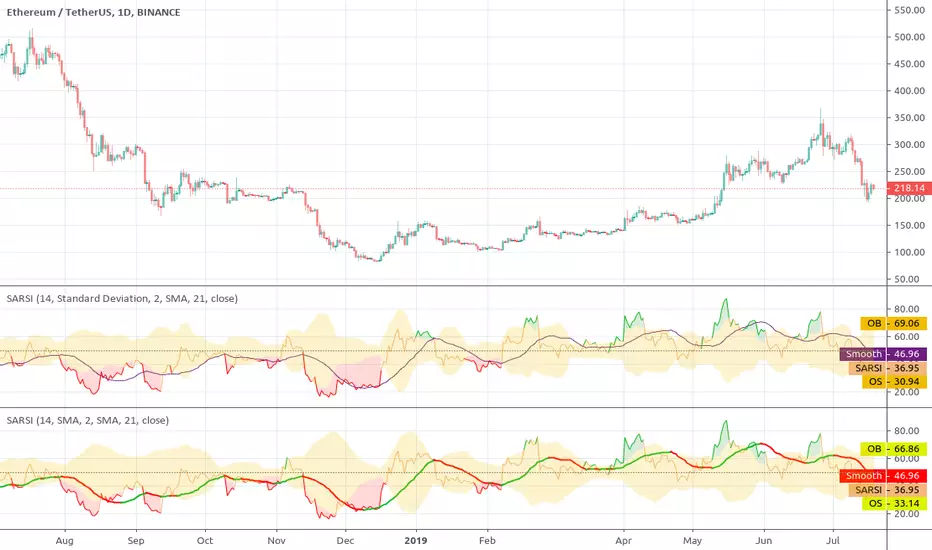
Self-Adjusting RSIThis indicator was originally developed by David Sepiashvili (Stocks & Commodities V. 24:2 (February, 2006): The Self-Adjusting RSI ).
The author presented a technique to adjust the traditional RSI overbought and oversold thresholds so as to ensure that 70-80% of RSI values lie between the two thresholds.
He used two algorithms for adjusting:
Standard Deviation-based
Simple Moving Average-based
Easy and straightforward. But this is not a true way.
Source code on request
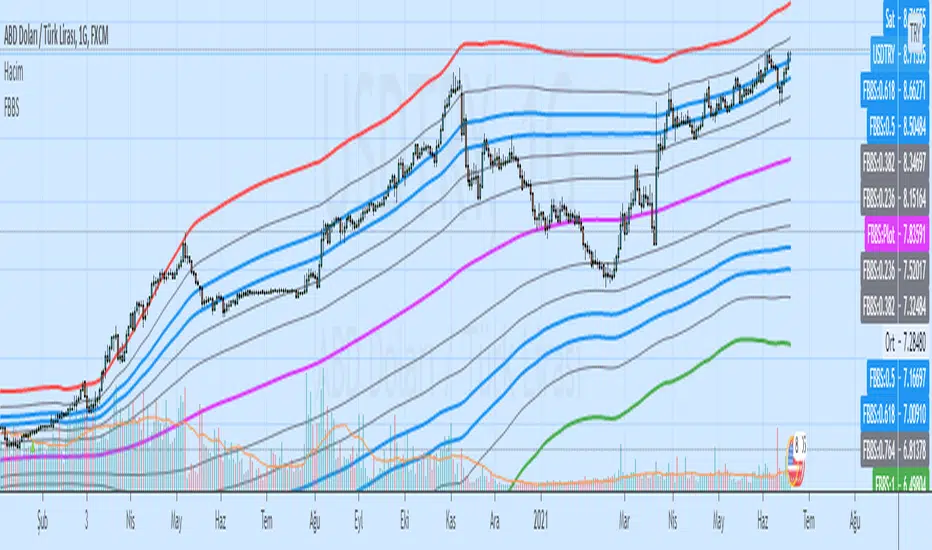
Volatility Adjusted Bands - JD This indicator gives a likely trading range based on the volatility of the past x amount of bars, measured against a certain moving average.
The indicator can be used as an alternative for BBands.
It gives approx. the same "trend-side" lines (upper line in uptrend, lower line in down trend) as the Bollinger Bands, but the opposite line follows closer on price,
Instead of "flying out" to the other direction like in BBands.
As a comparison, the BBands for the same length (50 period) are added on the chart.
JD.
#NotTradingAdvice #DYOR
I build these indicators for myself and provide them open source, to use for free to use and improve upon,
as I believe the best way to learn is toghether.
Volume (Incremental) Weighted VOLATILITY BANDSDISCLAIMER:
The Following indicator/code IS NOT intended to be a formal investment advice or recommendation by the author, nor should be construed as such. Users will be fully responsible by their use regarding their own trading vehicles/assets.
The following indicator was made for NON LUCRATIVE ACTIVITIES and must remain as is following TradingView's regulations. Use of indicator and their code are published by Invitation Only for work and knowledge sharing. All access granted over it, their use, copy or re-use should mention authorship(s) and origin(s).
WARNING NOTICE!
THE INCLUDED FUNCTION MUST BE CONSIDERED AS TESTING. The models included in the indicator have been taken from openly sources on the web, problems could occur at diverse data sceneries.
WHAT'S THIS...?
Work derived by previous own research for study:
The given indicator is another VWAP analysis tool that contains openly procedures for rolling out time sessions as in other TradingView scripts .
Some novelties are introduced in this version:
INCREMENTAL WEIGHTED STANDARD DEVIATION BANDS: The calculation on this script are strictly based in regard of University of Cambridge Computing Service, February 2009 paper by Tony Finch publicly found at people.ds.cam.ac.uk .
From the Abstract, he explain how to derive formulae for numerically stable calculation of the mean and standard deviation, which are also suitable for incremental on-line calculation. Then he generalize these formulae to weighted means and standard deviations. He unpick the difficulties that arise when generalizing further to normalized weights. Finally he shown that the exponentially weighted moving average is a special case of the incremental normalized weighted mean formula, and derive a formula for the exponentially weighted moving standard deviation.
VOLUME WEIGHTED VOLATILITY ADAPTIVE MOVING AVERAGE & BANDS: Taking the INCREMENTAL WEIGHTED STANDARD DEVIATION already described and taking a specified anchor or Rolling procedure for a VWAP, I derive the variance against the price to use it as VOLATILITY PROXY for a normalization lambda to plot a First Order Impulse Response Filter or Adaptive Average . This idea have it's roots derived from Chaiyuth Padungsaksawasdi & Robert T. Daigler paper entitled "Volume weighted volatility: empirical evidence for a new realised volatility measure".
NOTES:
This version DO NOT INCLUDE ALERTS.
This version DO NOT INCLUDE STRATEGY: Feedback are welcome.
DERIVED WORK:
Incremental calculation of weighted mean and variance by Tony Finch (fanf2@cam.ac.uk) (dot@dotat.at), 2009.
Volume weighted volatility: empirical evidence for a new realised volatility measure by Chaiyuth Padungsaksawasdi & Robert T. Daigler, 2018.
Multi-Timeframe VWAP by TradingView user @mortdiggidi
CHEERS!
@XeL_Arjona 2019.

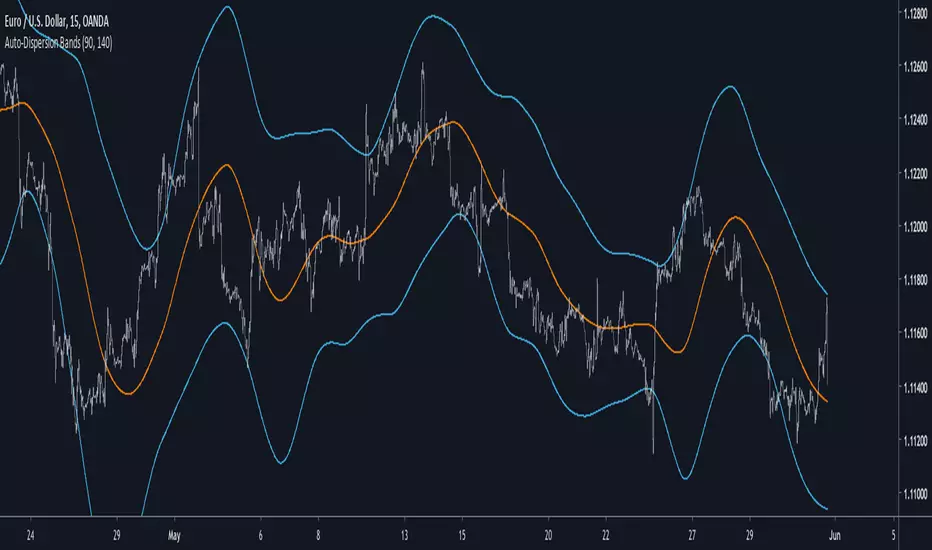
Auto-Dispersion BandsIntroduction
A really old indicator as well, thus i have no much ideas of what is going on with it, but i know that those bands returns good reversals points. The indicator don't use standard deviation, instead its a simple differencing of the price and the price length bars back who will provide a dispersion measurement, thus the name auto-dispersion.
The Indicator
The smooth parameter allow the band to cross the price, if smooth is low the chance of crosses are lower.
smooth = 3
Volume Adaptive BandsIntroduction
I have been asked by @Coppermine and @Verbena to make bands that use volume to provide adaptive results. My first approach was to use exponential averaging, in order to do so i needed to quantify volume movement using rescaling with the objective to make the bands go away from each others when there is low volume, this approach is efficient and can work on any time frame, however i decided at the end to use another method which rely on recursive weighting, cleaner but more parametric. Those bands aim to highlight great breakouts point to go with the trend.
The Indicator
length control the period of the moving averages used in the script, however low length's don't necessarily provide indications for shorter terms breakouts as shown here :
As i said the bands are close to each others when there is high volume and away when there is low volumes.
Low volume period, bands will avoid to cross price
High volume, bands will be close to generate signals.
Correction Factor
Higher time frames will lower the distance between each band, this is because volume is higher during higher time frames, remember that the indicator bands are close to each others when volume is high.
1h chart eurusd.
This is why i added a correction factor, this factor can help you control the distance between each bands, when the correction factor is greater than 1 the bands will be closer to each others, this is useful for low time frames where the average volume is lower. When the time frame is high, use values between 0 and 1 to increase distance between each bands.
Correction factor = 0.2
Conclusion
I presented a new adaptive band indicator that adapt to trading volume by using recursive weighting, volume can be replaced by other indicators but you can have results going nuts, at the end its about experimentation. I hope you will find an use to it, thanks to @Coppermine and @Verbena for the request :)
Thanks for reading !


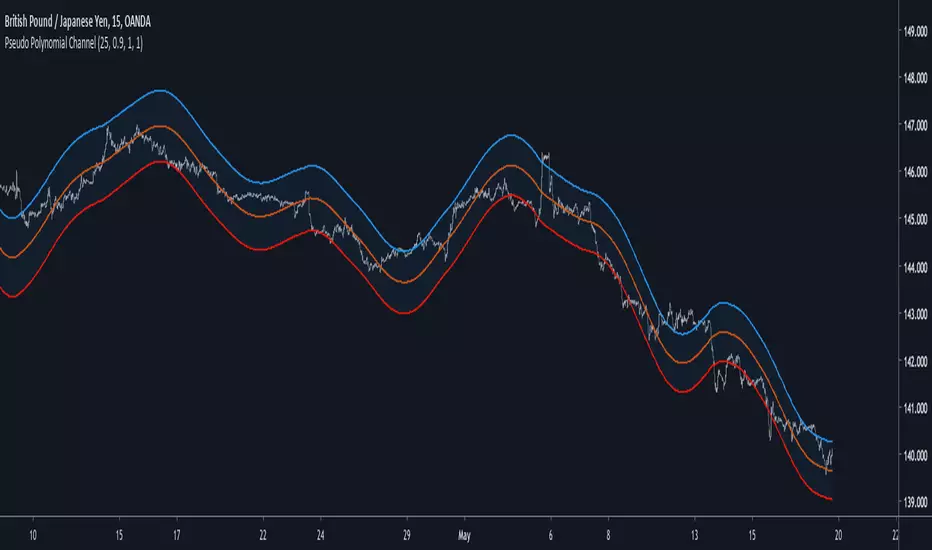
Pseudo Polynomial ChannelIntroduction
Back when i started using pine i made a script called periodic channel who aimed to rescale an average correlated sine wave to the price...don't worked very well. So i tried to fix problems induced by the indicator without much success, i had to redo it from scratch while abandoning the idea of rescaling correlated smooth functions to the price, at that time i also received requests regarding polynomial channel, some plateformes included this indicator, this led me to the idea to estimate it in order to both respond to the periodic channel problems and the requests i received, i have tried many many things and recently i tweaked a linear extrapolation to have an approximation.
Linear Extrapolation To Pseudo Polynomial Regression
I could be wrong but a polynomial regression must use constant parameters in order to provide a really smooth output, at least constant for a set of time. The moving averages forms (Savitzky-Golay moving average) who smooth polynomials across a window to the data don't have such smoothness, so how to estimate a polynomial regression while having a parameter providing control over the smoothness, a response to this is by using a recursive linear extrapolation. I posted a linear extrapolation indicator long ago, i used the same formula while adding a function to morph the output and the input in the form of :
morph * output + (1-morph) * input
How can this provide an estimate of a polynomial regression ? Well i'm not even sure myself but if you use the output as input (morph = 1) for the linear extrapolation function you should get a rough estimate of a line, this is what i thought at first and it proved to be right
Based on this observation i thought that it would be possible to get polynomial results by lowering morph, and as expected it worked well but showed a periodic pattern, this is why i smooth k in line 10.
0.9 for morph work well, higher values create sometimes smoother results but damage heavily the estimation.
Parameters
Morph have been introduced earlier, it control the amount of output and input the linear extrapolation should process, lower values create rougher but more stables results, if you see that the estimation is going nuts lower morph or change length, also lower length if you increase morph .
High overshoot, morph to 0.8 can help have a better estimation at the cost of less smoothness.
Length control the indicator smoothing, this parameter differ heavily from other filters, therefore low values can create mid/long term smoothing, it can also depend on which market instrument you are applying it, so there are no fixed optimal length.
Mult control how spread the bands are, to do so mult multiply the cumulative mean error, you can change this error measurement by anything you want like standard deviation/atr/range but take into account that you may create a separate parameter to control the error instead of length . Mult can be a float and like length can have different optimal values depending on the market the indicator is applied to.
Flatten do exactly what is name imply, it flatten the overall output to have a better estimation, can be a float. The result is less smooth.
Flatten = 2
More Exemples
BTCUSD length = 25 and mult = 4
XPDUSD length = 25 and mult = 1
ALPHABET length = 6 and morph = 0.99
Conclusion
I tried to estimate a polynomial channel by using recursion in the linear extrapolation function. This build is way more stable than the periodic channel but its still a bit inaccurate in my opinion. I hope this code can still help someone build something really nice, if so share your results :)
I apologize for those expecting a legit polynomial channel build but i really don't know how to do that, as i said parameters for the regression must be constants, i hope it still fine :)
Thanks for reading !
♒RBCI - Range Bound Channel Index by Cryptorhythms♒ RBCI - Range Bound Channel Index by Cryptorhythms
Intro
This is my best approximation of the RBCI. Its not perfect, but it does the job well enough.
A good way to use it is to enter when the singal line (light blue) RE ENTERS the channel from below. I circled these points on the indicator in green.
Description
Information to create was gathered mostly here: www.finware.com
RBCI (Range Bound Channel Index) – is calculated by means of the channel (bandwidth) filter (CF). Channel filter simultaneously fulfills two functions:
Removes low frequent trend formed by low frequent components of the spectrum with periods, more T2= 1/fc2;
Removes high frequency noise formed by the high frequent components of the spectrum with periods, less T1= 1/fc1.
👍 Enjoying this indicator or find it useful? Please give me a like and follow! I post crypto analysis, price action strategies and free indicators regularly.
💬 Questions? Comments? Want to get access to an entire suite of proven trading indicators? Come visit us on telegram and chat, or just soak up some knowledge. We make timely posts about the market, news, and strategy everyday. Our community isn't open only to subscribers - everyone is welcome to join.
For Trialers & Chat: t.me

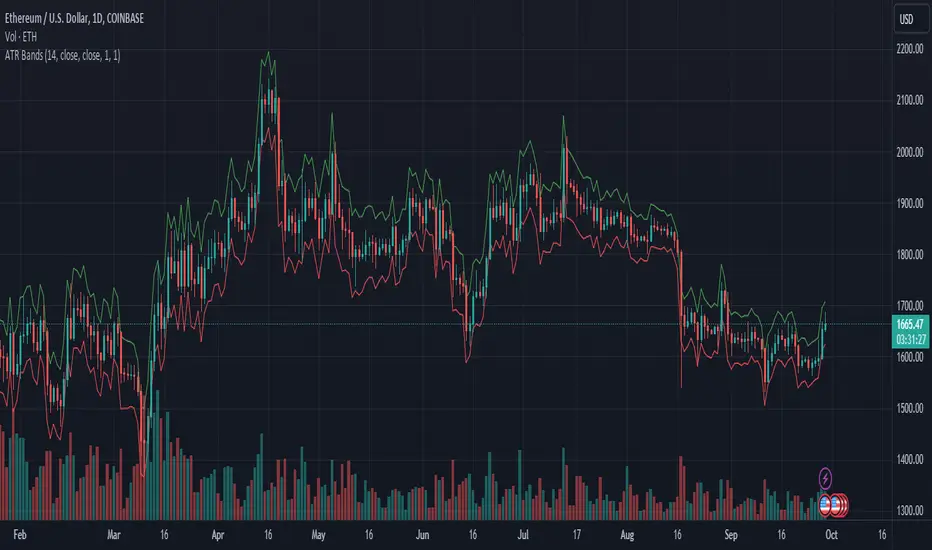
ATR BandsDisplays two bands above and below the source using the ATR. Comes with ATR multipliers for upper and lower bands.
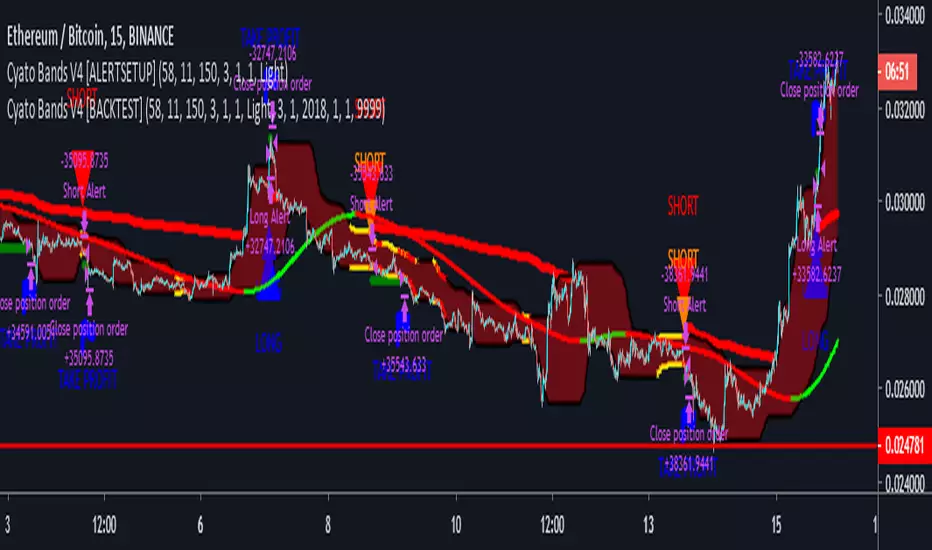
Cyatophilum Bands Pro Trader V4 [ALERTSETUP]> > PRESENTATION < <
This version includes a new feature, engineered to increase profitability.
About the backtest below:
Short + Long Strategy
0.05% Commission
10% of 10 000% equity per trade. Net Profit can be increased with a bigger % of equity.
Strategy data from 01/11/2019 to 30/04/2019
The Cyatophilum Bands, Trailing Stop Loss and Take Profit System are explained on here .
To automate the indicator, there are up to 8 different alerts that you can use:
1. LONG ENTRY
2. LONG EXIT
3. SHORT ENTRY
4. SHORT EXIT
5. TAKE PROFIT LONG
6. TAKE PROFIT SHORT
7. STOP LOSS LONG
8. STOP LOSS SHORT
The access to this indicator is included in the Cyatophilum Indicators pack available on my website .
To get a free trial, simply leave a comment, thank you very much for reading !
Previous version :
RSI Bands changer with 50 - follows trendThis is a RSI that changes the values of its bands (30-80, 20-70), according to the trend that is going on, given by the 2 classic EMA 12 and 26.
There are also the classic bands 30-70 and the middle one (for reference).
I hope you like it ;) .

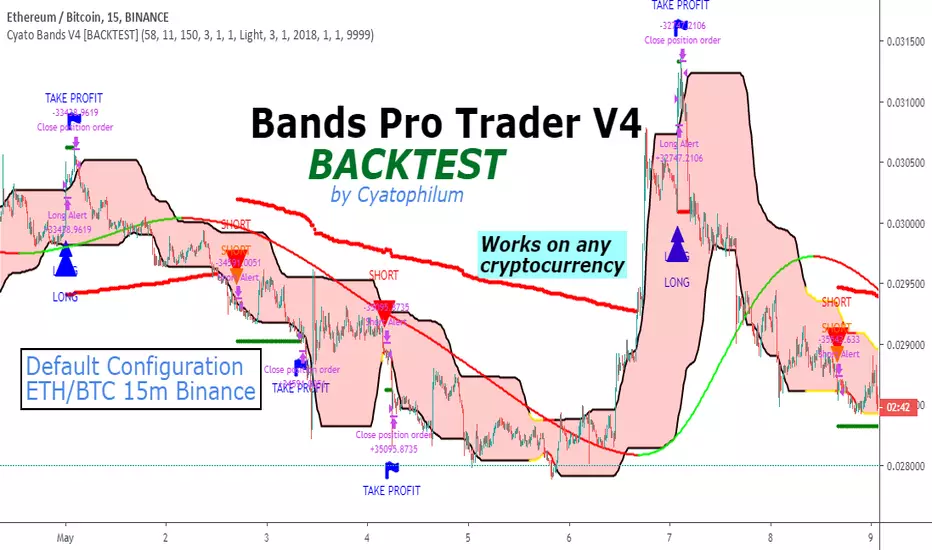
Cyatophilum Bands Pro Trader V4 [BACKTEST]This version includes a new feature, engineered to increase profitability.
About the backtest below:
Short + Long Strategy
0.05% Commission
10% of 10 000% equity per trade. Net Profit can be increased with a bigger % of equity.
Strategy data from 01/11/2019 to 30/04/2019
The Cyatophilum Bands, Trailing Stop Loss and Take Profit System are explained in the last version:
The access to this indicator and its Alert Setup version are included in the Cyatophilum Indicators pack available on my website blockchainfiesta.com
To get a free trial, leave a comment, thank you.
Flagging BandsIntroduction
A pun between the word flag and the adjective flagging (less dynamic) , this indicator have two bands who react faster when in contact to the price. Imagine you are under sheets, if you abruptly rise, the sheets will instantaneously go up, then if you abruptly get down, the sheets will fall slowly until being in contact with a surface, this is because of a type of friction called drag or air resistance , this force is described in fluid dynamics and i inspired myself from that for the creation of the indicator.
The indicator
The indicator is made of two bands, one upper band and one lower band, then a weighted average of each bands, this average is weighted depending on which band the price is closer. The length control the period of the indicator, in general higher lengths will create wider bands, you must consider that this parameter behave differently than other ones and may create slower results in comparison with other bands indicators while having the same length period.
The indicator can use a simple breakout methodology (see trailing stop part) but can sometime provide support and resistance points, in fact i believe that when the average variability/volatility of band A is higher than the average variability/volatility of band B and that the price cross band B then price will reverse its direction, this claim is not justified, research is needed.
Trailing Stop Mod
It is possible to make the indicator act as a trailing stop, in order to do so just tick the trailing stop mod box.
The average/bands will automatically disappear being replaced by the trailing stop.
Conclusion
I was just playing around when making the skeleton of the indicator, i hope the code is easy to understand, if you need some kind of explanation just pm me, i'm always open to help people/receive suggestions.
Best Regards

AG Ultimate Bollinger BandsWe believe we have really built the ultimate Bollinger Bands! There are so many options with these Bands:
- use an SMA or EMA for the Basis Moving Average
- displaying the Average Highs/Lows (blue lines) to create a Moving Band
- show breakouts of the Upper/Lower Bollinger Bands with arrows for simplicity (no more wondering whether it closed out or not!)
- show a standard deviation of Highs/Lows alongside the traditional Upper/Lower Bollinger Bands.
All options are togglable, for full flexibility and customisation.

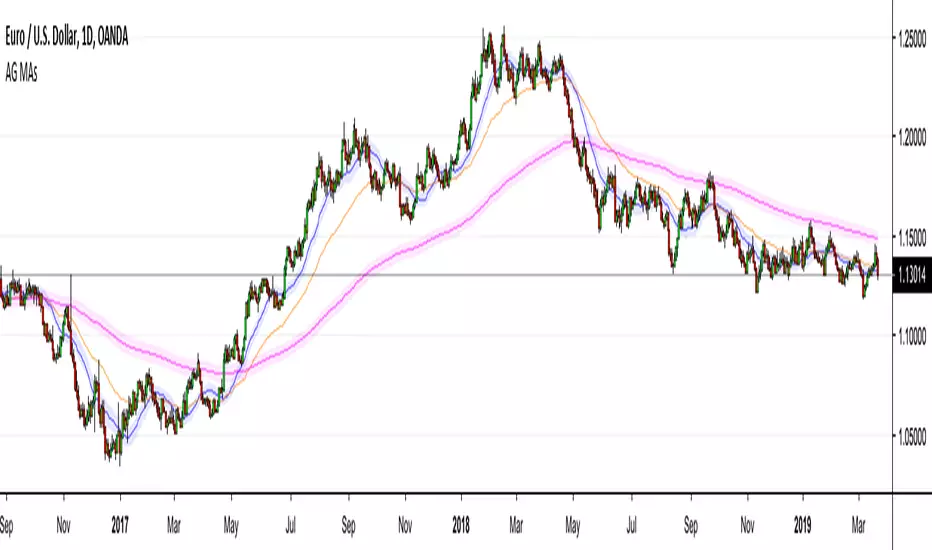
AG Moving Averages w/ BandsThis is an indicator that we built from a few simple ideas: display more than one Moving Average, display the Moving Average "Band" (more below) for each Moving Average, and allowing toggle between SMA/EMA - all in the one indicator.
The Moving Average "Band" is creating using Moving Averages (SMA/EMA) with High and Low as sources. The combination of the MA(Close), MA(High), MA(Low), creates a "Band" for each MA length - which we have found to be very helpful in our Moving Average studies.
The example in the chart above is EURUSD with 20SMA (with Bands), 55EMA (without Bands), 200EMA (with Bands). As you can see, the Bands do a better job than MAs alone for capturing price movement and acting as larger dynamic Support/Resistance zones.
Everything in this indicator is fully customizable, from which MAs to show, to those MA lengths, whether to use SMA/EMA for each individual MA, and whether to display the MA "Band" for each individual MA.
We hope you find it as useful as we have!
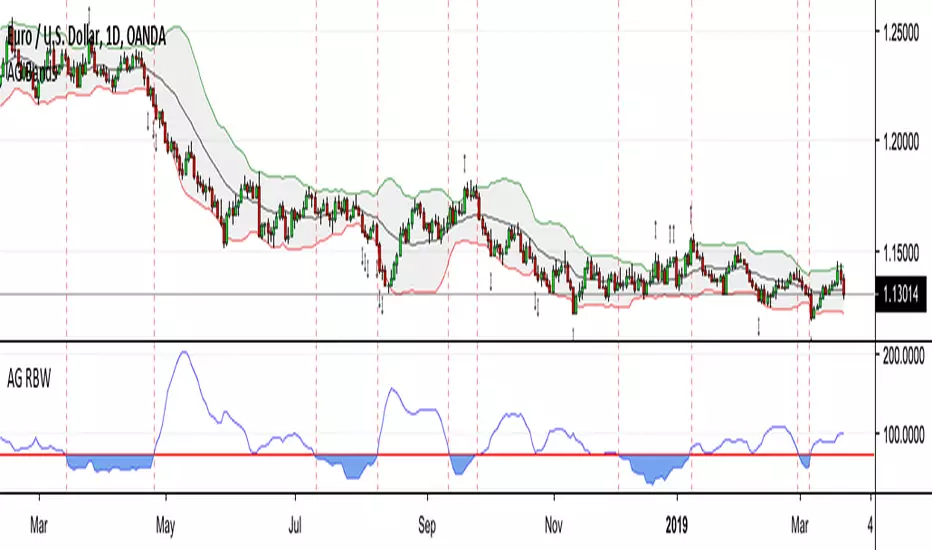
AG Relative BandWidthThis is an indicator that we've been using for a while, very useful for identifying when the market is in a low volatility state. We use the bandwidth of the Bollinger Bands as a proxy for this, but we do something different - we ask the question of "relative to what?".
Whereas typical Bollinger BandWidth indicators give values only applicable for that particular asset, the normalised nature of our Relative BandWidth indicator means that it works and be inferred the same across all assets and timeframes. A really handy tool!
"After periods of low volatility come periods of high volatility" is a well-known theory, and this indicator helps to quickly and easily identify when markets are in low volatility states. Another name for the information our indicator shows is known as the "Bollinger squeeze". Trading breakouts of this squeeze in Bands can be a profitable strategy, given one can filter the false breakouts adequately.
I have shown examples of when the indicator was showing low volatility, take note of what the price action and the width of the Bollinger Bands are doing.
Every parameter is editable, so feel free to play around with the settings. The default settings are what we have used for a long time and have worked well.