Bricklayer's Volatility MeterBricklayer's Volatility Meter will calculate Bollinger Bands Width up to 20 different lengths between lowest and highest input.
• If it is increasing, the brick will be green.
• If it is decreasing, the brick will be red.
The idea is that if volatility is decreasing across an increasing number of periods, the market will be ready for different strategies than when it is increasing.
Good luck trading!
Ampiezza bande di Bollinger (BBW)

OGT Bollinger Bandwidth IndicatorWhat is the OGT Bollinger Bandwidth Indicator?
The Bollinger Bands indicator is one of the most popular technical trading indicators. One of the applications of the Bollinger Bands indicator is when an instrument is in a state of low/high volatility. The OGT Bollinger Bandwidth Indicator measures the percentage distance between the upper and lower Bollinger bands to visually display periods of low/high volatility.
The difference between this indicator and other bandwidth indicators, is that the user can define a percentage level where if the indicator reading is above that level the instrument is considered to be in high volatility. If the indicator reading is below this level, it's considered to be low volatility. This is visually displayed on the indicator (default - Red = low volatility / Green = high volatility).
How to select the right percentage level?
This indicator has a built in black line which shows the lowest indicator reading for the past 100 bars. This gives you insight on where you should be placing your percentage level for that instrument and time frame. You will need to adjust the percentage level when you select a new time frame as the Bollinger Band levels will be different.
How this Indicator can help you trade profitably?
As the saying goes - periods of low volatility is followed by period of high volatility. The OGT Bollinger Bandwidth Indicator allows instantly see and watch for periods of low volatility and capitalise when the tide turns. This is not a direction indicator but gives you an early warning sign that a big move is coming. Using other technical indicators such as moving averages / support and resistance can help you with the direction.

Newton theory (Bollinger Band Breakout)Initial capital 1000 USD
Order size 10%
Commission 0.3% with slippage
Timeframe 4h
This is Simple Bollinger Band Trend find out strategy.
I'm using the usual trailing offset as an exit for this strategy.
using 1x leverage to go long short within 3years backtest result more then 200% for all usd pair.
in next version i will try to find out more optimize sma,std,sl,tp parameter by using freqtrade hyperparameter optimization.
Happy Trading :)

Alert// Short+long: SAR+HMA+Bollinger+support/resistanceHello, dear friends.
This script can be used for various strategies. Whether it's a scalp like now or more positional purchases. To determine the minimum and maximum, SAR ,resistance points, support points+HMA+ Bollinger channel are used. The entry occurs when the SAR intersects with the HMA , if it is above or below the support/ resistance levels.
In the settings there is a "back" how many bars to use back to search for these conditions.Also the standard setting is SAR+ multiplier.
The strategy based on these alerts is the same, but the conditions stipulate that the entry into the deal does not occur (while you are in the deal) if the purchase is more expensive than the previous one.

Bollinger Bands Width DonchianThis script was written for release to my followers in tandem with a video idea on how to use it.
The script draws a line on a lower chart to display the Bollinger Bands Width. The default bars counted for this is 20.
The script then draws and upper and lower Donchian line that moves with the highest high and lowest low of Bollinger Bands Width. The default value of this Donchian is 200. When the Bollinger Bands Width line makes a new Donchian low it highlights the bars for visual recognition.
I have also added alert functionality that can be set to alert when a new low is made.

Bollinger Bands Width DonchianThis script measures the (default 20) Bollinger Band Width and draws a line. When the Bollinger Band compresses the indicator goes down and when it expands the indicator goes up. When the Bollinger Band Width compresses and expands to the lowest or highest degree for the last number of bars (default 200) it moves the Donchian lines to indicate the lowest and highest point for that period.

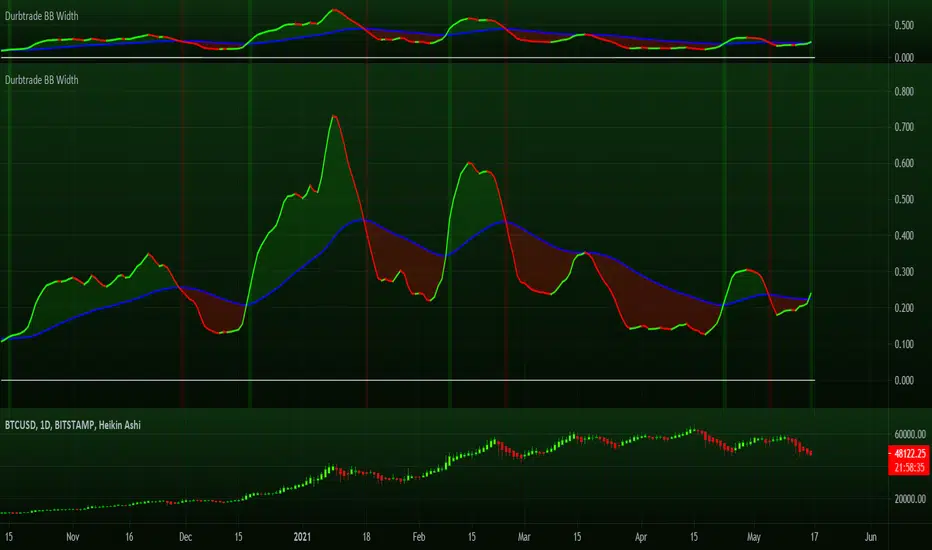
Durbtrade Bollinger Bands WidthFirst published script. Actually, this is my 1st script ever! I know its not flashy or anything, but I finally decided to try learning some pine... and to try and get rid of the dang 0 on my profile, haha. So here are the results after many hours.
I like using the BB Width indicator, and I wanted it to change color based on whether is was rising or falling. I also have it to automatically plot a horizontal line at 0 so I don't have to draw a line every time I apply the indicator to a new chart. And I changed the default precision to 3.
I noticed that there aren't that many BB Width scripts. and I don't think there is anything like this out there that I know of, so I hope someone else besides me will find it useful.
Please feel free to comment.
Modified Smoothed Heiken AshiThis code is based on Smoothed HA candle which will work on all chart types
condition for BUY:
1. When close crosses Smoothed HA
2.Close should be in side upper band
3.BBW must be greater than the average
vice versa for sell
this code takes data from HA chart so that it can be applied on all chart type.
Bollinger band and Bollinger band width conditions added for removal of unwanted signals
Alert added so that you can apply alert and check it in real time performance
thanks to The Secret Mindset You tube channel from where I got the idea to convert this into a pine script indicator
smooth HA taken from "Smoothed Heiken Ashi Candles v1" at //@jackvmk

Bollinger Bands Pro : Hawk-Eye (by ImanPJN)Bollinger Bands Pro: Hawk Eye / is a professional version of the Bollinger Band Indicator that uses two bands instead of one. This is the second band I call the upper and lower middle band.
Sometimes you see that the candles are rejected from parts of the band and you do not know the real reason.
The real reason is the middle band, which is a secret line that we show you in Hawk eye and give you a professional and complete view of the trend and momentum of the trend.
This important line gives you the dynamic support and resistance points that were previously hidden from you.
The line also allows traders to pinpoint their entry and exit points, as well as notice that trend strengths or trend momentum are being lost.
Now we want to discuss the trading methods and strategies of this indicator, three main strategies that should be considered, the first is following the trend and the second is breaking the line And third is the Bollinger Bands divergences with the "BB %B" oscillator.
1 - Following the Trend :
You can follow the trend and when a good downtrend or uptrend is formed, enter the trade every time candles hits the middle band and bounces back and you can hold the position it until the middle band or baseline is broken .
2 - Breaking the Line :
When the middle band or baseline as our dynamic trend line is broken with a complete candlestick, we can close the trade or trade the reverse trend, but we recommend that you do not use trend reversal signals if you do not have enough skills.
3 - Bollinger Bands divergences :
We can also use the Bollinger Bands and the BB Percentage Index to find bullish and bullish divergence or overbought and oversold points. But it requires more mastery and research on both indicators
Coded by Iman Pajand in Partnership with @BITEXGroup

Simple Bollinger Bands Toolkit™TradeChartist Simple Bollinger Bands Toolkit is a useful set of Bollinger Bands based utilities, which includes 0 mean %B Oscillator , price volatility based BB Width , actual Bollinger Bands and BB Breakout Signals .
===================================================================================================================
™TradeChartist Simple Bollinger Bands Toolkit Features
================================================
Modified %B Oscillator with 0 as its mean
%B Oscillator Over-Bought (typically values > 80/90/100) and Over-Sold zones (typically values < - 80/-90/-100) can be displayed by enabling Show Over-Sold/Over-Bought Zones .
Highs and Lows of the %B Oscillator are displayed to help visualize Divergences.
BB Width as Price Volatility (BB Upper Band - BB Lower Band) can be displayed to visualize BB Squeeze zones.
Actual Bollinger Bands can be plotted by enabling Display Bollinger Bands . To display on main price chart, just move the BB Toolkit to price chart and merge the scales.
Breakout Signals can be displayed by enabling Display Bollinger Bands and Show BB Breakout Signals . This also displays background fill to help visualize the zones since the breakouts of upper/lower bands happened.
The BB Basis/Mean line is colour coded based on the %B Oscillator (%B>0 - Green, %B<0 - Red).
The Toolkit uses Simple Moving Average (SMA) for the basis line.
The default length is 55 and default Standard Deviation is 1. %B Oscillator can be smoothed (default - 5) using EMA to minimize noise. (Use 20 length and 2 standard deviation for classic Bollinger Bands).
Price Bars on the Main Price chart can be coloured by enabling BB Colour Bars .
===================================================================================================================

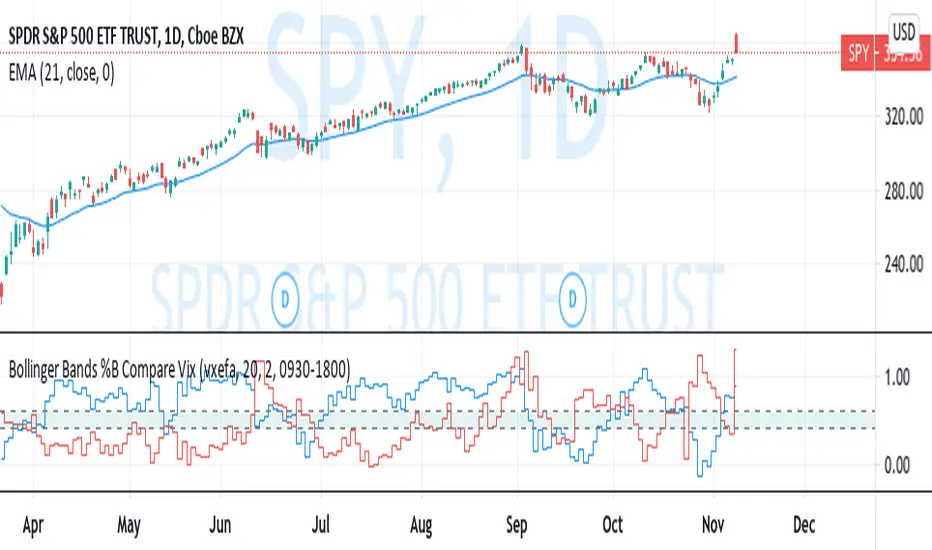
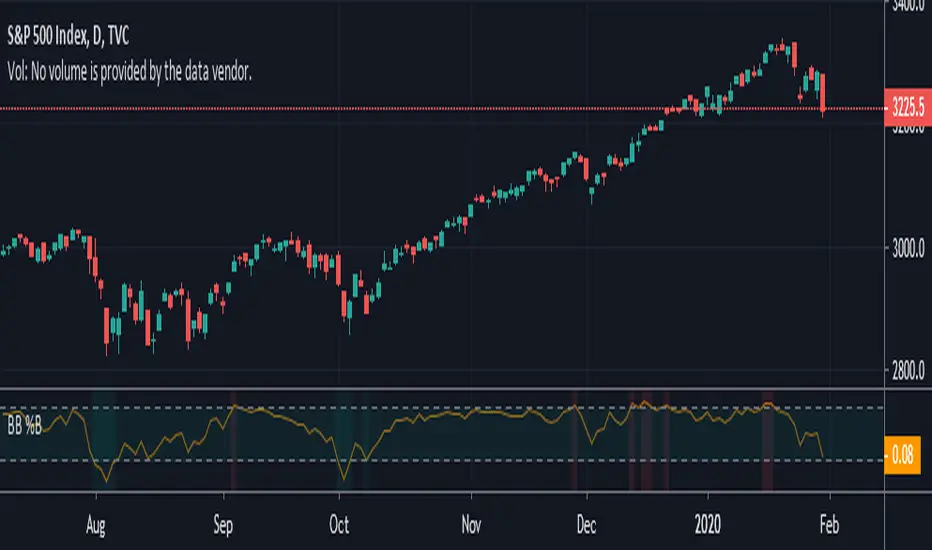
Bollinger Bands %B Compare VixThis imple script converts your chosen chart price and outputs it as a percentage in relation to the Vix percentage.
If price (Blue line) is higher than 0.60 and vix (Red Line) is lower than 0. 40 then there is lower volatility and this is good for buying.
If price (Blue line) is lower than 0. 40 and vix (Red Line) is higher than 0.60 then there is higher volatility and this is good for selling, exiting and cash only.
If you like risk you can enter as soon as the price and vix cross in either direction
This is my first script, please give me a lot of critique, I won't cry hahaha :)
For greater accuracy, you use these Vix products for their specific stocks/Indicies:
Apple - VXAPL
Google - VXGOG
Amazon - CBOE:VXAZN
IBM - CBOE:VXIBM
Goldman Sachs - CBOE:VXGS
NASDAQ 100 = CBOE:VXN
SP100 - CBOE:VXO
SP500 (3months) - VIX3M
XLE(energy sector) - CBOE:VXXLE
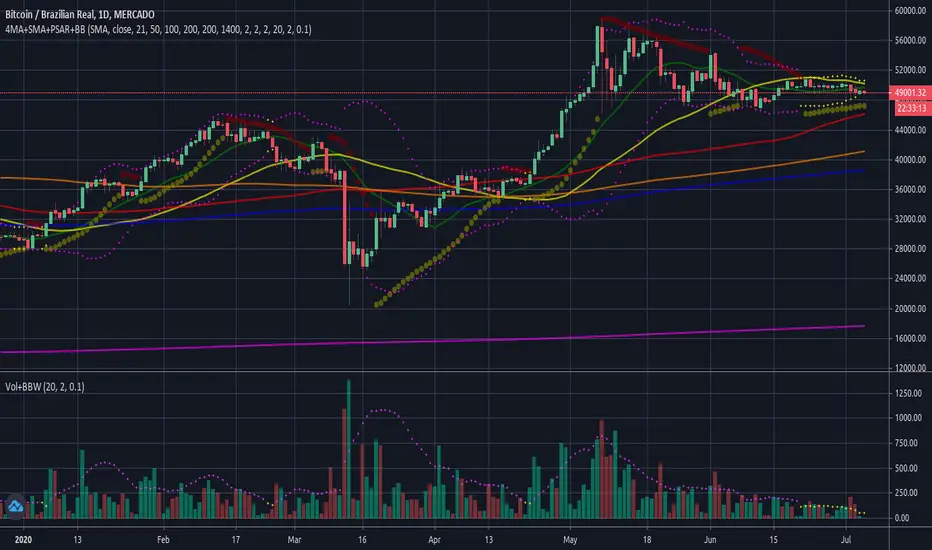
EWZ(brazil etf) - VXEWZ
EEM( emerging markets etf) - CBOE:VXEEM
EFA (MSCI ETF) - CBOE:VXEFA
FXI (Cina ETF) - CBOE:VXFXI
TradeChartist Risk Meter™𝗧𝗿𝗮𝗱𝗲𝗖𝗵𝗮𝗿𝘁𝗶𝘀𝘁 𝗥𝗶𝘀𝗸 𝗠𝗲𝘁𝗲𝗿 is a very useful and a well designed indicator, that packs a range of Risk utility tools including Trend Based Stochastic Oscillator, Bollinger Bands %B , Volatility Risk Oscillator, RSI Oscillator and RSI Risk Oscillator, along with further visual risk assessment tools like Divergence Spotter, Trend based Strength detector among other useful extras.
===================================================================================================================
™𝗧𝗿𝗮𝗱𝗲𝗖𝗵𝗮𝗿𝘁𝗶𝘀𝘁 𝗥𝗶𝘀𝗸 𝗠𝗲𝘁𝗲𝗿 𝗨𝘀𝗲𝗿 𝗠𝗮𝗻𝘂𝗮𝗹
The user can choose from one of the following four option from the 𝗥𝗶𝘀𝗸 𝗠𝗲𝘁𝗲𝗿 𝗧𝘆𝗽𝗲 dropdown from the settings.
1. Trend Based Stochastic
2. Bollinger Bands %B
3. Volatility Risk Oscillator
4. RSI + RSI Risk Oscillator
The source price for the Risk Meter can be chosen from Sᴏᴜʀᴄᴇ dropdown. Both Trend Based Stochastic and Volatility Risk Oscillator use High/Low prices as default. Enable Usᴇ Sᴏᴜʀᴄᴇ Pʀɪᴄᴇ under respective section to use a different source price.
Users can choose to plot Risk Meter background fill by enabling or disabling Rɪsᴋ Mᴇᴛᴇʀ Bᴀᴄᴋɢʀᴏᴜɴᴅ . The background fill is based on the trend intensity and uses 2 different colour schemes based on user preference. When the Dᴇᴄɪᴅᴇʀ Tʜʀᴇsʜᴏʟᴅ is used, it uses the background fill to mask the zone. If background fill is disabled, orange colour is used to mask the zone.
All of the Risk Meter plots can be plotted as Line , Histogram or Area plots and each of the sections include the Pʟᴏᴛ Sᴛʏʟᴇ option, so the user can choose a specific type of plot style for each of the Risk Meter Oscillators, based on user preference.
===================================================================================================================
═══ 𝟭. 𝗧𝗿𝗲𝗻𝗱 𝗕𝗮𝘀𝗲𝗱 𝗦𝘁𝗼𝗰𝗵𝗮𝘀𝘁𝗶𝗰 ═══
Trend Based Stochastic Oscillator is a modified version of the classic Stochastic Oscillator with the difference being the limits and also the plot itself to an extent.
--> Trend based Stochastic is a single plot oscillates between -100 to +100 and occasionally breaches these limits and can signal extremely overbought or oversold conditions unlike classic Stochastic indicator, which has two plots and strictly oscillates between 0-100.
--> Trend based Stochastic is extremely sensitive to price action, making it possible to detect every single divergence, both regular and hidden, even with the default smoothing factor of 5
--> Risk Meter employs Dᴇᴄɪᴅᴇʀ Tʜʀᴇsʜᴏʟᴅ to let user choose the threshold limit and only from this point onwards, Risk Meter detects the divergences. This helps filter a lot of noise in addition to Price and Oscillator Pivot detection under 𝗗𝗶𝘃𝗲𝗿𝗴𝗲𝗻𝗰𝗲𝘀 section.
The user has to choose the length for the Trend based Stochastic plot by entering number of bars in Lᴏᴏᴋʙᴀᴄᴋ Lᴇɴɢᴛʜ input box (Default value is 55). The user can also change the smoothing factor from default value of 5 by entering the value in Sᴍᴏᴏᴛʜɪɴɢ input box. Smoothing is particularly useful to detect the strength, based on the trend if 𝐂𝐨𝐥𝐨𝐫 𝐙𝐨𝐧𝐞𝐬 𝐛𝐚𝐬𝐞𝐝 𝐨𝐧 𝐒𝐭𝐫𝐞𝐧𝐠𝐭𝐡 is enabled and the required trend length is entered in Tʀᴇɴᴅ Sᴛʀᴇɴɢᴛʜ Dᴇᴛᴇᴄᴛɪᴏɴ Lᴇɴɢᴛʜ . This feature splits the Risk Meter Plot into Bull and Bear zones based on the trend strength. HIgher Smoothing with default trend strength detection of 5 (upto 10) works well for sensitive price hugging scalps/swings. For longer trends, higher detection lengths can be used.
===================================================================================================================
════ 𝟮. 𝗕𝗼𝗹𝗹𝗶𝗻𝗴𝗲𝗿 𝗕𝗮𝗻𝗱𝘀 %𝗕 ═════
Bollinger Bands %B in Risk Meter oscillates between -100 to +100 rather than 0 - 1 in the classic version, with oversold/overbought levels breaching the limits and the plot is exactly the same otherwise.
Risk Meter employs Dᴇᴄɪᴅᴇʀ Tʜʀᴇsʜᴏʟᴅ for Bollinger Bands %B to let the user choose the threshold limit and only from this point onwards, Risk Meter detects the divergences. This helps filter a lot of noise in addition to Price and Oscillator Pivot detection under 𝗗𝗶𝘃𝗲𝗿𝗴𝗲𝗻𝗰𝗲𝘀 section.
The user has to choose the Simple Moving Average (SMA) length for the plot by entering number of bars in BB SMA Lᴇɴɢᴛʜ input box (Default value is 20). There is no need for Standard Deviation as the fundamental plot is exactly the same, given that the plot oscillates between -100 to +100. The user can also change the smoothing factor from default value of 5 by entering the value in Sᴍᴏᴏᴛʜɪɴɢ input box. Smoothing is particularly useful to detect the strength, based on the trend if 𝐂𝐨𝐥𝐨𝐫 𝐙𝐨𝐧𝐞𝐬 𝐛𝐚𝐬𝐞𝐝 𝐨𝐧 𝐒𝐭𝐫𝐞𝐧𝐠𝐭𝐡 is enabled and the required trend length is entered in Tʀᴇɴᴅ Sᴛʀᴇɴɢᴛʜ Dᴇᴛᴇᴄᴛɪᴏɴ Lᴇɴɢᴛʜ . This feature splits the Risk Meter Plot into Bull and Bear zones based on the trend strength. HIgher Smoothing with default trend strength detection of 5 (upto 10) works well for sensitive price hugging scalps/swings. For longer trends, higher detection lengths can be used.
===================================================================================================================
══════ 𝟯. 𝗩𝗼𝗹𝗮𝘁𝗶𝗹𝗶𝘁𝘆 𝗥𝗶𝘀𝗸 ═══════
Volatility Risk Oscillator is an original ™TradeChartist model designed to visually see the Volatility risk for the security on any time frame.
To plot Volatility Risk for the security, the user has to enter the number of bars to detect volatility risk in Lᴏᴏᴋʙᴀᴄᴋ Lᴇɴɢᴛʜ input box (Default Value is 55). The user can also change the smoothing factor from default value of 5 by entering the value in Sᴍᴏᴏᴛʜɪɴɢ input box. Smoothing is particularly useful to detect the strength based on trend if 𝐂𝐨𝐥𝐨𝐫 𝐙𝐨𝐧𝐞𝐬 𝐛𝐚𝐬𝐞𝐝 𝐨𝐧 𝐒𝐭𝐫𝐞𝐧𝐠𝐭𝐡 is enabled and required trend length is entered in Tʀᴇɴᴅ Sᴛʀᴇɴɢᴛʜ Dᴇᴛᴇᴄᴛɪᴏɴ Lᴇɴɢᴛʜ . This feature splits the Risk Meter Plot into Bull and Bear zones based on the trend strength. HIgher Smoothing with default trend strength detection of 5 (upto 10) works well for sensitive price hugging scalps/swings. For longer trends, higher detection lengths can be used.
Even though Divergences work on Volatility Risk Oscillator, it is not employed as it produces far too many and there is no set Threshold limit that can be set to filter the divergences.
===================================================================================================================
══════ 𝟰. 𝗥𝗦𝗜 𝗢𝘀𝗰𝗶𝗹𝗹𝗮𝘁𝗼𝗿 ═══════
There are two different types of RSI Oscillators in this section that can be plotted.
RSI Oscillator - Classic RSI modified to fit -100 to +100 scale rather than 0 - 100 scale. Risk Meter employs Dᴇᴄɪᴅᴇʀ Tʜʀᴇsʜᴏʟᴅ for RSI Oscillator also, to let the user choose the threshold limit and only from this point onwards, Risk Meter detects the divergences. This helps filter a lot of noise in addition to Price and Oscillator Pivot detection under 𝗗𝗶𝘃𝗲𝗿𝗴𝗲𝗻𝗰𝗲𝘀 section.
RSI Risk Oscillator - This oscillator plots the potential RSI risk based on RSI length (which can be changed in RSI Lᴇɴɢᴛʜ input box and main source price ( Sᴏᴜʀᴄᴇ ). The user can also change the smoothing factor from default value of 5 by entering the value in Sᴍᴏᴏᴛʜɪɴɢ input box. Smoothing is particularly useful to detect the strength, based on the trend if 𝐂𝐨𝐥𝐨𝐫 𝐙𝐨𝐧𝐞𝐬 𝐛𝐚𝐬𝐞𝐝 𝐨𝐧 𝐒𝐭𝐫𝐞𝐧𝐠𝐭𝐡 is enabled and the required trend length is entered in Tʀᴇɴᴅ Sᴛʀᴇɴɢᴛʜ Dᴇᴛᴇᴄᴛɪᴏɴ Lᴇɴɢᴛʜ . This feature splits the Risk Meter Plot into Bull and Bear zones based on the trend strength. Higher Smoothing with default trend strength detection of 5 (upto 10) works well for sensitive price hugging scalps/swings. For longer trends, higher detection lengths can be used.
To plot RSI Risk Oscillator, 𝐒𝐡𝐨𝐰 𝐑𝐒𝐈 𝐑𝐢𝐬𝐤 𝐎𝐬𝐜𝐢𝐥𝐥𝐚𝐭𝐨𝐫 must be enabled. Disabling this option plots normal RSI Oscillator.
The 4hr chart of BTC-USDT below shows use of RSI Risk Oscillator (Top) with RSI Oscillator (bottom).
===================================================================================================================
╔═══════ 𝗗𝗶𝘃𝗲𝗿𝗴𝗲𝗻𝗰𝗲𝘀 ═══════╗
Risk Meter detects both Regular and Hidden Bullish and Bearish Divergences at every occurence. This can be filtered by the use of Dᴇᴄɪᴅᴇʀ Tʜʀᴇsʜᴏʟᴅ in above sections. To plot divergences, enable
𝗗𝗶𝘃𝗲𝗿𝗴𝗲𝗻𝗰𝗲𝘀, Sʜᴏᴡ Rᴇɢᴜʟᴀʀ Dɪᴠᴇʀɢᴇɴᴄᴇs and Sʜᴏᴡ Hɪᴅᴅᴇɴ Dɪᴠᴇʀɢᴇɴᴄᴇs . All divergences are enabled as default.
Users can further filter Divergences by entering the number of bars to the right in Rɪɢʜᴛ ʙᴀʀs ғᴏʀ Pɪᴠᴏᴛ Cᴏɴғɪʀᴍᴀᴛɪᴏɴ input box to confirm the Price Pivot (for Regular divergences) and Oscillator Pivot (for Hidden Divergences).
The example chart of 4hr BTC-USDT chart shows the Divergences filtered by use of RSI Threshold. It is important to note that the trend intensity colour on the plot and bars (if bar colour option is enabled) will help detect if the Divergence would hold.
===================================================================================================================
╔═══════ 𝗨𝘀𝗲𝗳𝘂𝗹 𝗘𝘅𝘁𝗿𝗮𝘀 ═══════╗
Risk Meter offer two vibrant Colour Themes, namely Chilli and Flame , which can be opted from Rɪsᴋ Mᴇᴛᴇʀ Tʜᴇᴍᴇ dropdown. These themes also offer the option to plot the trend intensity on the price bars as bar colours by enabling Rɪsᴋ Mᴇᴛᴇʀ Cᴏʟᴏᴜʀ Bᴀʀs . Bar colors can also be inverted using Iɴᴠᴇʀᴛ Bᴀʀ Cᴏʟᴏᴜʀ option.
Users can also choose to use the Simple theme and choose preferred colours from Sɪᴍᴘʟᴇ Tʜᴇᴍᴇ ʙᴜʟʟ Cᴏʟᴏᴜʀ and Sɪᴍᴘʟᴇ Tʜᴇᴍᴇ ʙᴇᴀʀ Cᴏʟᴏᴜʀ colour input.
Note: The indicator does not repaint and can be confidently used for alerts and trade entries without worrying about plots disappearing after bar close.
===================================================================================================================
Example Charts
1. 89 period Trend Based Stochastic Oscillator as Histogram plot on LINK-USDT 1hr chart with Chilli Theme.
2. 89 period Volatility Risk Oscillator as Histogram plot on SPX 1hr chart with Chilli Theme.
3. 14 period RSI Risk Oscillator as Area plot on AAPL Daily Chart with Flame Theme.
4. 100 period Volatility Risk Oscillator using Trend Strength plotted as Zones on 1hr EUR-USD chart with Chilli Theme.
===================================================================================================================
Best Practice: Test with different settings first using Paper Trades before trading with real money
===================================================================================================================
This is not a free to use indicator. Get in touch with me (PM me directly if you would like trial access to test the indicator)
Premium Scripts - Trial access and Information
Trial access offered on all Premium scripts.
PM me directly to request trial access to the scripts or for more information.
===================================================================================================================

[blackcat] L2 Center Band BollingerLevel: 2
Background
Bollinger bands are a type of price envelope developed by John Bollinger , where price envelopes define upper and lower price ranges. Bollinger Bands are envelopes that are represented with a standard deviation above and below a simple moving average of price. Because the spacing of the bands is based on the standard deviation, they adjust for fluctuations in the volatility of the underlying price.
Function
L2 Center Band Bollinger takes advantage of Bollinger band to detect sideways and trends. At the same time, I made an improvement and the center Bollinger line as a fast-slow-line color band. The algorithm of the color center band is composed of price and volume information, which produces gold cross and dead cross for short term long and short entries.
Key Signal
aa10 --> bollinger middle fast line
aa12 --> bollinger middle slow line
up --> upper envelope
dn --> lower envelope
Pros and Cons
Pros:
1. it can easy see the sections of trends or sideways by width of Bollinger band
2. long and short entries are disclosed
Cons:
1. Some noise is still incorporated in trends
2. due to this is un-optimized version, time frame and trading pairs need to be selected
3. Bollinger re-entry signal is not disclosed yet
Remarks
The long and short signal is compatible to @nilux strategy backtest framework for sandardized backtest scheme: Backtest
Readme
In real life, I am a prolific inventor. I have successfully applied for more than 60 international and regional patents in the past 12 years. But in the past two years or so, I have tried to transfer my creativity to the development of trading strategies. Tradingview is the ideal platform for me. I am selecting and contributing some of the hundreds of scripts to publish in Tradingview community. Welcome everyone to interact with me to discuss these interesting pine scripts.
The scripts posted are categorized into 5 levels according to my efforts or manhours put into these works.
Level 1 : interesting script snippets or distinctive improvement from classic indicators or strategy. Level 1 scripts can usually appear in more complex indicators as a function module or element.
Level 2 : composite indicator/strategy. By selecting or combining several independent or dependent functions or sub indicators in proper way, the composite script exhibits a resonance phenomenon which can filter out noise or fake trading signal to enhance trading confidence level.
Level 3 : comprehensive indicator/strategy. They are simple trading systems based on my strategies. They are commonly containing several or all of entry signal, close signal, stop loss, take profit, re-entry, risk management, and position sizing techniques. Even some interesting fundamental and mass psychological aspects are incorporated.
Level 4 : script snippets or functions that do not disclose source code. Interesting element that can reveal market laws and work as raw material for indicators and strategies. If you find Level 1~2 scripts are helpful, Level 4 is a private version that took me far more efforts to develop.
Level 5 : indicator/strategy that do not disclose source code. private version of Level 3 script with my accumulated script processing skills or a large number of custom functions. I had a private function library built in past two years. Level 5 scripts use many of them to achieve private trading strategy.

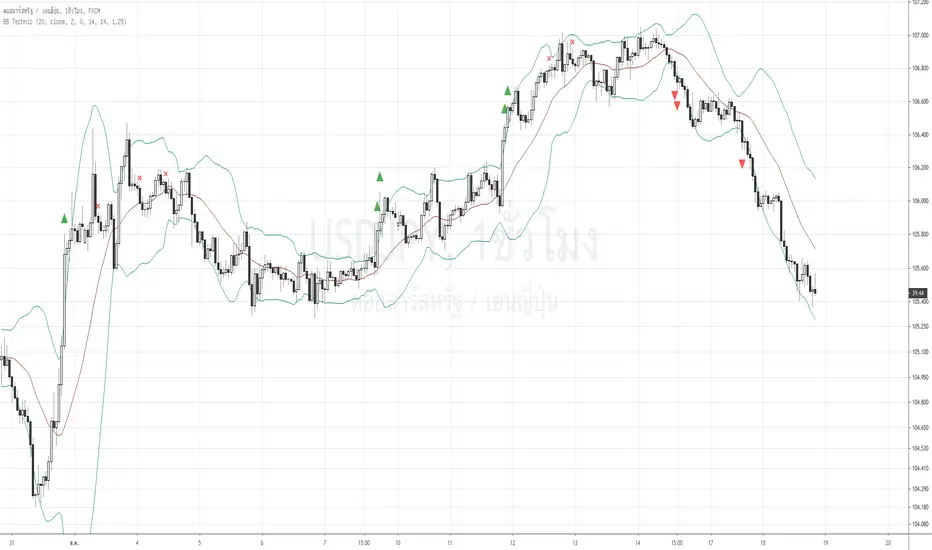
Bollinger Bands Technic + AlertReferred to the book "Bollinger on Bollinger Bands"
The best use of BB is to wait for squezze and breakout to capture the start of the trend.
Here the signal and target profit.
1. Long Signal when the close crosses above the upper BB and the Bandwidth of current bar exceeds 1.25 times of the previous bar (Volatility expands). : Green Triangle Up
2. Short Signal when the close crosses down the lower BB and the the Bandwidth of current bar exceeds 1.25 times of the previous bar (Volatility expands). : Red Triangle Down
3, Long TP when the upper BB turns down. : X cross Red
4. Short TP when the lower BB turns up. : X cross Purple
You can adjust any input of BB as well as how many times bandwidth changes from previous period.
I filter out the to high to buy signal by using ADX, if ADX over 50, the buy signal will be omitted.
As well as the TP signal , If the ADX is to low <35 , meaning it's has more room to go. the TP signal to be omitted.
Anyway , user can adjust all of this sensitivity.
As this is the trend following indicator, you will experience the bad signal during the sideways. That's life.
This is the semi discretionary system. You can use as a guideline along side with your other methods and money management.
Thank you!
Tanakorn Koomrampai CMT, CFTe
Colored Directional Movement and Bollinger Band's Cloud by DGTThis study combines Bollinger Bands, one of the most popular technical analysis indicators on the market, and Directional Movement (DMI), which is another quite valuable technical analysis indicator.
Bollinger Bands used in conjunction with Directional Movement (DMI) may help getting a better understanding of the ever changing landscape of the market and perform more advanced technical analysis
Here are details of the concept applied
1- Plots Bollinger Band’s (BB) Cloud colored based on Bollinger Band Width (BBW) Indicator’s value
Definition
Bollinger Bands (created by John Bollinger ) are a way to measure volatility . As volatility increases, the wider the bands become and similarly as volatility decreases, the gap between bands narrows
Bollinger Bands, in widely used approach, consist of a band of three lines. Likewise common usage In this study a band of five lines is implemented
The line in the middle is a Simple Moving Average (SMA) set to a period of 20 bars (the most popular usage). The SMA then serves as a base for the Upper and Lower Bands. The Upper and Lower Bands are used as a way to measure volatility by observing the relationship between the Bands and price. the Upper and Lower Bands in this study are set to two and three standard deviations (widely used form is only two standard deviations) away from the SMA (The Middle Line), hence there are two Upper Bands and two Lower Bands. The background between two Upper Bands is filled with a green color and the background between two Lower Bands is filled with a red color. In this we have obtained Bollinger Band’s (BB) Clouds (Upper Cloud and Lower Cloud)
Additionally the intensity of the color of the background is calculated with Bollinger Bands Width ( BBW ), which is a technical analysis indicator derived from the standard Bollinger Bands indicator. Bollinger Bands Width, quantitatively measures the width between the Upper and Lower Bands. In this study the intensity of the color of the background is increased if BBW value is greater than %25
What to look for
Price Actions : Prices are almost always within the bands especially at this study the bands of three standard deviations away from the SMA. Price touching or breaking the BB Clouds could be considered as buying or selling opportunity. However this is not always the case, there are exceptions such as Walking the Bands. “Walking the Bands” can occur in either a strong uptrend or a strong downtrend. During a strong trend, there may be repeated instances of price touching or breaking through the BB Clouds. Each time that this occurs, it is not a signal, it is a result of the overall strength of the move. In this study in order to get a better understanding of the trend and add ability to perform some advanced technical analysis Directional Movement Indicator (DMI) is added to be used in conjunction with Bollinger Bands.
Cycling Between Expansion and Contraction : One of the most well-known theories in regards to Bollinger Bands is that volatility typically fluctuates between periods of expansion (Bands Widening : surge in volatility and price breaks through the BB Cloud) and contraction (Bands Narrowing : low volatility and price is moving relatively sideways). Using Bollinger Bands in conjunction with Bollinger Bands Width may help identifying beginning of a new directional trend which can result in some nice buying or selling signals. Of course the trader should always use caution
2- Plots Colored Directional Movement Line
Definition
Directional Movement (DMI) (created by J. Welles Wilder ) is actually a collection of three separate indicators combined into one. Directional Movement consists of the Average Directional Index (ADX) , Plus Directional Indicator (+D I) and Minus Directional Indicator (-D I) . ADX's purposes is to define whether or not there is a trend present. It does not take direction into account at all. The other two indicators (+DI and -DI) are used to compliment the ADX. They serve the purpose of determining trend direction. By combining all three, a technical analyst has a way of determining and measuring a trend's strength as well as its direction.
This study combines all three lines in a single colored shapes series plotted on the top of the price chart indicating the trend strength with different colors and its direction with triangle up and down shapes.
What to look for
Trend Strength : Analyzing trend strength is the most basic use for the DMI. Wilder believed that a DMI reading above 25 indicated a strong trend, while a reading below 20 indicated a weak or non-existent trend
Crosses : DI Crossovers are the significant trading signal generated by the DMI
With this study
A Strong Trend is assumed when ADX >= 25
Bullish Trend is defined as (+D I > -DI ) and (ADX >= 25), which is plotted as green triangle up shape on top of the price chart
Bearish Trend is defined as (+D I < -DI ) and (ADX >= 25), which is plotted as red triangle down shape on top of the price chart
Week Trend is assumed when 17< ADX < 25, which is plotted as black triangles up or down shape, depending on +DI-DI values, on top of the price chart
Non-Existent Trend is assumed when ADX < 17, which is plotted as yellow triangles up or down shape, depending on +DI-DI values, on top of the price chart
Additionally intensity of the colors used in all cases above are defined by comparing ADX’s current value with its previous value
Summary of the Study:
Even more simplified and visually enhanced DMI drawing comparing to its classical usage (may require a bit practice to get used to it)
As said previously, to get a better understanding of the trend and add ability to perform some advanced technical analysis Directional Movement Indicator (DMI) is used in conjunction with Bollinger Bands.
PS: Analysis and tests are performed with high volatile Cryptocurrency Market
Source of References : definitions provided herein are gathered from TradingView’s knowledgebase/library
Disclaimer: The script is for informational and educational purposes only. Use of the script does not constitutes professional and/or financial advice. You alone the sole responsibility of evaluating the script output and risks associated with the use of the script. In exchange for using the script, you agree not to hold dgtrd tradingview user liable for any possible claim for damages arising from any decision you make based on use of the script

Bollinger Bands %B with HighlightsThis script highlights the indicator background when the Bollinger Bands are breached making it easier to spot them.
Good for strategies that rely on Bollinger Band breaches
Note: Clean version
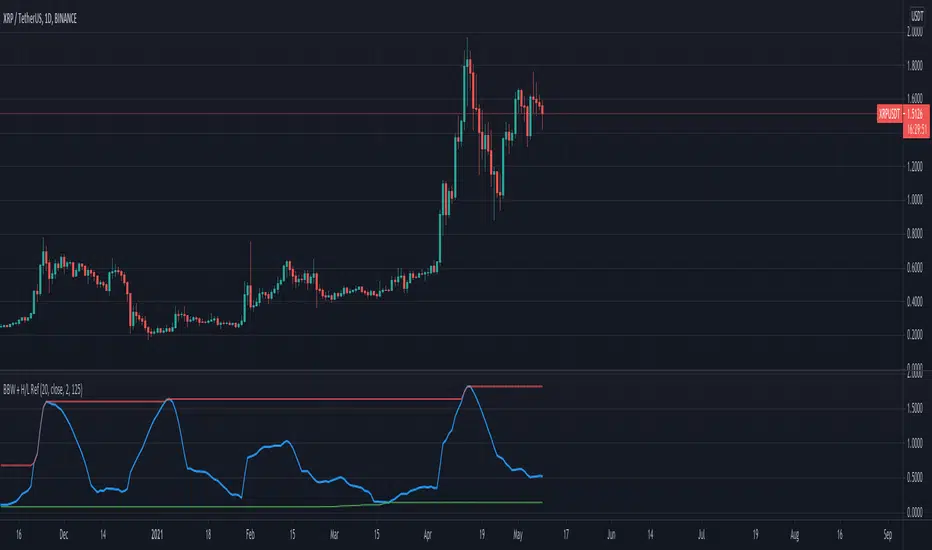
Bollinger BandWidth With High/Low ReferencesThis indicator ads option to compare BandWidth accross time. John Bollinger says he uses 125 period.
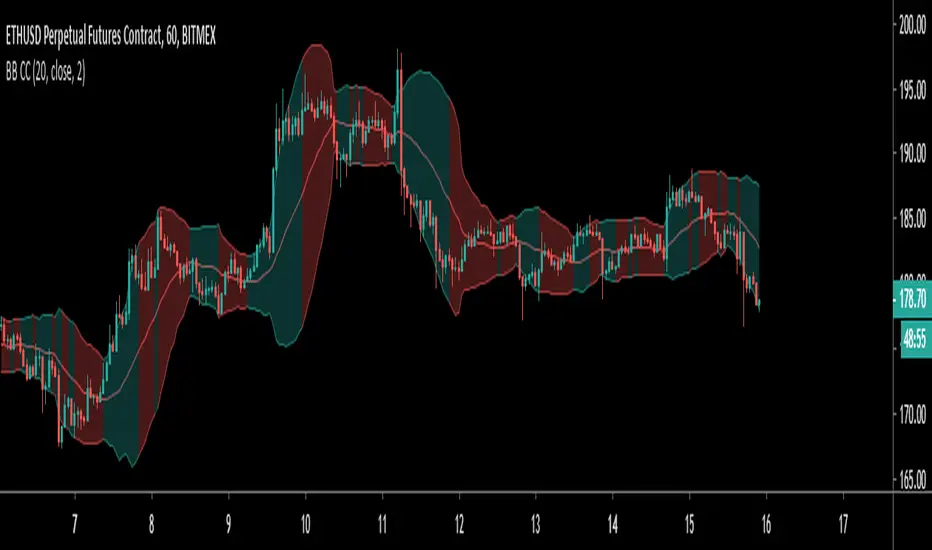
Colour Coded Bollinger BandsBollinger Bands coloured to more clearly show periods of contraction and expansion. Green filled bands indicate expansion/increasing bandwidth, and red fill indicates contraction/decreasing bandwidth.


IO_BB_WidthJohn Bollinger's academic version of Bollinger Bands width
Added some customizations around background colors.
If background color is colored, then the market is trending.

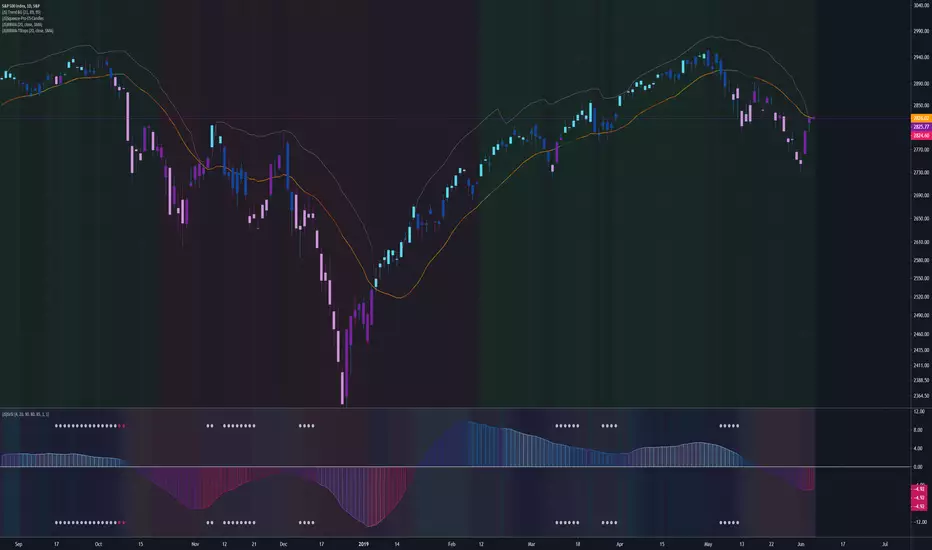
(JS) Bollinger Band Momentum Average Trailing StopsA tool I made to use alongside the Bollinger Band Momentum Average - fairly simple to use. It has the same settings as the BBMA so you can match them together.
If you prefer a wider stop than a close on the opposing side of the BBMA, this is for you.
The "stop" is triggered by a close on the other side of the stop line line turns red whenever the stop is triggered.
The calculation is simple:
The stop on the short side it is High - BBMA over the length of time you select to use (20 is default).
On the long side, it is BBMA - Low also over the preferred length of time you select to use.
Note: Just shorten the length to make a tighter stop.