TEC_MapHack_Sub2_Indicator_ver_2.0.0본 지표는 CCI를 조금더 보기 좋게 개편함으로 과매수구간과 과매도구간을 쉽게 알아볼 수 있는 CCI입니다.
배경이 주황색이면 과매수구간을 나타내고, 배경이 하늘색이면 과매도구간을 나타냅니다.
This indicator is a CCI that can easily identify overbought and oversold sections by reorganizing the CCI a little more visually.
An orange background indicates an overbought section, a sky blue background indicates an oversold section.
Indice Commodity Channel (CCI)

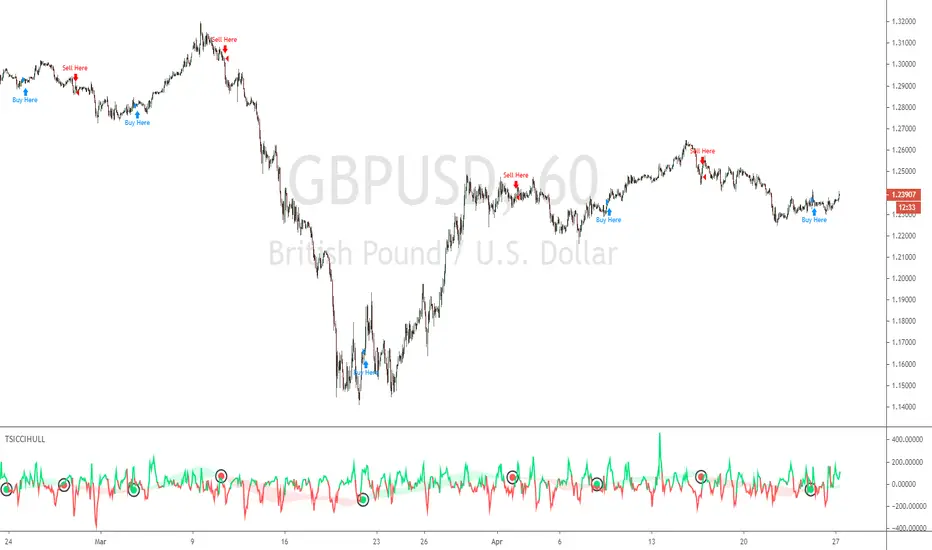
TSI CCI Hull with profit$$$$ , Alert versionThis is a modified version of @SeaSide420 TSI CCI Hull with profits exit on long and short order with alert as well
original script :
the strategy script:
/// feel free to edit/improve and comment

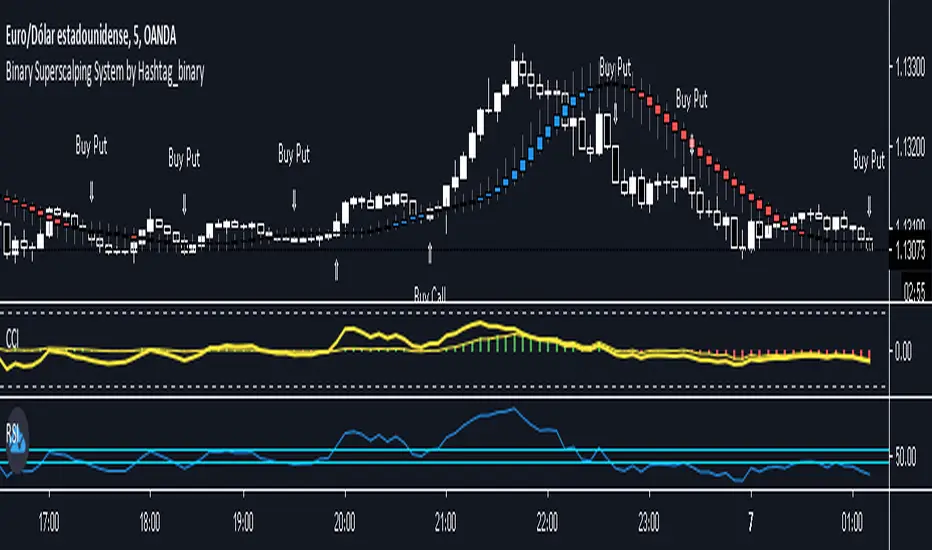
Binary Superscalping System by Hashtag_binaryBinary Superscalping Systyemis a trend momentum strategy designed for scalping and trading with binary options. This trading system is very accurate with the 80% profitable trades.
- Markets: Forex (EUR/USD, GBP/USD, AUD/USD, USD/CHF, USD/CAD, NZF/USD, USD/JPY,) Indicies (S&P500, Dow Jones, DAX, FTSE100) and Gold.
- Time Frame 5 min, 15min, 30min.
- Expiry Time (4-6 candles).
Buy Call or Buy:
- Trend CCI (170) crossed the zero line upwards (green bar >0);
- Entry CCI (34) crosses upward the zero line ;
- RSI (Relative Strength Index) indicator value is greater than 55 level;
- Heiken Ashi Smoothed indicator is color blue (optional).
Buy Put or Sell
- Trend CCI (170) crossed the zero line downwards (red bar <0);
- Entry CCI (34) crosses downward the zero line ;
- RSI indicator value is lower than 45 level;
- Heiken Ashi Smoothed indicator is color red (optiona).
Exit position for Scalping options:
- Entry CCI (34) crosses in opposite direction trend CCI (170),
- Profit Target:5 min time frame 7-10 pips, 15 min time frame (9-14 pips), 30 min time frame (15- 18 pips).
- Make Profit at fibopivot levels.
- Initial stop loss on the previous swing.

TSI CCI Hull with profit$$$This is a modified version of @SeaSide420 TSI CCI Hull with profits exit on long and short order
ORIGINAL SCRIPT:
/// /// feel free to edit/improve and comment

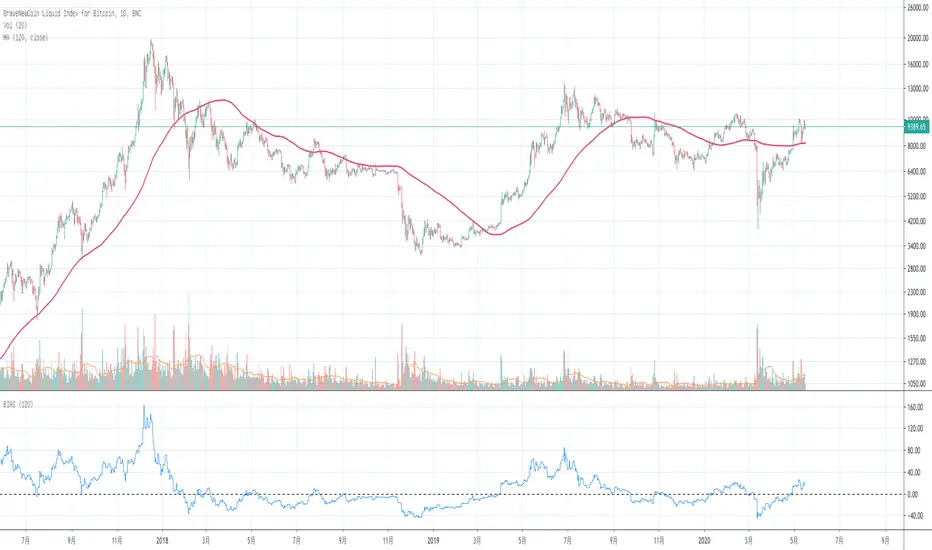
Basic BIASBasic BIAS
Deviation rate (bias), also known as deviation rate, or y-value for short, is an indicator to reflect the deviation degree between the price and MA in a certain period of time by calculating the percentage difference between the market index or closing price and a moving average, so as to obtain the possibility that the price will reverse or rebound due to deviation from moving average trend in case of severe fluctuation, and that the price will move within the normal fluctuation range Form the credibility of continuing the original potential.
The deviation rate is a percentage of the deviation degree (gap rate) between the price and ma.
The departure rate curve (bias) is a curve that connects the values of each bias into a line and obtains a wave extension curve with the value of 0 as the horizontal axis.
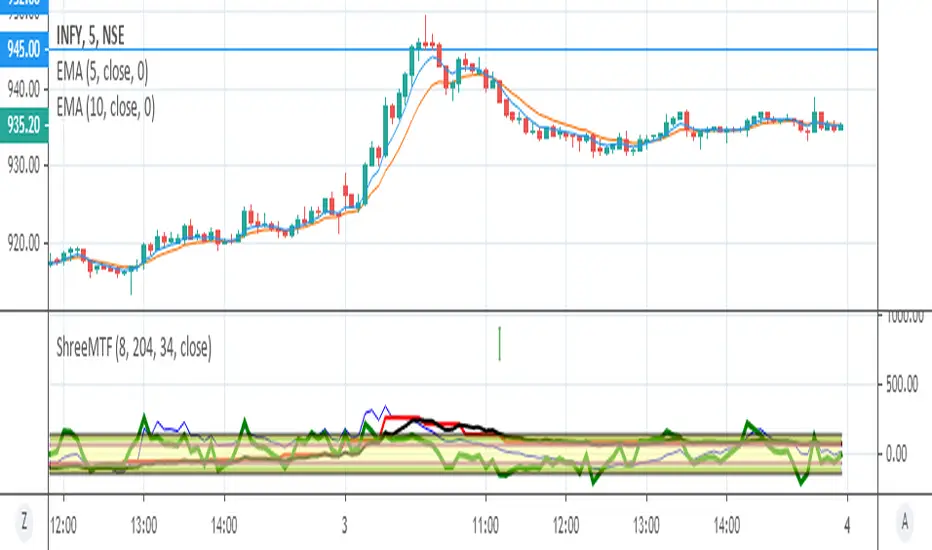
ShreeMTFShree MTF:
CCI8(5 Min)
CCI34(5 Min)
CCI34(30 Min), These 3 variants are plotted along with horizontal lines for CCI8(5 Min) with upper range of -135 and lower range of +135 & CCI34(30Min) with upper limit of +100 and lower limit of -100
CCI Investment strategyAn investment strategy that identifies investment opportunities when momentum is in favour on the upside and exits when momentum is increasing on the downside.
Applicable to all stocks across all markets.
Timeframe: Weekly
What is missing here is a pyramiding strategy to make the winners really big. Do not risk more than 1% of your capital on a single stock based on this strategy.

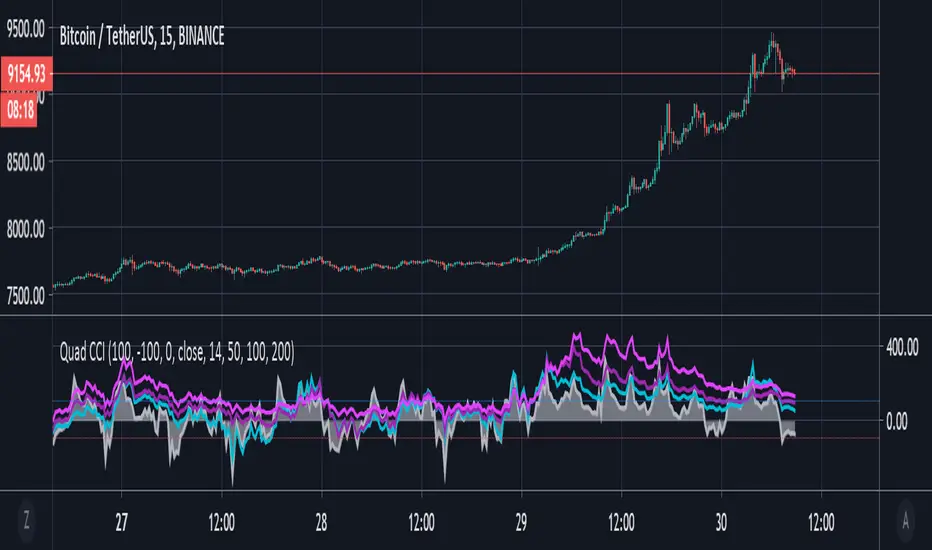
Quad CCI ContainmentThe Quad CCI is a trend identification indicator described by Mark Whistler in his book 'Volatility Illuminated'. The reason for using four separate CCI channels is so that we can:
Prevent ourselves from taking positions against momentum.
Time our trades with short-term 'wrist-rocket' thrust from the larger market momentum.
Clearly determine whether the trend is up, down, or sideways.
In his book, Whistler refers to four CCI channels as 'The Four Horsemen'. The 100 and 200 are like big burly swordsmen, which are hard to budge without significant force. The 50-period CCI is more like the guy who's fast on his feet, but still tough enough to take on the big dudes. And the 14-period is similar to the scout of the party. The fastest of the bunch, but also the first to turn-tail at any sign of danger.
Basically, this means that when we see the 100 and 200-CCI stay above the 0 line, we can infer there really isn't any reason for them to move out of their range. The 50-period CCI will sometimes venture over the 0-line, before the hefty battlers. However, the 14-period will often venture (quickly) way out into the yonder, and he will always return to tell his pals what he's found. Crossing back over the 100-line, traders can take 'rocket trend reentry' positions (usually on the median); however, we still want to keep an eye on the flighty 14-period CCI character. If he crosses back over the +100 or -100 level he was just scouting, it means the larger weighted CCI lines could soon to follow too, as the whole bunch runs from larger momentum on the way.
Traders seeking to take a position 'with the trend' can attempt to purchase pullbacks on the mean if:
Longer-term CCI (at least the 200 and 100) are above zero.
The 50-period CCI is not below -100.
The 14-period travels back up from underneath the -100 area.
TSI CCI HullThis Strategy is Using TSI and CCI and Hull Moving Average to make swing trades on 1H chart but can be used on any pair and timeframe just change settings to suit (Hull Period mostly)
ALLinBull&Bear v9.0 STRATEGYEach of my Allin Custom Indicators combined, ads to your understanding where the Market could go next. Each of them have their own purpose and set of rules.
You will weight gathered information to get a better understanding of when to ENTER or EXIT a position (SHORT or LONG).
First you need to find the right Indicator Settings and the best preforming TimeFrame for chosen crypto or fiat pair. You will do that with a "STRATEGY" Indicator. I chose either 3min TF for highly liquid assets or 15min TF for assets of low liquidity but you can choose whatever you want to up to 30min TF.
Do not stop until you find 80% or more Precent Profitable result (test different setting on different TF for best results) in Strategy Tester. You can backtest your Strategy with different settings and in different TimeFames to find the very best results for that pair.
BACKTESTING past results does not guarantee your future results. BACKTESTING is used to fine-tune your indicator.
Example: with a guitar tuner (Strategy Tester in our case) you fine-tune your guitar (our Indicators in our case) so you know what tone the guitar will produce when you hit a certain note ("in-tuned" visual interpretation of the Market in our case). It is normal to get a 100% Precent Profitable result from backtesting with very little Drawdown. More than 80% and low drawdown usually means Indicators is "in-tune".
CUSTOM INDICATOR TYPE: STRATEGY
SETUP
There are five different settings. To use them efficiently you need to understand what is their purpose and meaning.
"2nd", "3rd" and "4th" FIELD
All of my custom indicators use data from 4 different TimeFrames. First TimeFrame is the one you picked in TradingView. Now you need to set up the other three TimeFrames. To do that you need to click on the "Settings" icon on this indicator and change the "2nd", "3rd" and "4th" field. The preferred setting I use to start searching for the best performing set of Settings is 2-8-32 OR 3-9-27 OR 4-16-64 OR 5-20-80. Those numbers are multiplication of chosen TimeFrame.
Example: setting 2-8-32 on a 5-minute TimeFrame means it will gather data from 5min TF, 10min TF (5minX2), 40min TF (5minX8) and 160min TF (5minX32).
Smoother FIELD
This Field is used to average down all that data indicator it is gathering from the price chart. I use integers like for example 9, 18, 27, and any number in between. It is connected to volatility. High Volatility needs Low Number and vice versa.
Threshold FIELD
This Field is used to cancel down all the mini signal confirmations that are false due to an insignificant influence on future price movements. This number is usually best at 21. When you set all other Fields and get satisfying results you can still try and fine-tune it even more and get even better results.
HOW TO USE IT
First, you have to choose your TimeFrame. I choose either 3min TF for highly liquid assets and 15min TF for assets of low liquidity but you can choose whatever you want to up to 30min TF. Example: if you chose 30min TimeFrame and you fill the "4th" Field with the number "80", one of observed TF by the indicator will be "30minX80" or "2400min" or "40h" TimeFrame, so it is HUGE.
It always depends based on the nature of the actual pair you are looking at. If it is very volatile with a lot of volume, the market beat for this pair settings is very different from another pair with for example very little volume and low volatility. So you need to find the right Indicator Settings at the right TimeFrame for each pair you are following. You are basically tuning your Indicator like you would tune your guitar so you know what to expect before hitting those "strings" of yours.
Find the best performing setting and TimeFrame with help from a TradingView feature called "Strategy Tester". Get familiar with this feature. But rule of thumb is: everything more than 80% Precent Profitable result with Max Drawdown (negative yield from the worst closed position) lower or similar to AvgTrade is considered good enough tuning of my Indicators.
You need to reevaluate your best setting whenever your last trade gets a negative result or something big (whale manipulation) happens on the market. You need to re-tune your Indicator so it will be in tune with the Market again. Check and try to find better performing (better Precent Profitable result, lower Drawdown) settings periodically every few days to find your best yielding results.
CUSTOM INDICATOR: BULL&BEAR
HOW TO READ IT
WHITE WAVY LINE AND TWO HORIZONTAL WHITE LINES
With this one just follow the existing rules when exiting an oversold or overbought area as in RSI,CCI or SRSI indicator. When combining with the signal colored lines in the background it then makes better sense if it is a false signal and it will turn back or it is the right signal and it will exit the oversold or overbought area and advance in that direction.
IN THE BACKGROUND: NINE COLORED LINES
Rule of thumb here is the more GREEN LINES you see the more LONG/BUY the Signal is and vice versa. It helps to look at those lines a few hours back to get the "feel" where the market is pushing the price. First (1), second (2) and seventh (7) line are the most important lines and they have to be aligned and prevailed in the same color to get a viable signal but it still needs to be confirmed with other Signals.
Before making any decisions based on visualisation you should refresh the page. Indicator is very data sensitive and needs that very last data for the most accurate visual representation of the Market.

ALLinOscillator v3.0 STRATEGYEach of my Allin Custom Indicators combined, ads to your understanding where the Market could go next. Each of them have their own purpose and set of rules.
You will weight gathered information to get a better understanding of when to ENTER or EXIT a position (SHORT or LONG).
First you need to find the right Indicator Settings and the best preforming TimeFrame for chosen crypto or fiat pair. You will do that with a "STRATEGY" Indicator. I chose either 3min TF for highly liquid assets or 15min TF for assets of low liquidity but you can choose whatever you want to up to 30min TF.
Do not stop until you find 80% or more Precent Profitable result (test different setting on different TF for best results) in Strategy Tester. You can backtest your Strategy with different settings and in different TimeFames to find the very best results for that pair.
BACKTESTING past results does not guarantee your future results. BACKTESTING is used to fine-tune your indicator.
Example: with a guitar tuner (Strategy Tester in our case) you fine-tune your guitar (our Indicators in our case) so you know what tone the guitar will produce when you hit a certain note ("in-tuned" visual interpretation of the Market in our case). It is normal to get a 100% Precent Profitable result from backtesting with very little Drawdown. More than 80% and low drawdown usually means Indicators is "in-tune".
CUSTOM INDICATOR TYPE: STRATEGY
SETUP
There are five different settings. To use them efficiently you need to understand what is their purpose and meaning.
"2nd", "3rd" and "4th" FIELD
All of my custom indicators use data from 4 different TimeFrames. First TimeFrame is the one you picked in TradingView. Now you need to set up the other three TimeFrames. To do that you need to click on the "Settings" icon on this indicator and change the "2nd", "3rd" and "4th" field. The preferred setting I use to start searching for the best performing set of Settings is 2-8-32 OR 3-9-27 OR 4-16-64 OR 5-20-80. Those numbers are multiplication of chosen TimeFrame.
Example: setting 2-8-32 on a 5-minute TimeFrame means it will gather data from 5min TF, 10min TF (5minX2), 40min TF (5minX8) and 160min TF (5minX32).
Smoother FIELD
This Field is used to average down all that data indicator it is gathering from the price chart. I use integers like for example 9, 18, 27, and any number in between. It is connected to volatility. High Volatility needs Low Number and vice versa.
Threshold FIELD
This Field is used to cancel down all the mini signal confirmations that are false due to an insignificant influence on future price movements. This number is usually best at 21. When you set all other Fields and get satisfying results you can still try and fine-tune it even more and get even better results.
HOW TO USE IT
First, you have to choose your TimeFrame. I choose either 3min TF for highly liquid assets and 15min TF for assets of low liquidity but you can choose whatever you want to up to 30min TF. Example: if you chose 30min TimeFrame and you fill the "4th" Field with the number "80", one of observed TF by the indicator will be "30minX80" or "2400min" or "40h" TimeFrame, so it is HUGE.
It always depends based on the nature of the actual pair you are looking at. If it is very volatile with a lot of volume, the market beat for this pair settings is very different from another pair with for example very little volume and low volatility. So you need to find the right Indicator Settings at the right TimeFrame for each pair you are following. You are basically tuning your Indicator like you would tune your guitar so you know what to expect before hitting those "strings" of yours.
Find the best performing setting and TimeFrame with help from a TradingView feature called "Strategy Tester". Get familiar with this feature. But rule of thumb is: everything more than 80% Precent Profitable result with Max Drawdown (negative yield from the worst closed position) lower or similar to AvgTrade is considered good enough tuning of my Indicators.
You need to reevaluate your best setting whenever your last trade gets a negative result or something big (whale manipulation) happens on the market. You need to re-tune your Indicator so it will be in tune with the Market again. Check and try to find better performing (better Precent Profitable result, lower Drawdown) settings periodically every few days to find your best yielding results.
CUSTOM INDICATOR: OSCILLATOR
HOW TO READ IT
GREEN AREA on the bottom and RED AREA on top are just like the oversold or overbought areas in RSI, CCI or SRSI and uses the same principle.
Example: when a WHITE wave line crosses-UP WHITE horizontal line in GREEN area it means that it is a LONG/BUY signal/confirmation. It needs to be confirmed with other confirmation signals in that same Indicator on in a "BULL&BEAR" Indicator to get better understanding that the price would not turn back down due to a false price move in UPWARDS direction.
GREEN or RED OSCILLATOR WAVE AREAS indicates the direction price is going and how strong the "force" behind the price move is.
Example: if WHITE LINE is over the RED/GREEN LINE the area turns GREEN and it is a LONG/BUY signal. When a shadow color is on the OTHER SIDE that means it is an added confirmation for a LONG/BUY position. When a SHADOW AREA is over the GREEN AREA and turns RED it usually means there are still forces pulling the price down.
Before making any decisions based on visualisation you should refresh the page. Indicator is very data sensitive and needs that very last data for the most accurate visual representation of the Market.

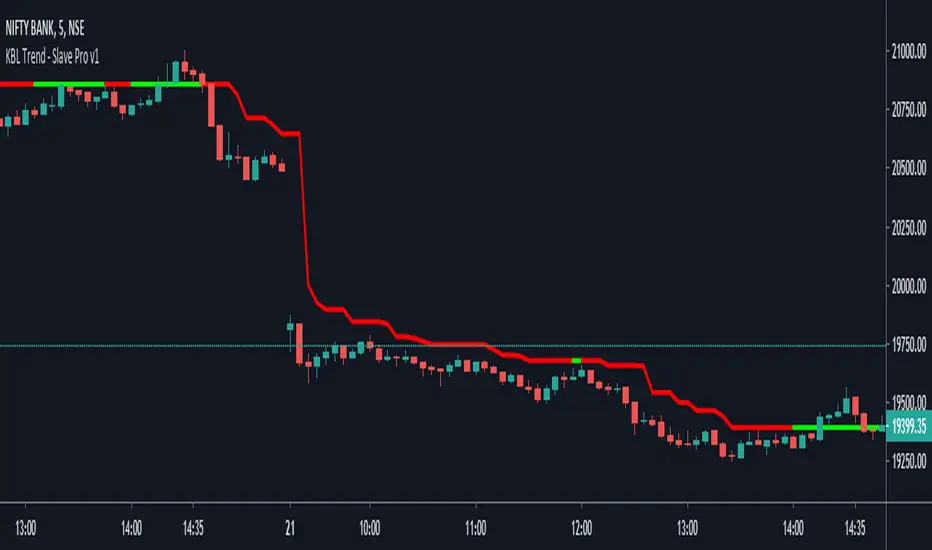
KBL Trend - Slave Pro v1KBL Trend Slave is Specially design to detect the correct trend and specially to avoid market noise in range bound market conditions.
When KBL Trend - Slave line indicated with Green color and price is above the KBL Trend -Slave, Then the trend is in buy side and a buy trade is preferred.
And same for sell trade,
When KBL Trend - Slave line indicated with Red color and price is Below the KBL Trend - Salve , Then the trend is in sell side and a sell trade is preferred.
Few more optimizations have been added to the script to gain more fine curves.
PM us to obtain access.
KBL Trend - Filter Pro v1KBL Trend Filter is a combination of Average true range and range breakout settings.
When KBL Trend -Filter Vertical line indicated with Green color and price cross over the candle on which the green vertical indicator came, then it is considered as a buy trades.
And same for sell trade,
When KBL Trend -Filter Vertical line indicated with Red color and price cross below the candle on which the Red vertical indicator came, then it is considered as a sell trades.
Change-log :
Few optimizations added for more smooth curves,
separated from main chart and added to separate chart window just below the main chart for easy visibility.
PM us to obtain access.

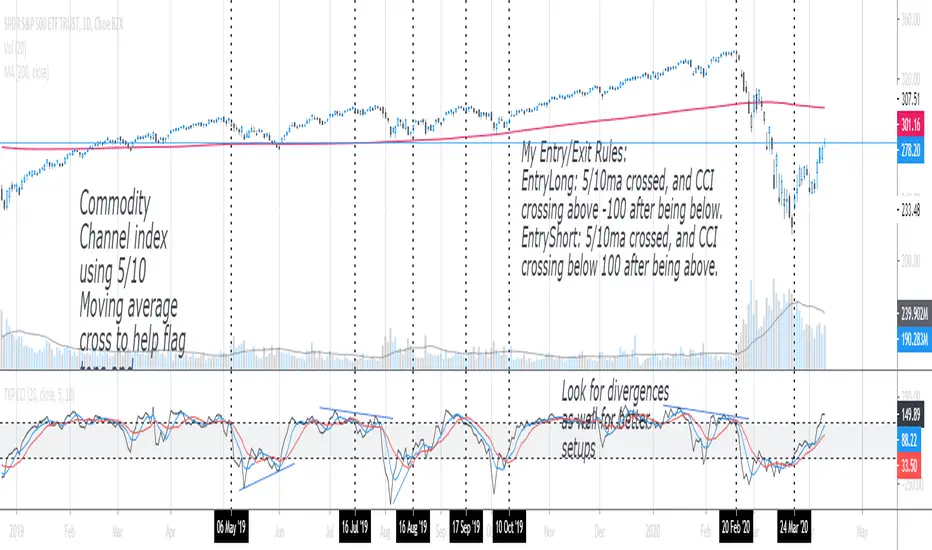
TKP Commodity Channel IndexThis indicator plots moving averages along CCI. This can help Identify trend and divergences in a smoother and less erratic way.
KBL Trend - MasterKBL Trend Master is Specially design to detect the upcoming and current trend using Price action and ATR based combined Trading strategy.
When KBL Trend - Master line indicated with Teal color and price is above the KBL Trend - Master Line , Then the trend is in buy side and a buy trade is preferred.
And same for sell trade,
When KBL Trend - Master line indicated with Orange color and price is Below the KBL Trend - Master Line , Then the trend is in sell side and a sell trade is preferred.

KBL Trend - SlaveKBL Trend Slave is Specially design to detect the correct trend and specially to avoid market noise in range bound market conditions.
When KBL Trend - Slave line indicated with Green color and price is above the KBL Trend -Slave, Then the trend is in buy side and a buy trade is preferred.
And same for sell trade,
When KBL Trend - Slave line indicated with Red color and price is Below the KBL Trend - Salve , Then the trend is in sell side and a sell trade is preferred.


ARKADIY_ALERTS v1.0
This is an alert indicator for ARKADIY v 1.0 strategy .
Use it along with the strategy to receive alerts when the strategy generates buy/sell signals.
The strategy and the alert indicator are invite only.
To get access please write in coomments or pm me.
------------------------------------------------------------------
Данный индикатор является алертом для стратегии ARKADIY v 1.0 .
Используйте его вместе со стратегией для получение уведомлений когда будут генерироваться сигналы на покупку/продажу.
Индикатор и стратегия ограничены по доступу.
Для получения доступа пишите в комментарии и в сообщениях.
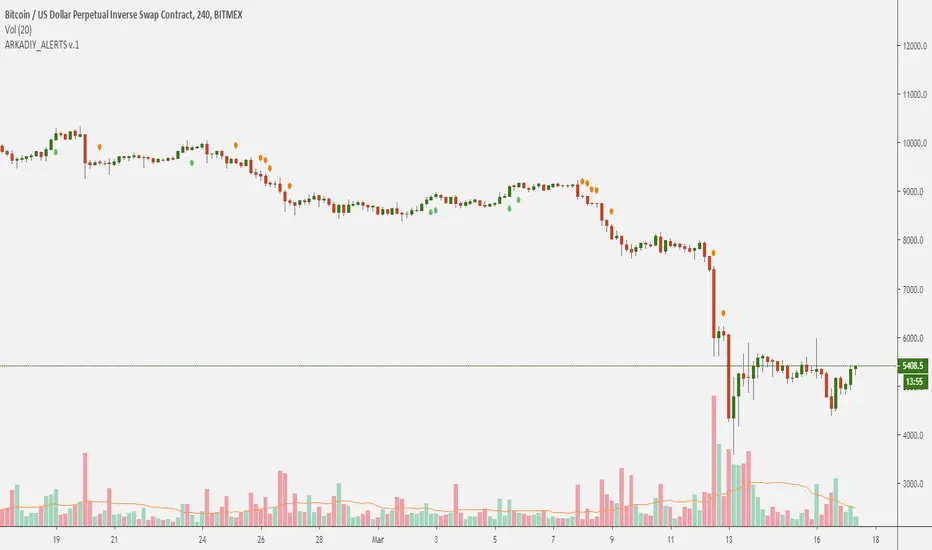
ARKADIY V1.0This strategy is made for trading Bitcoin (BTC) using data from BITMEX exchange on 4 hour timeframe.
There is also a special indicator for the strategy to receive alerts on your tradingview platform which is very handful to enter the market as soon as there is a buy/sell signal.
Strategy is based on Pine script v.4 and it uses several indicators and oscillators (modified RSI, CCI, ADX, TRIX and EMA) to generate a buy/sell signal for BTC.
There is no repaint, which means that a signal will not disappear when price goes in wrong direction.
And this is one of the advantages of the strategy over other 90% strategies.
The strategy is a SWING strategy, which means that a signal for opening a position (buy or sell) at the same time closes previous position.
Because of its specificity the strategy doesn’t have take profit/stop loss options and doesn’t use leverage.
The strategy has a backtest statistics on TradingView. 2018 – 1197%, 2019 – 79%, until March 13, 2020 – 88% of net profit.
Max drawdown (the sum of non-profitable trades until receiving a profitable trade) during a year not more than 14%.
To get access to the strategy write in comments and in private messages.
_____________________________________________________________________________________________________________
Данная стратегия работает на инструменте биткоин ( BTC ) по котировкам биржи BITMEX на 4 часовом таймфрейме, а также имеет удобные алерты для сигналов на сделку (будильник).
Это позволит Вам заниматься своими делами, не следя за тем, что происходит на рынке, но в нужное время совершить сделку, получив предупреждение на телефон / компьютер.
Стратегия построена на последней версии Pine Script, в ее основе лежит совокупность множества индикаторов и правил (модифицированные RSI, CCI, ADX, TRIX and EMA), которые в определенный момент дают сигнал на покупку или продажу BTC . Стратегия протестирована с использованием аргумента "Recalculate After Order is Filled" и подразумевает "non-repaint" базис. Другими словами, если стратегия показала вход в сделку (по итогу закрытия свечи) - то сигнал так и остается без изменений. Это выгодно отличает данную стратегию от 90% таковых в Trading View и дает уверенность, что появившийся сигнал не исчезнет в случае, если рынок пойдет в противоположную сторону.
Данная стратегия относится к сегменту SWING стратегий, когда один сигнал является одновременно закрытием одной сделки и открытием противоположной.
В связи со спецификой стратегии она не использует стоп-ордера, поэтому предполагает торговлю без плечей.
Ваш риск ограничен временным интервалом от момента, как цена пошла в противоположную сторону, до момента пока стратегия не дала сигнал на перекладку в новую сделку.
Статистика, подтвержденная бэктестом в Trading View, за последние пару лет: 2018 - 197%, 2019 - 79%, на 13.03.20 - 88%. Это данные по Чистой прибыли на вложенный капитал.
Максимальная длящаяся просадка (совокупность минусовых сделок до момента возникновения плюсовой сделки) в течение года составляет не более 18%
Основные отличия от индикаторов наших коллег:
+ Результаты бэктеста не в excell, а в платформе Trading View – прозрачная статистика по сделкам
+ Построен на принципах non-repaint basis – сигналы не исчезают и не появляются из неоткуда
+ Работает на 4Н таймфрейме. Это значит сделки не могут быть чаще, чем в раз в 4 часа. Занимайтесь своими делами, пока стратегия стоит на страже рыночного анализа. Она сама Вам сообщит, когда нужно открыть / закрыть сделку.
+ Разберется любой! Стратегия построена по принципу one-click setup
+ Поддержка с возможностью организации телефонного звонка.
Для предоставления доступа к данной стратегии - пожалуйста пишите в комментариях запрос с копией в личные сообщения. Мы быстро с Вами свяжемся.

Point and Figure (PnF) CCIThis is live and non-repainting Point and Figure Chart Commodity Channel Index - CCI tool. The script has it’s own P&F engine and not using integrated function of Trading View.
Point and Figure method is over 150 years old. It consist of columns that represent filtered price movements. Time is not a factor on P&F chart but as you can see with this script P&F chart created on time chart.
P&F chart provide several advantages, some of them are filtering insignificant price movements and noise, focusing on important price movements and making support/resistance levels much easier to identify.
Commodity Channel Index – CCI was developed by Donalt Lambert. CCI can be used to identify overbought or oversold, a new trend or warn of extreme conditions. CCI measures the difference between a security's price change and its average price change. High positive readings indicate that prices are well above their average, which is a show of strength. Low negative readings indicate that prices are well below their average, which is a show of weakness.
The Formula for the Commodity Channel Index ( CCI ) Is:
CCI = (Typical Price – L-period SMA of TP) / (0.015 * Mean Deviation)
Mean Deviation = (SumOf 1->L ( |TP – MA| )) / L
L = Length
TP = Typical Price
If you are new to Point & Figure Chart then you better get some information about it before using this tool. There are very good web sites and books. Please PM me if you need help about resources.
Options in the Script
Box size is one of the most important part of Point and Figure Charting. Chart price movement sensitivity is determined by the Point and Figure scale. Large box sizes see little movement across a specific price region, small box sizes see greater price movement on P&F chart. There are four different box scaling with this tool: Traditional, Percentage, Dynamic (ATR), or User-Defined
4 different methods for Box size can be used in this tool.
User Defined: The box size is set by user. A larger box size will result in more filtered price movements and fewer reversals. A smaller box size will result in less filtered price movements and more reversals.
ATR: Box size is dynamically calculated by using ATR, default period is 20.
Percentage: uses box sizes that are a fixed percentage of the stock's price. If percentage is 1 and stock’s price is $100 then box size will be $1
Traditional: uses a predefined table of price ranges to determine what the box size should be.
Price Range Box Size
Under 0.25 0.0625
0.25 to 1.00 0.125
1.00 to 5.00 0.25
5.00 to 20.00 0.50
20.00 to 100 1.0
100 to 200 2.0
200 to 500 4.0
500 to 1000 5.0
1000 to 25000 50.0
25000 and up 500.0
Default value is “ATR”, you may use one of these scaling method that suits your trading strategy.
If ATR or Percentage is chosen then there is rounding algorithm according to mintick value of the security. For example if mintick value is 0.001 and box size (ATR/Percentage) is 0.00124 then box size becomes 0.001.
And also while using dynamic box size (ATR or Percentage), box size changes only when closing price changed.
Reversal : It is the number of boxes required to change from a column of Xs to a column of Os or from a column of Os to a column of Xs. Default value is 3 (most used). For example if you choose reversal = 2 then you get the chart similar to Renko chart.
Source: Closing price or High-Low prices can be chosen as data source for P&F charting.
Upper Band : as default, Upper band is 100
Lower Band : as default, Lower band is -100
There are alerts when P&F CCI moves above Upper Band or moves below Lower Band.

AllinStrategy v5.0 ::: Allin® MarketEnergy™You need two indicators for it to work: AllinTension 5.0 and AllinStrategy 5.0 and use them in synergy.
They measure and gather information and then present them in an intuitive way for better opportunity spotting and a better and quicker decision making about buy or sell entries in certain markets.
In works with crypto, stock, fiat and futures market.
I will explain how it works o a page but as a thumb rule: the more GREEN you see turning up like an energy the more LONG situation is and the more RED you see turning up like en energy the more SHORT the situation is.
The best thing about a product of mine is that it can be backtested. Results of backtesting yields up to 85% of accuracy and risk-reward ratio up to 5X or more.
Indicator - AllinTension 5.0
This indicator will enable you to actually feel the market on several levels. Exploiting informations from different timeframes and different oscillators with different setting and average them out.
With this indicator you will either confirm the sensed direction or you will skip the opportunity because signals are not properly aligned. To be able to resist FOMO is really crucial here. Opportunities are in abundance. There will be more. A lot more. Really.
How to read it and properly use it?
For more in depth understanding on how it works and proper usage of it. There is lot of information on the page.
Strategy: AllinStrategy 5.0
This strategy indicator is used as a backtesting platform for different types of various settings for a selected pair.
Backtesting means you can test each TimeFrame (best 1-9min) with various AllinTension indicator settings. You will get a result for profitability in the last period (but it is not that important anything but for maybe feeling bad you missed it), success rate in percent (anything above 70% is good enough) and you have to watch the ratio of the max dropdown and average trade size (least acceptable is -5x, better is 2x or less).
So you will learn which strategy (TF and indicator setting) has steadily preformed best while being profitable in the past and assume it will do that in the same manner with same accuracy in the future. It sometimes changes so you need to preform rutine testing after some bigger market movements.
With this you will find the best preforming TImeFrame for each window. You will adjust settings for each window differently to diversify view on the market. My personal best setting are for the first window 4-16-64, second window 3-9-27, third window 2-8-32 and forth last window 5-20-80.
So ALLinStrategy is a visual representation of the market and the most important thing, it includes a feature "Strategy Tester" to backtest chosen strategy. The results may surprise you and they can all be proven!:) So what do you do in this case? :):)
But to really understand the market and given signals from this Strategy, you will need indicator ALLinTension or you are going blindfolded guess trading.
How to read it and properly use it?
For more in depth understanding on how it works and proper usage of it There is lot of information on the page.
For strategy to work you first have to find profitable and accurate enough TF (more than 70% should do the trick)and indicator settings (there are some favourites) and apply it to your executing strategy.
