CCI MACDWe usually use closing prices for MACD calculations.
However, this indicator is calculated using CCI.
Indice Commodity Channel (CCI)
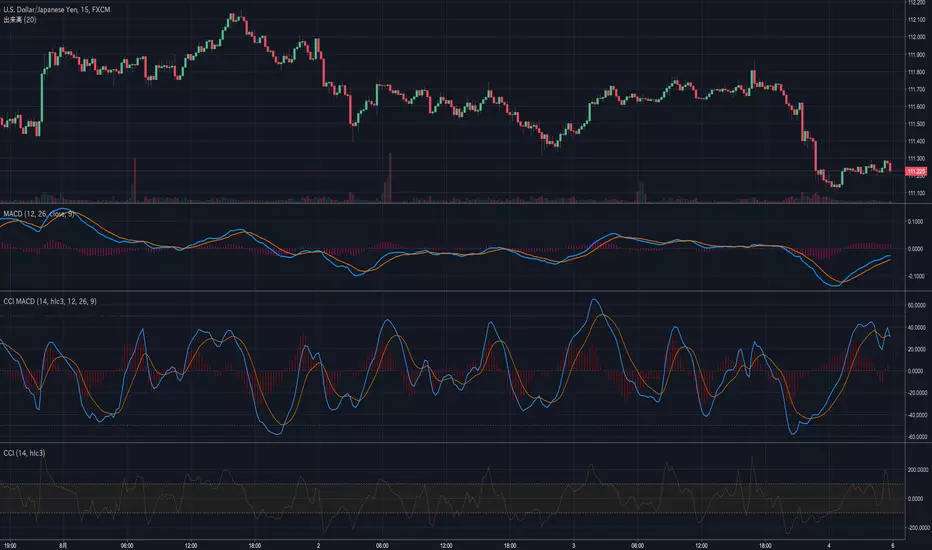
CCIandVIXreplace
This strategy aim volatility.
This strategy's Long looks like good, but it is bad at two-stage lowering.
Make sure to cut loss.
This Close is not good, so it is only as a guide.

Avalon T3-CCI v1My first official version based on T3-CCI with a few adjustments with Buy & Sell Signals.
Better seen on a dark theme on default values.
You can adjust the top line & bottom line for a tighter or wider entry or exit.
The signals are triggered when CCI crosses the bottom or top line upwards or downwards.
It works with every chart and better on longer timeframes.
Please use it in conjunction with other indicators as not every entry is perfect but quite a profitability %
Don't forget to place stop losses to protect your capital if it doesn't go your way.

All-in-One Solutions - MTF Panes Indicators (incl. Alerts)Hello,
This indicator is able to show oversold or overbought conditions in different time frames.
As shown in above exemple, the chart was oversold in 4 different time frames and got an increase after.
This indicator can show up to 4 time frames for the following indicators : RSI , CCI , MACD , MFI , Prabolic SAR 0.08% , ... and I will be able to add other indicators according to the request of the users.
The choice of the indicator, the time frames, and the length are fully customizable as show on the screenshot of the menu :
imgur.com
I also added all alerts conditions so you can be informed when all the conditions are gathered, as shown in the alert menu :
imgur.com
Please contact me in order to get access to this indicator. Please note that by subscribing to my offer, you will have access to all indicators I made and and the futur indicators I will develop according to the demand of the community.
After subscribing, all indicators will be added into your under invitation indicators list or you can have a look on my Tradingview page :https://fr.tradingview.com/u/KenLeShim/#published-scripts
I hope my indicators will help you !

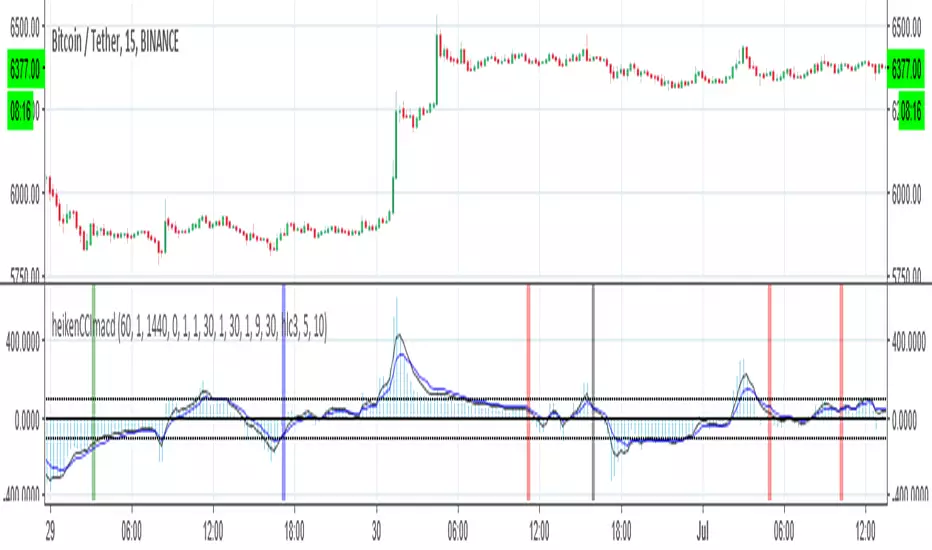
heikenCCImacdI just made new exit point and buy point to older version with some tweek
two buy system 1. based on heiken strategy with filtering by CCI (green red =long short) i little change the old exit point
the other 2. based on cross of CCI in constriction of macd (blue black =long1 shor1)
alerts included
so one can decide on what he like also it possible to combine between them :)
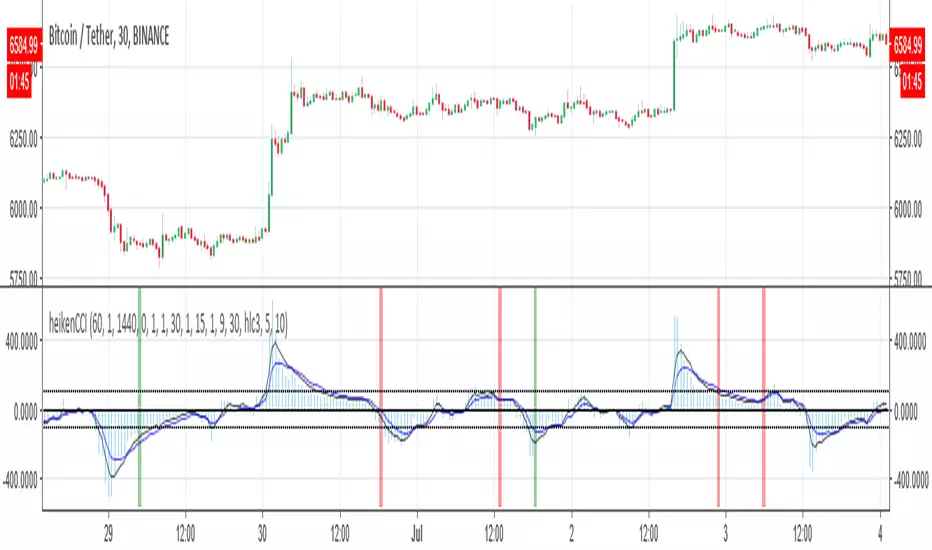
heikenCCIthe aim is to make winning strategy better. the buy point based on heiken strategy with more 80% winning rate and to filter the wrong buy points with CCI buy points
alerts inside


Quad-CCIAn excellent tool for trend identification and finding entries. I'll be releasing a video explanation of how to use this shortly.

Rsi/Cci Overbought Oversold CandlesThis indicator will allow you to see overbought and oversold areas of the rsi or the cci, you must set yourself the upper and lower band of the rsi (70-30) or cci (100, -100). By default, it's Rsi
I have already posted the same indicator but only with the Rsi, I wanted to posted a more complete that offers the 2.
On the chart, it is the overbought / oversold area of the Cci that is displayed

[AGHYAD]EMA-CROSS+CCI_BASED_ON_RENKO////////////////////////////////////////////
// 4 HOURS
// -------------------------- BUY --------------------------
// 1. MUST: Set Time_Frame To 1D
// 2. STRONG: Any Green Signal!!
////////////////////////////////////////////
EMA-CROSS + CCI SIGNALS BASED ON RENKO WITH CUSTOM TIME-FRAME

Silver Trading SignalNOTE 1: Only for S
NOTE 2: Only for timeframe : 30 Minute
Gold and Silver both trade the same way, opposite of DXY but silver fluctuations are higher and different from Gold. This script has been optimized for Silver only, not for gold.
How to trade:
Just see the signals for buy and sell on the chart.
Give your feedback after testing this strategy. :)

Gold CorrelationsGold has correlations with many trading pairs such as silver, oil, euro, yen, usd, aud, spx, nekkai and many more to go.
In this script i have added GOLD, SILVER, currency of US, EUROPE and JAPAN.
NOTE : More corelations will be added soon.
The corelations will ranged from 0 to 100 denoting the strength.
It is an modified indicator. To be more precise, the raw data is converted to unbounded range according to their strength and then converted to bounded range of 0 to 100.
HOW TO USE
As we can see in the first vertical black line, US started going up and after the second vertical black line, Gold, silver, Europe, Japan started to go downwards.
We can see a nice correlation and call it a nice short.
In future will be adding more correlations.

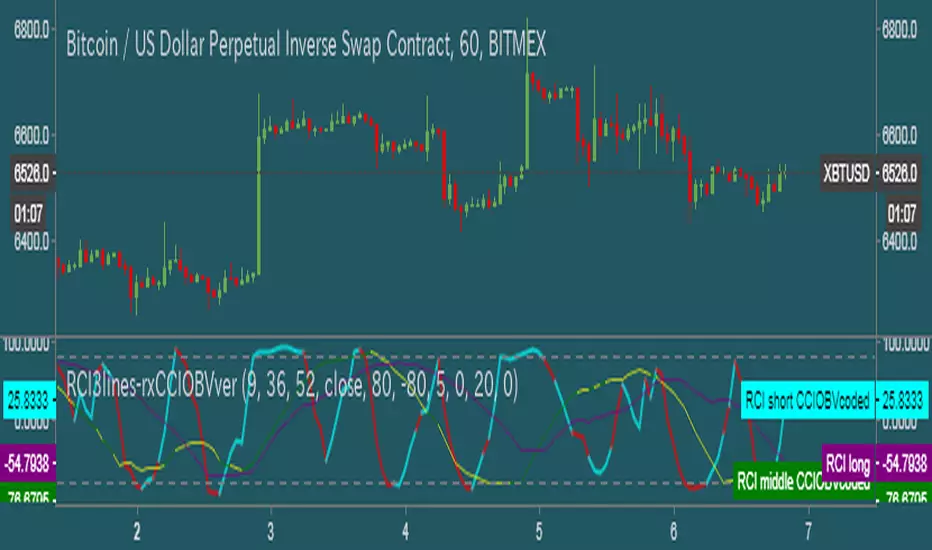
CCI OBV 4Kmod of lazy bear's OBV coded CCI , which indicates CCI state by changing the color of the OBV. now it shows you when CCI is overbought or oversold, not just one or the other
when CCI > 100, that's an oversold signal and OBV line turns green
when CCO -0.54% < -100, that's an undersold signal and OBV line turns red
CCI threshold can be changed (ex. 200 and -200)
EMA is overlaid, too, in orange, and that period can be changed

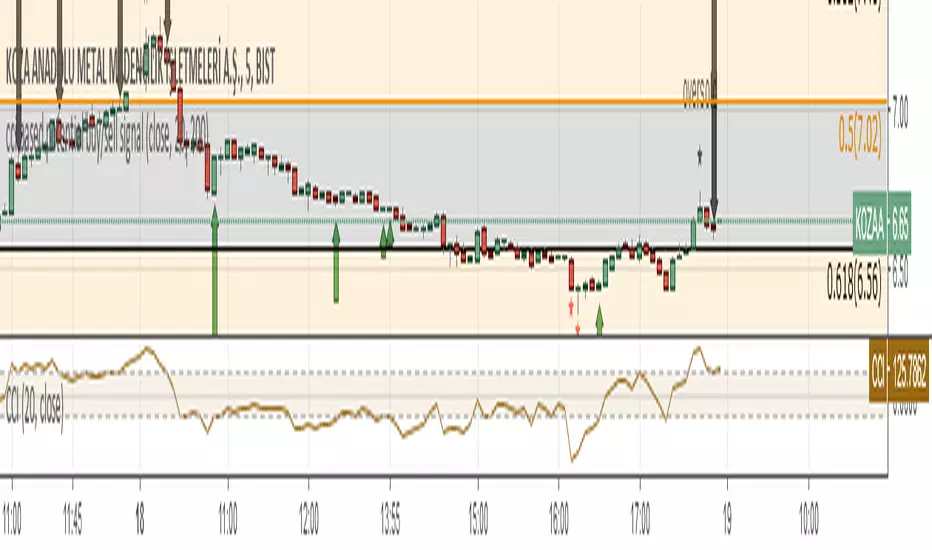
cci based potential buy/sell signal
Commodity Channel Index Potential Buy Signal
Commodity Channel Index (CCI) is below oversold line (-200).
CCI then crosses above -100 line
Commodity Channel Index Potential Sell Signal
Commodity Channel Index (CCI) is above overbought line (+200).
CCI then crosses below +100 line.
Türkçe Açıklama;
CCI Potansiyel Al Sinyali
CCI indikatörünün -200 altında bulunduğu bölgeler aşırı satış bölgeleri,
Sonrasında aşağıdan gelerek -100 çizgisinin üzerine çıktığı yada çıkmak üzere olduğu noktalar al sinyali
CCI Potansiyel Satl Sinyali
CCI indikatörünün +200 üzerinde bulunduğu bölgeler aşırı alım bölgeleri,
Sonrasında yukarıdan inerek +100 çizgisinin altına indiği yada inmek üzere olduğu noktalar sat sinyali
Not: Tek başına kullanılması son derece hatalı sonuçlar verebilir. Sadece olabilirlik potansiyeli taşımaktadır.
TA-CCI (Trend Denormalized CCI)The idea is to account for the trend on the CCI calculation. On trade systems it is intended to be used in the same way as the original CCI.

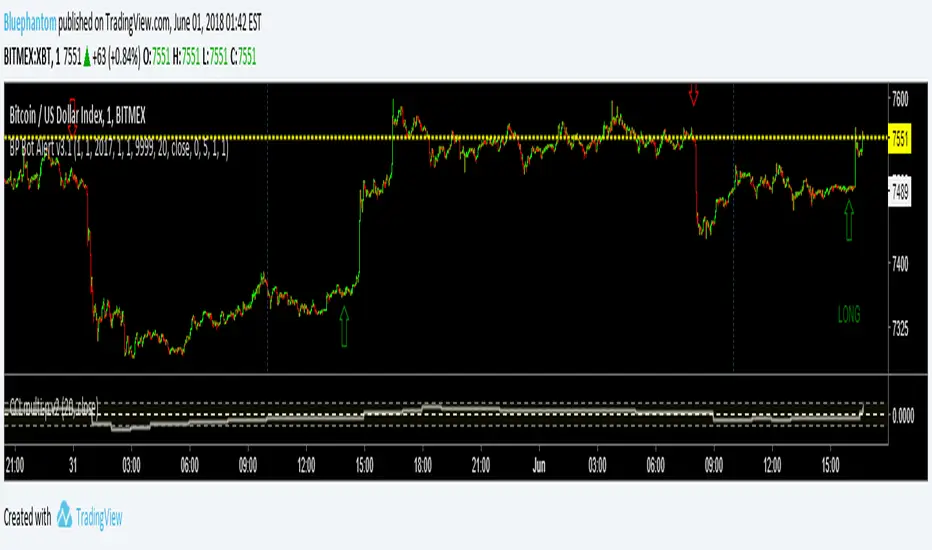
Autoview Bot Alert v3.1 By BluephantomThis Alert Script is invite only. To be considered you must contact me through the Autoview Discord group.
It uses an EMA smoothed Heikin-Ashi and an average CCI based on multi time frames.
Commodity Channel Index Plus (CCI+)Same CCI you love, but with a candle highlighter, control over Overbought & Oversold Line placement, and Alert Conditions for Overbought & Oversold and Recoveries, built right in.
Set the Overbought/Oversold Lines anywhere you want... use them to create CCI+ Alerts.

CCI Colored Candles / Bars w/ HistogramColor of your candles matches your CCI with Histogram indicator and trend line. CCI EMA or SMA based option, traditional or modern formula calculation options ect. Can change Length, source, Trigger Lines, colors of candles and histogram and more
The CCI compares the current price to an average price over a period of time. The indicator fluctuates above or below zero, moving into positive or negative territory. While most values, approximately 75%, will fall between -100 and +100, about 25% of the values will fall outside this range, indicating a lot of weakness or strength in the price movement.
A basic CCI strategy is used to track the CCI for movement above +100, which generates buy signals, and movements below -100, which generates sell or short trade signals. Investors may only wish to take the buy signals, exit when the sell signals occur, and then re-invest when the buy signal occurs again.
The CCI compares the current price to an average price over a period of time. The indicator fluctuates above or below zero, moving into positive or negative territory. While most values, approximately 75%, will fall between -100 and +100, about 25% of the values will fall outside this range, indicating a lot of weakness or strength in the price movement.
When the CCI is above +100, this means the price is well above the average price as measured by the indicator. When the indicator is below -100, the price is well below the average price.
1 CCI strategy is used to track the CCI for movement above +100, which generates buy signals, and movements below -100, which generates sell or short trade signals. Investors may only wish to take the buy signals, exit when the sell signals occur, and then re-invest when the buy signal occurs again.
Long-term chart is used to establish the dominant trend, short-term chart establishing pullbacks and entry points into that trend. A multiple timeframe strategy is commonly used by more active traders and can even be used for day trading, as the "long term" and "short term" is relative to how long a trader wants their positions to last.
When the CCI moves above +100 on your longer-term chart, this indicates an upward trend, and you only watch for buy signals on the shorter-term chart. The trend is considered up until the longer-term CCI dips below -100.
When using a daily chart as the shorter timeframe, traders often buy when the CCI dips below -100 and then rallies back above -100. It would then be prudent to exit the trade once the CCI moves above +100 and then drops back below +100. Alternatively, if the trend on the longer-term CCI turns down, that indicates a sell signal to exit all long positions.
When the CCI is below -100 on the longer-term chart, only take short sale signals on the shorter-term chart. The downtrend is in effect until the longer-term CCI rallies above +100. The chart indicates that you should take a short trade when the CCI rallies above +100 and then drops back below +100 on the shorter-term chart. Traders would then exit the short trade once the CCI moves below -100 and then rallies back above -100. Alternatively, if the trend on the longer-term CCI turns up, exit all short positions.
Make the strategy more stringent by only taking long positions on the shorter time frame when the longer-term CCI is above +100. This will reduce the number of signals, but will ensure the overall trend is very strong.
Entry and exit rules on the shorter timeframe can also be adjusted. if the longer-term trend is up, you may allow the CCI on the shorter-term chart to dip below -100 and then rally back above zero (instead of -100) before buying. This will likely result in a paying a higher price, but offers more assurance that the short-term pullback is over and the longer-term trend is resuming.

