Autocorrelation PlotA tool to plot auto correlation of time series, this is useful in identifying periodicity in a time series or signal.
Due to the limits of Pine Script you'll need to add it multiple times if you want autocorrelation beyond 55 periods. I have added it 4 times here for 220 periods.
For more information on Autocorrelation see: en.wikipedia.org
Note: There are 1 bar gaps every 55 because I wanted the labels to remain every 5, but you don't have to have gaps....
Correlation

Crypto Market CorrelationThis script utilized some new functions in Pine Script, which compares the correlation between the current symbol to a basket of crypto indexes that are listed on the FTX exchange.
By tracking these indexes we can gauge the reaction across markets that have a different market cap. By that I mean we can have a better idea about where the money is flowing into a specific market.
This script uses data from FTX:BTCPERP, FTX:ALTPERP, FTX:MIDPERP, FTX:SHITPERP, FTX:EXCHPERP, FTX:DRGNPERP.
A value closer to 1 equals to more correlation, closer to 0 equals to less correlation.

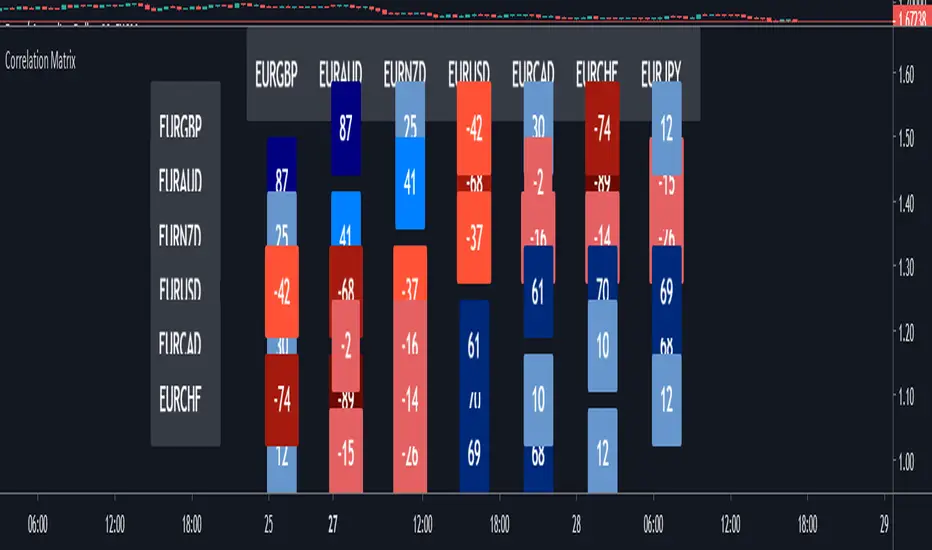
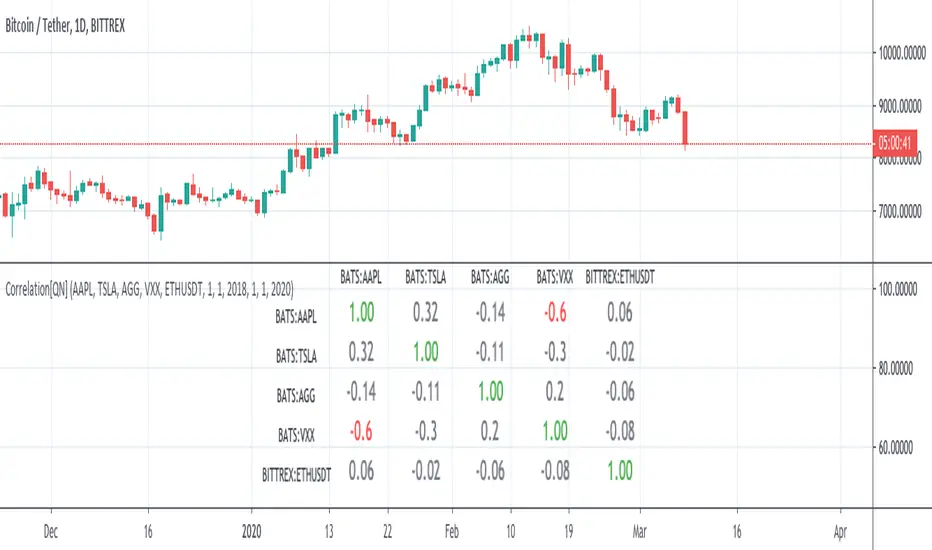
Correlation MatrixIn financial terms, 'correlation' is the numerical measure of the relationship between two variables (in this case, the variables are Forex pairs).
The range of the correlation coefficient is between -1 and +1. A correlation of +1 indicates that two currency pairs will flow in the same direction.
A correlation of -1 indicates that two currency pairs will move in the opposite direction.
Here, I multiplied correlation coefficient by 100 so that it is easier to read. Range between 100 and -100.
Color Coding:-
The darker the color, the higher the correlation positively or negatively.
Extra Light Blue (up to +29) : Weak correlation. Positions on these symbols will tend to move independently.
Light Blue (up to +49) : There may be similarity between positions on these symbols.
Medium Blue (up to +75) : Medium positive correlation.
Navy Blue (up to +100) : Strong positive correlation.
Extra Light Red (up to -30) : Weak correlation. Positions on these symbols will tend to move independently
Light Red (up to -49) : There may be similarity between positions on these symbols.
Dark Red: (up to -75) : Medium negative correlation.
Maroon: (up to -100) : Strong negative correlation.
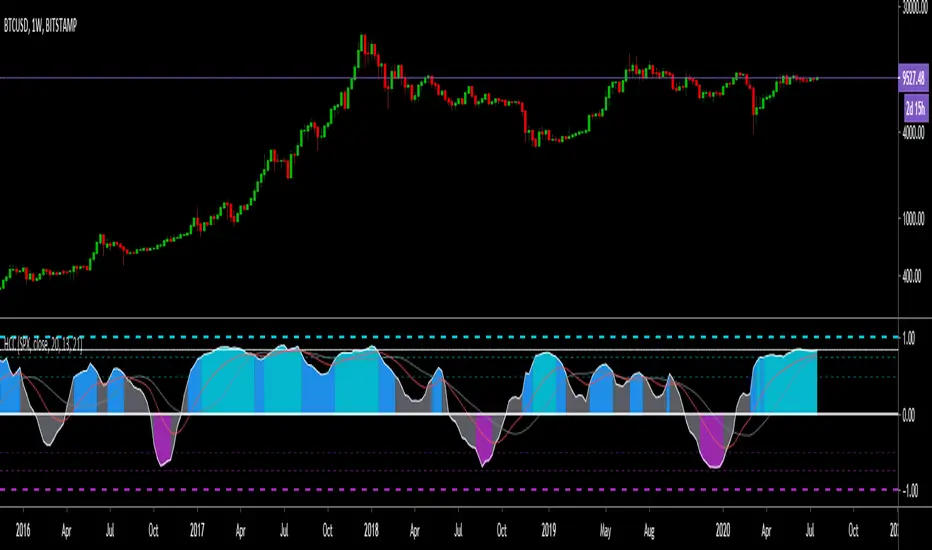
Correlation Trend Indicator - Dr. John EhlersHot off the press, I present this "Correlation Trend Indicator" employing PSv4.0, originally formulated by Dr . John Ehlers for TASC - May 2020 Traders Tips. John Ehlers might describe it's characteristics as being a mean reverting trend identification oscillator range bound to +/-1.0 irregardless of any timeframe or asset. I could have finessed this indicator with all kinds of bells and whistles, but I wanted to keep it simple and handy enough for novice Pine programmers or Tradingview newcomers to use. This algorithm, in a slightly modified form, is actually a small portion of the base code for John Ehlers' highly complex Autocorrelation Periodogram and his Convolution SwamiChart.
Some members may have notice that I published a very similar script last month. That is correct. It's sole intention was completely different, having more diverse versatility and complexity, but with slightly reduced computational performance. While they seem eerily similar, they are genetically different. This function only has only one required "series" parameter and the correlation is calculated using the period, not bar_index. Correlating with bar_index or period yields identical results either way. Bottom line, this indicator is elegantly simplistic, yet highly utilitarian and easy to use.
Features List Includes:
Dark Background - Easily disabled in indicator Settings->Style for "Light" charts or with Pine commenting
AND a few more... You have the source!
The comments section below is solely just for commenting and other remarks, ideas, compliments, etc... regarding only this indicator, not others. When available time provides itself, I will consider your inquiries, thoughts, and concepts presented below in the comments section, should you have any questions or comments regarding this indicator. When my indicators achieve more prevalent use by TV members, I may implement more ideas when they present themselves as worthy additions. As always, "Like" it if you simply just like it with a proper thumbs up, and also return to my scripts list occasionally for additional postings. Have a profitable future everyone!

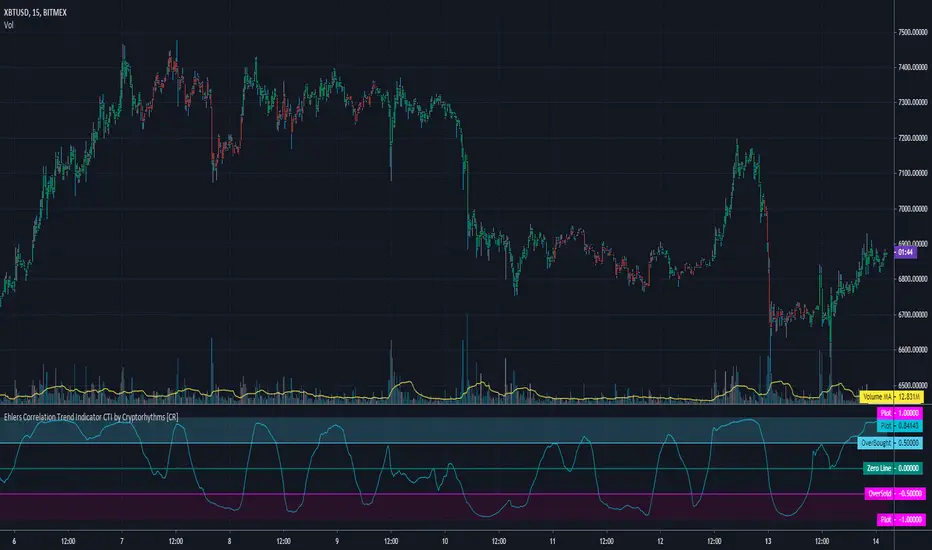
Ehlers Correlation Trend Indicator CTI by Cryptorhythms [CR]Ehlers Correlation Trend Indicator CTI by Cryptorhythms
📜Intro
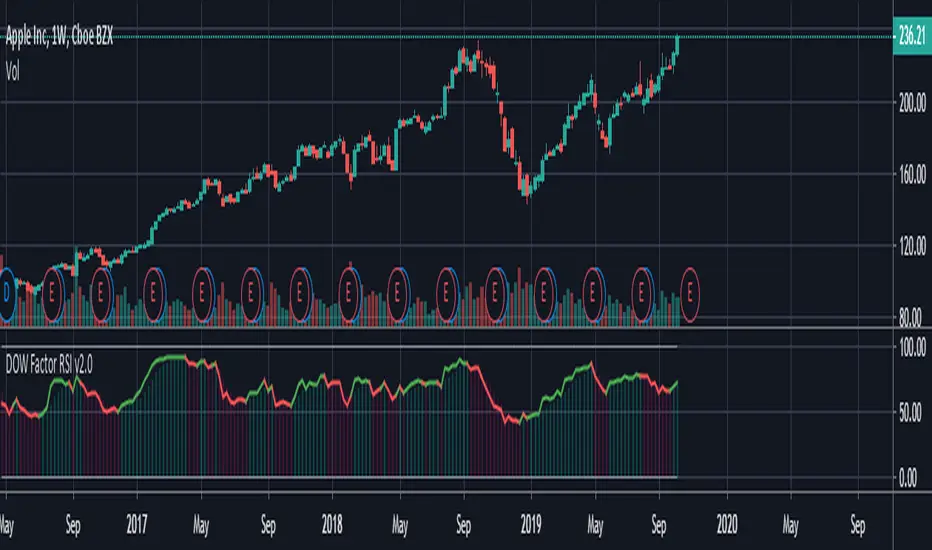
In his article “Correlation As A Trend Indicator” in issue May 2020 of TASC, author John Ehlers introduces a new trend indicator that is based on the correlation between a security’s price history and the ideal trend: a straight line. He describes methods for using the indicator to not only identify the onset of new trends but to identify trend failures as well. He presents what looks like a simple and elegant idea for a trend-detection and mode-switching indicator.
📋Comments
Careful market selection may be the key to a correct application of the indicator. Even such barebone rules could shine with stocks like AAPL that tend to develop prolonged trends. But for others like CAT, which can keep oscillating in ranges for years, results will be much less impressive. They require a different approach. For example, you would want to buy when Correlation Trend falls significantly below zero and sell when it reaches positive values.
Therefore, it would be an interesting problem to research Correlation Trend’s ability to identify the switch to a cycle mode. That might help develop countertrend systems and
trade pullbacks. Another possible application might be to act as a system filter of change from trending mode to mean-reversion mode.
Extras
As usual when porting indicators to the library here on tradingview, I like to add some extra flare!
💠Customizable Overbought and Oversold Zones for Alert Creation
💠Bar coloration based on trade state for easy visual at a glance chart checking
💠Some basic example Entry and Exit conditions and a simple Trade State Engine to get you going creating your own strategy
Enjoy!
👍 We hope you enjoyed this indicator and find it useful! We post free crypto analysis, strategies and indicators regularly. This is our 81st script on Tradingview!
OBV Correlation CoefficientFind the correlation between OBV and price.
Basically, they should be correlated, but sometimes they are inversely correlated (less than -0.4).
It was released because it seems to be in a phase for some reason.
When the inverse correlation is over, it is possible to think about how to buy and sell for the time being
OBVと価格との相関関係を求めます。
基本的には相関するはずなんですけど、たまに逆相関(-0.4以下)になっているときがあります。
何らかの理由で局面になっていそうなので公開しました。
逆相関が終わるときに売買という使い方がとりあえず考えられます

Dual Purpose Pine Based CorrelationThis is my "Pine-based" correlation() function written in raw Pine Script. Other names applied to it are "Pearson Correlation", "Pearson's r", and one I can never remember being "Pearson Product-Moment Correlation Coefficient(PPMCC)". There is two basic ways to utilize this script. One is checking correlation with another asset such as the S&P 500 (provided as a default). The second is using it as a handy independent indicator correlated to time using Pine's bar_index variable. Also, this is in fact two separate correlation indicators with independent period adjustments, so I guess you could say this indicator has a dual purpose split personality. My intention was to take standard old correlation and apply a novel approach to it, and see what happens. Either way you use it, I hope you may find it most helpful enough to add to your daily TV tool belt.
You will notice I used the Pine built-in correlation() in combination with my custom function, so it shows they are precisely equal, even when the first two correlation() parameters are reversed on purpose or by accident. Additionally, there's an interesting technique to provide a visually appealing line with two overlapping plot()s combined together. I'm sure many members may find that plotting tactic useful when a bird's nest of plotting is occurring on the overlay pane in some scenarios. One more thing about correlation is it's always confined to +/-1.0 irregardless of time intervals or the asset(s) it is applied to, making it a unique oscillator.
As always, I have included advanced Pine programming techniques that conform to proper "Pine Etiquette". For those of you who are newcomers to Pine Script, this code release may also help you comprehend the "Power of Pine" by employing advanced programming techniques in Pine exhibiting code utilization in a most effective manner. One of the many tricks I applied here was providing floating point number safeties for _correlation(). While it cannot effectively use a floating point number, it won't error out in the event this should occur especially when applying "dominant cycle periods" to it, IF you might attempt this.
NOTICE: You may have observed there is a sqrt() custom function and you may be thinking... "Did he just sick and twistedly overwrite the Pine built-in sqrt() function?" The answer is... YES, I am and yes I did! One thing I noticed, is that it does provide slightly higher accuracy precision decimal places compared to the Pine built-in sqrt(). Be forewarned, "MY" sqrt() is technically speaking slower than snail snot compared to the native Pine sqrt(), so I wouldn't advise actually using it religiously in other scripts as a daily habit. It is seemingly doing quite well in combination with these simple calculations without being "sluggish". Lastly, of course you may always just delete the custom sqrt() function, via Pine Editor, and then the script will still operate flawlessly, yet more efficiently.
Features List Includes:
Dark Background - Easily disabled in indicator Settings->Style for "Light" charts or with Pine commenting
AND much, much more... You have the source!
The comments section below is solely just for commenting and other remarks, ideas, compliments, etc... regarding only this indicator, not others. When available time provides itself, I will consider your inquiries, thoughts, and concepts presented below in the comments section, should you have any questions or comments regarding this indicator. When my indicators achieve more prevalent use by TV members, I may implement more ideas when they present themselves as worthy additions. As always, "Like" it if you simply just like it with a proper thumbs up, and also return to my scripts list occasionally for additional postings. Have a profitable future everyone!

Correlation Coefficient {Cybernetwork}Correlation Coefficient (CC): with CC momentum and acceleration oscillators, and momentum-divergence indicator.

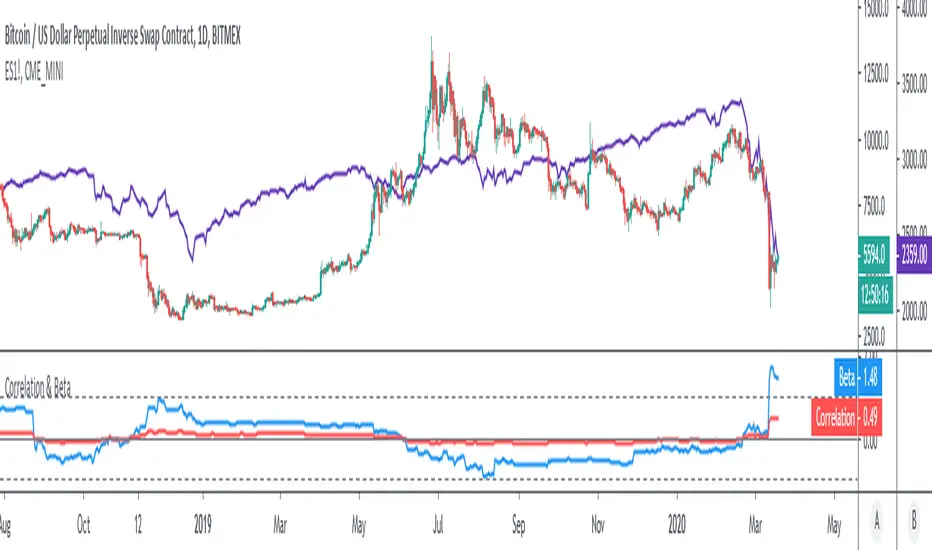
Correlation & BetaDisplay the correlation coefficient and/or Beta of an asset to a specified market.
Options to:
- Specify market (S&P500 futures by default)
- Display one or other metrics
- Modify assessment period (200 bars by default)
- Calculate on price, returns or log-returns
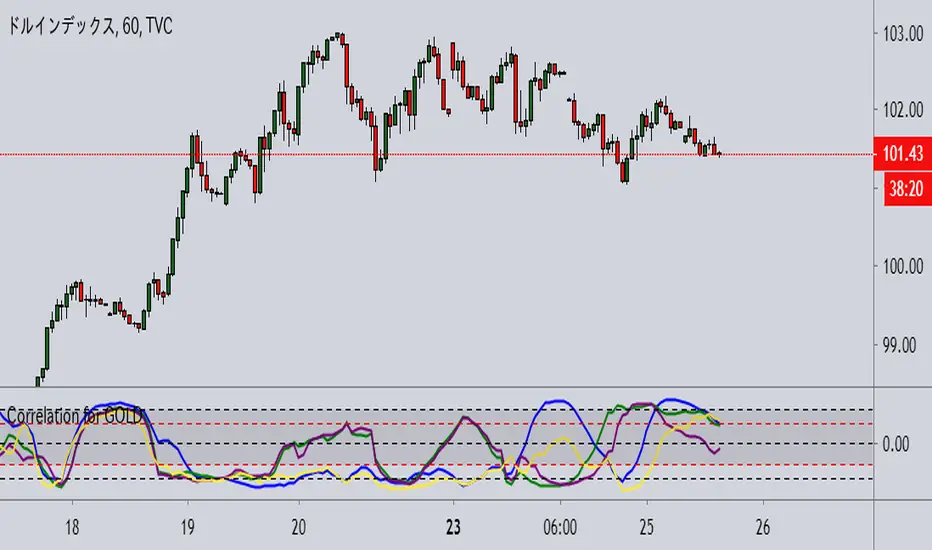
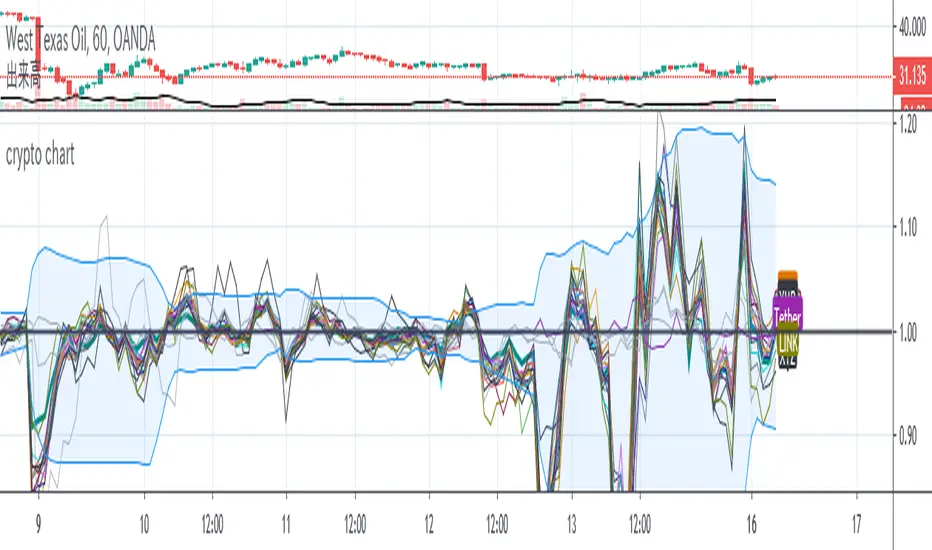
crypto chart BTC is often moved by other brands
This indicator to detect the precedence and enter BTC
Any Security vs. Any Security Change Comparison [BigBitsIO]This script allows you to compare the percentage-based change in the price of any two securities on any given (and supported) timeframe on the chart. This can give you a very simple way to compare any two securities against one another.
Ex: If your base security gained 5%, and the other security gained 3% in a single day, the change comparison would show a green bar of 2% because your base security outgained your other security by 2%.
Features:
- 2 securities to compare. A base and other.
- Shortlist of default securities to choose from.
- Ability to override the default securities list and use any security supported by TradingView. You must use the correct security string to do so.
- Resolution is tied to whatever the current chart is using. This way the view of the indicator always reflects the correct resolution of the chart.
- If either market has a 0% change, it is considered likely closed during that period and will result in a change of 0%, as they shouldn't be compared at that time.

Correlation Tool [QuantNomad]It's a pretty simple indicator that allows you to calculate the stock's correlation directly in TradingView.
You can use up to 5 symbols in this indicator. You can use any timeframe and limit date range for correlation calculation.
It's a pro indicator, you can have access to it for a small fee. Link to my PRO indicators you can find in my signature.
Will be happy to hear your feedback.
- How do you want to use this indicator?
- What other features do you want in it?
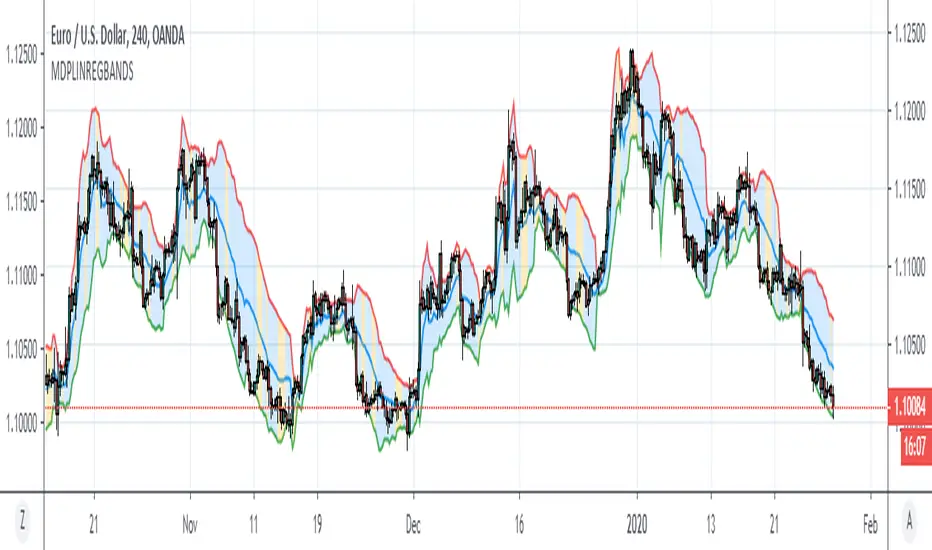
Minkowski Distance Period Linear Regression BandsHello, this script was created by using Linear Regression Bands Function with variable Function Minkowski Distance Adaptive Period.
Function Linear Regression Bands :
Minkowski Distance Function Original Script by RicardoSantos :
Functions saved from overloads . And suitable for mutable variable periods.
Regards.
Functions Allowing Series As Length - PineCoders FAQ█ WARNING
Improvements to the following Pine built-ins have deprecated the vast majority of this publication's functions, as the built-ins now accept "series int" `length` arguments:
ta.wma()
ta.linreg()
ta.variance()
ta.stdev()
ta.correlation()
NOTE
For an EMA function that allows a "series int" argument for `length`, please see `ema2()` in the ta library by TradingView .
█ ORIGINAL DESCRIPTION
Pinescript requires many of its built-in functions to use a simple int as their period length, which entails the period length cannot vary during the script's execution. These functions allow using a series int or series float for their period length, which means it can vary on each bar.
The functions shared in this script include:
Rolling sum: Sum(src,p)
Simple moving average: Sma(src,p)
Rolling variance: Variance(src,p)
Rolling standard deviation: Stdev(src,p)
Rolling covariance: Covariance(x,y,p)
Rolling correlation: Correlation(x,y,p)
If p is a float then it is rounded to the nearest int .
How to Use the Script
Most of the functions in the script are dependent on the Sma function. The Correlation function uses the Covariance and Stdev functions. Be sure you include all the required functions in your script.
Make sure the series you use as the length argument is greater than 0, else the functions will return na . When using a series as length argument, the following error might appear:
Pine cannot determine the referencing length of a series. Try using max_bars_back in the study or strategy function.
This can be frequent if you use barssince(condition) where condition is a relatively rare event. You can fix it by including max_bars_back=5000 in your study declaration statement as follows:
study("Title",overlay=true,max_bars_back=5000)
Example
The chart shows the Sma , Stdev , Covariance and Correlation functions. The Sma uses the closing price as input and bars as period length where:
bars = barssince(change(security(syminfo.tickerid,"D",close ,lookahead=true)))
The Stdev uses the closing price as input and bars + 9 as period length. The Covariance and Correlation use the closing price as x and bar_index as y , with bars + 9 as period length.
Look first. Then leap.

Hashem Correlation CoefficientCorrelation Coefficient
Core Code from: www.tradingview.com
This indicator Show Correlation between the Current Ticker & timeframe and a Customizable Ticker. After adding the indicator you can change the second ticker in the settings.
The Correlation Coeff is between -1 to 1 which 1 means 100% correlation and -1 means -100% correlation ( Inverse Correlation ).
The color of the area changes when:
Blue : CC > 0.5
Aqua : CC > 0.75
Purple : CC < -0.5
Red : CC < -0.75
correlation_between_two_symbolsCorrelation between two symbols.
Notice: you can find more useful indicators by searching 'between_two_symbols'
Function : Multiple Correlation
This script was written to calculate the correlation coefficient (Adjusted R-Squared) for one dependent and two independent variables.(3-way)
Pearson correlation method was used with exponential moving averages as the correlation calculation method.
Use your source ( i use "close" generally ) as the dependent variable.
Inspired by this article : www.real-statistics.com
The Adjusted R-Squared coefficient is used as output, but the R-Squared coefficient is also available in the code.
Adjusted R-Squared is often used for multiple correlations.
It also gives better results in large samples.
Here is the article about the difference of the two coefficients : www.investopedia.com
I wrote this function to increase the efficiency of my Dow Factor I used before.
When my research is over, I will apply the 3-factor correlation to my scripts.
I hope that I will achieve more efficient indicators and oscillators and even strategies.
In this command, I gave a few variable values and plotted them as an example.
I hope this function is useful in your work.
Finally, you can use periods as mutable variables.
The function is recovered from integer loads.
Best regards. Noldo

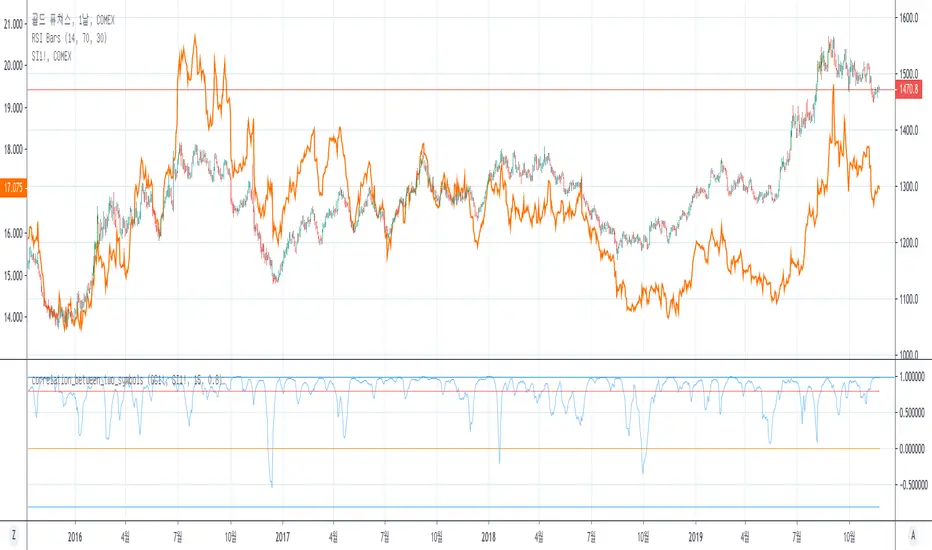
Dow Factor Relative Strength IndexThis script was written to create a new, rapid relative strength index inspired by the Dow Theory.
More info about Dow Theory : www.investopedia.com
According to the Dow Theory, volume should confirm market trends.
The correlation coefficient between prices and volume is negative in weakening trends and negative trends , positive in strengthening or positive trends.a factor was formed based on the correlation coefficient between volume and prices.
This factor was added to the relative strength index.
Period 5 is selected because the volume is very volatile and can be slow.
You can use the period you want, but I recommend the period as a minimum of 5.
It is suitable for all instruments and timeframes and thanks to its design, it provides control over gradual buying and selling points.
I haven't fully tested it, it's open to updates. For now, just use it to create ideas.
If I find it necessary,
I'll update after the tests.
If you have suggestions on these issues,
Leave your comments in the comment window.
This code is open source under the MIT license. If you have any improvements or corrections to suggest, please send me a pull request via the github repository github.com
Stay tuned , best regards.
Multistep AutocorrelationAutocorrelation, also known as serial correlation, is the correlation of a signal with a delayed copy of itself as a function of delay. Informally, it is the similarity between observations as a function of the time lag between them. The analysis of autocorrelation is a mathematical tool for finding repeating patterns, such as the presence of a periodic signal obscured by noise, or identifying the missing fundamental frequency in a signal implied by its harmonic frequencies. It is often used in signal processing for analyzing functions or series of values, such as time domain signals.
This multistep autocorrelation function calculates the correlation of roc (rate of change) between an asset at t and t-1 as well as the correlation of the same asset at t and t-4. The output is an average of the two.
If both outputs show a positive correlation, the color will be green.
If only one shows a positive correlation, the color will be yellow.
If neither show a positive correlation, the color will be red.
This indicator can be useful as a filter for strategy entry logic (only enter on strong correlation and the strategy entry condition), or as standalone confirmation of strength in a specific direction. It can also be used to filter chop.
Another potential usecase would be as a variable in regression applications.
Enjoy!

Function : Linear Regression Bands
Used with Pearson Correlation. It can be used to make sense of the trends. Very successful results can be obtained with a MACD style indicator and volume indicator that gives Buy and Sell orders.Open for adaptive and mutable variable periods of moving averages. Best regards!

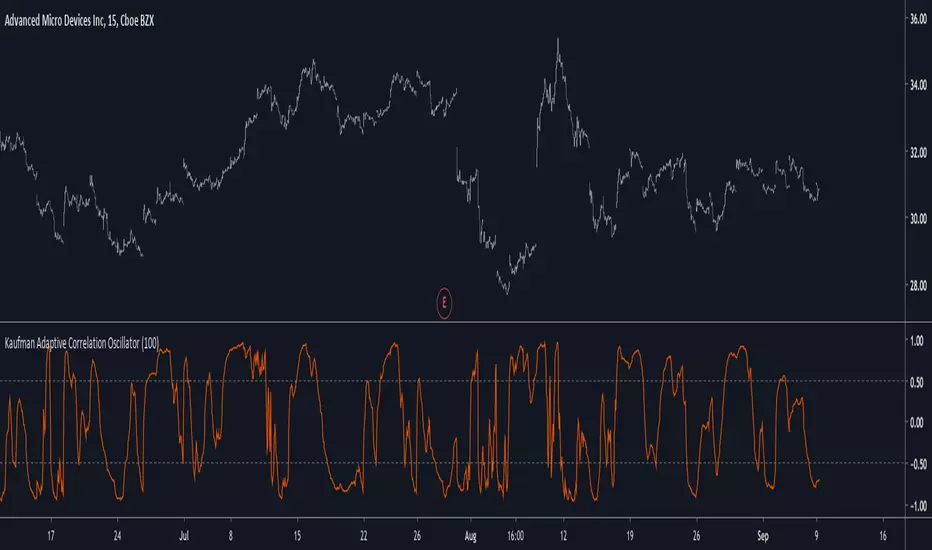
Kaufman Adaptive Correlation OscillatorIntroduction
The correlation oscillator is a technical indicator that measure the linear relationship between the market closing price and a simple increasing line, the indicator is in a (-1,1) range and rise when price is up-trending and fall when price is down-trending. Another characteristic of the indicator is its inherent smoothing which provide a noise free (to some extent) oscillator.
Such indicator use simple moving averages as well as estimates of the standard deviation for its calculation, but we can easily make it adaptive, this is why i propose this new technical indicator that create an adaptive correlation oscillator based on the Kaufman adaptive moving average.
The Indicator
The length parameter control the period window of the moving average, larger periods return smoother results while having a low kurtosis, which mean that values will remain around 1 or -1 a longer period of time. Pre-filtering apply a Kaufman adaptive moving average to the input, which allow for a smoother output.
No pre-filtering in orange, pre-filtering in yellow, period = 100 for both oscillators.
If you are not aware of the Kaufman adaptive moving average, such moving average return more reactive results when price is trending and smoother results when price is ranging, this also apply for the proposed indicator.
Conclusion
Classical correlation coefficients could use this approach, therefore the linear relationships between any variables could be measured. The fact that the indicator is adaptive add a certain potential, however such combination make the indicator have the drawback of kama + the correlation oscillator, which might appear at certain points.
Thanks for reading !
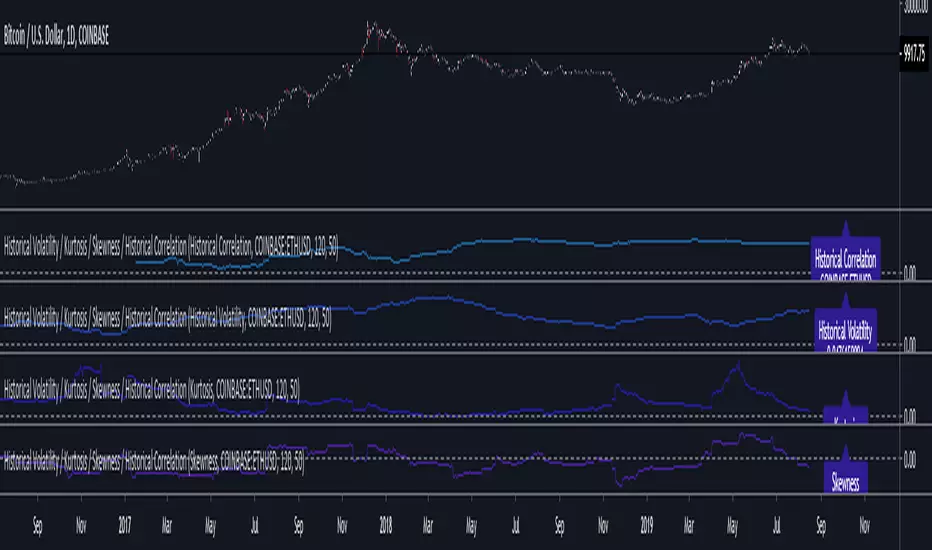
Volatility / Kurtosis / Skewness / CorrelationCalculations for Historical Volatility, Kurtosis, Skewness and Historical Correlation between two assets.
--------------------------------------
If you find it useful please consider a tip/donation :
BTC - 3BMEXEDyWJ58eXUEALYPadbn1wwWKmf6sA
--------------------------------------