Daily Buy/Sell Volumeindicator that The Daily Buy/Sell Volume Indicator is a custom-built tool that helps traders track and visualize the buying and selling volumes throughout a trading day. This indicator separates the total volume into two categories:
1. Buy Volume: Calculated when the closing price is higher than the opening price for a given candle. This represents the volume of bullish (buy) activity for the day.
2. Sell Volume: Calculated when the closing price is lower than the opening price for a given candle. This represents the volume of bearish (sell) activity for the day.
Key Features:
• Buy/Sell Volume Calculation: The indicator tracks the buying and selling volumes based on the relationship between the open and close prices of each candle.
• Daily Reset: The indicator resets at the start of each trading day, providing fresh calculations for the daily buy and sell volumes.
• Visual Representation: The buy volume is shown with a green line, while the sell volume is displayed with a red line, making it easy to identify bullish and bearish activity over the course of the day.
Cumulative Volume Index (CVI)

CVD OscillatorCVD Delta Oscillator
A momentum oscillator that measures buying and selling pressure through volume analysis, based on the principle that volume precedes price (cause and effect).
How It Works
Volume Analysis
Measures the force of buying and selling by analyzing how volume interacts with price movement within each bar
When price closes higher in a bar's range with strong volume, this indicates stronger buying pressure
When price closes lower in a bar's range with strong volume, this indicates stronger selling pressure
Momentum Measurement
Uses two EMAs (fast and slow) to smooth the volume delta
The difference between these EMAs creates an oscillator that shows:
Rising values = Buying pressure increasing
Falling values = Selling pressure increasing
Zero line crossovers = Potential shift in control between buyers and sellers
Signal Generation
Divergences
Bullish: Price falls to new lows while buying pressure increases (potential reversal up)
Bearish: Price rises to new highs while selling pressure increases (potential reversal down)
Zero-Line Crossovers
Bullish: Buying pressure overtakes selling pressure
Bearish: Selling pressure overtakes buying pressure
Practical Application
Reading the Indicator
Green columns above zero = Net buying pressure
Red columns below zero = Net selling pressure
Larger columns = Stronger pressure
Divergences and crossovers = Potential turning points
Trading Context
Helps identify when price movement has strong or weak volume support
Shows potential exhaustion points through divergences
Confirms trend changes through zero-line crossovers
Customization
Adjustable EMA periods for different trading styles
Toggle-able visual signals
Automatic alerts for all signals

Daily Volume Metrics BoxDaily Volume Metrics Box
A powerful tool for monitoring intraday trading metrics in real-time. This indicator provides a clean, customizable display of key market statistics that reset daily.
🔑 Key Features:
- Daily Volume Distribution - Track positive and negative volume separately
- Net Volume Analysis - Monitor the balance of buying vs selling volume
- Average Candle Size - Dynamic calculation of recent price movement magnitude
- Flexible Positioning - Place the metrics box in any corner of your chart
- Auto-Reset - All metrics automatically reset at the start of each trading day
- Current Date Display - Always know which day's data you're viewing
📊 Metrics Explained:
1. Avg Size: Average candle size over your specified lookback period
2. Pos Vol: Accumulated volume from up-moves during the current day
3. Neg Vol: Accumulated volume from down-moves during the current day
4. Net Vol: The difference between positive and negative volume (Pos Vol - Neg Vol)
⚙️ Customization Options:
- Number of candles for average (1-∞)
- Background color and transparency
- Text color
- Box position (Top/Bottom, Left/Right)
- Distance from chart edge (1-5 bars)
📌 Usage Tips:
- Use larger lookback periods for more stable average candle size
- Position the box where it won't interfere with your chart analysis
- Monitor net volume for potential trend strength confirmation
- Compare positive and negative volume for insight into price momentum
🔄 Daily Reset:
All volume metrics reset at the start of each trading day, ensuring you're always looking at current day data only.
Perfect for day traders, swing traders, and anyone who wants to monitor intraday market dynamics with clean, organized metrics.
Note: This indicator works best on intraday timeframes where volume data is available.

Order Flow / Delta Volume IndicatorOrder Flow / Delta Volume Indicator
The Order Flow / Delta Volume Indicator is designed to give traders a comprehensive view of market activity by combining delta volume analysis, order flow imbalances, and momentum filters. This indicator is not just a mashup of components, but a carefully crafted tool that enhances decision-making by integrating various layers of market analysis into one powerful system.
How the Components Work Together:
1. Delta Volume Bars: The core of this indicator, delta volume shows the difference between buy and sell orders, allowing traders to see real-time shifts in market sentiment. Green bars indicate buy-side pressure, while red bars show sell-side dominance. By visualizing this in bar form, traders can easily spot significant shifts in order flow that could signal trend changes or momentum shifts.
2. Cumulative Delta Line (Rescaled): The cumulative delta is rescaled to plot under the price candles, giving traders a clear, contextualized view of how net buyer or seller dominance is developing over time. This line helps identify potential market reversals when price moves diverge from cumulative delta trends.
3. Order Flow Imbalance Detection: Imbalances in buy and sell volumes are automatically detected using a threshold, ensuring that traders are alerted to significant market moves. These imbalances provide insight into aggressive buying or selling behavior, which is crucial for identifying points of high trading activity or potential breakout/reversal zones.
4. VWAP Filter: Volume Weighted Average Price (VWAP) is included as a filter to confirm trend direction. The VWAP ensures that buy signals are only triggered when price action is above the VWAP (indicating strength), and sell signals are triggered when price is below the VWAP (indicating weakness). This ensures that signals are not just based on volume, but also on where price is relative to a critical benchmark.
5. RSI Filter: The inclusion of the Relative Strength Index (RSI) adds a momentum check to the signals. By using RSI, traders can avoid taking trades during low-momentum periods, ensuring they only act when market conditions favor a stronger move.
6. Signal Cooldown Feature: To avoid clutter and noise from frequent signals, this indicator includes a cooldown period between signals, ensuring that traders don’t receive excessive alerts in a short timeframe. This feature prevents overtrading and helps focus on high-quality signals.
Why This Combination is Useful:
• Comprehensive Market Insight: By combining delta volume analysis with order flow imbalance detection, this indicator provides a deep understanding of market sentiment, showing not only price movement but the underlying volume dynamics driving those moves.
• Signal Accuracy: The VWAP and RSI filters ensure that signals are only generated in strong market conditions, filtering out weak or false signals that often occur in choppy markets.
• Divergence Detection: The cumulative delta line provides traders with a tool for spotting divergences between price action and underlying volume, allowing for earlier detection of potential reversals.
This indicator is more than a simple combination of existing tools—it’s a strategic fusion of volume analysis, order flow, and momentum filters designed to provide traders with a clearer view of market activity and to generate more reliable buy/sell signals.
This description explains how the components work together and highlights the indicator’s usefulness, which should address TradingView’s concerns about originality and purpose.

Cumulative Volume Delta Divergence [TradingFinder] Periodic EMA🔵 Introduction
The Cumulative Volume Delta (CVD) is a powerful tool in technical analysis that is derived from market volume or trading activity. The Cumulative Volume Delta Divergence Detector Indicator helps traders identify Cumulative Volume Delta Divergences (CVD Divergence), which can provide reliable trading signals.
These divergences, such as bullish and bearish CVD divergences, act as key indicators of potential trend reversals in financial markets. By analyzing CVD divergences, traders can gain insights into the strength of buying and selling pressure and make more informed predictions about price trends.
The CVD indicator is particularly effective for traders who engage in day trading and scalping, as it helps identify price reversal points by analyzing volume and price behavior.
Using the CVD indicator in combination with other technical tools such as support and resistance levels and candlestick patterns allows for a more accurate market analysis.
🔵 How to Use
Divergences are one of the most important technical analysis signals that indicate the current strength of a price move may not be sustainable.
Cumulative Volume Delta Divergence helps traders identify potential trading opportunities that may not be visible on the price chart alone.
This type of divergence examines the relationship between buying and selling volume and price, enabling traders to better understand price trends.
🟣 Bullish CVD Divergence
A bullish CVD divergence occurs when the price makes a lower low, but the CVD indicator shows a higher low. This indicates increasing buying pressure in the market, even though the price is declining. In other words, despite the price dropping, buyers are gradually gaining strength, which could signal a price reversal and the start of a bullish trend.
How to use this signal : In this scenario, traders looking to go long can use this signal as a favorable opportunity to enter the market. After a bullish divergence, the market typically tends to move upward.
To reduce risk, traders can wait for further confirmation from the price chart. For example, if the price breaks through the previous high after the divergence or breaks a resistance level, this could be a more reliable signal for entering the market.
🟣 Bearish CVD Divergence
A bearish CVD divergence is the opposite of a bullish divergence. In this type of divergence, the price makes a higher high, but the CVD indicator shows a lower high. This indicates decreasing buying pressure and weakening momentum in the current bullish trend. A bearish divergence often serves as a warning of a potential market reversal to the downside.
How to use this signal : Traders can use this divergence as an opportunity to exit long positions or enter short positions. When the CVD indicator makes a lower high compared to the price, it signals weakness in buyer strength.
If traders receive further confirmation from the price chart, such as a break of key support levels or an increase in selling volume, this can serve as a stronger signal for the beginning of a bearish trend.
🟣 How to Build a Trading Strategy with Cumulative Volume Delta Divergence
Using CVD divergence alone may not be sufficient. Traders should combine this tool with other technical analysis techniques and indicators to have more confidence in their decisions. For example, when observing a CVD divergence, traders can also analyze volume, trend lines, or candlestick patterns to get a more accurate market analysis.
Additionally, risk management should always be a priority. Using stop-loss orders and properly sizing trades can help traders minimize their losses if they make a mistake.
🔵 Setting
Divergence Fractal Period : Determines the period of swings. The minimum and default value is 2.
CVD Period : You can set the period of " Periodic " and " EMA " modes.
Cumulative Mode : It has three modes "Periodic" and "EMA". In "Periodic" mode, it accumulates the volume periodically and in "EMA" mode, it calculates the moving average of the volume.
Market Ultra Data : If you turn on this feature, 26 large brokers will be included in the calculation of the trading volume. The advantage of this capability is to have more reliable volume data. You should be careful to specify the market you are in, FOREX brokers and Crypto brokers are different.
🔵 Conclusion
The Cumulative Volume Delta (CVD) indicator is a powerful tool in technical analysis, helping traders better identify price trends and make more accurate market predictions. By identifying CVD divergences, traders can anticipate price reversals and time their market entries and exits accordingly.
Bullish and bearish CVD divergences each provide valuable signals that can help traders identify the best entry and exit points in the market. A bullish CVD divergence signals strength in buying that will likely lead to a price increase, while a bearish CVD divergence indicates weakness in the bullish trend and the potential for the beginning of a bearish trend.
Overall, combining CVD with other technical analysis tools and employing risk management strategies can help traders make better trading decisions and capitalize on available market opportunities.

PATTERNPULSE / Stttrading F.VelazquezPATTERNPULSE
Discover a powerful tool for market analysis with the Velas Engulfing + RSI Indicator. Crafted by Stttrading Franco Velazquez, this indicator seamlessly blends engulfing candle patterns with the precision of the RSI filter. What sets it apart is its unique approach – signals are exclusively generated when the RSI reaches overbought or oversold conditions, providing a distinctive edge over conventional engulfing candle indicators.
Key Features :
Engulfing Candle Patterns: Identify both bullish and bearish engulfing candle formations.
RSI Integration: Harness the strength of the RSI indicator to evaluate market momentum and potential reversals.
Visual Signals: Enjoy clear and intuitive signals directly on your chart for seamless decision-making.
Configurable Alerts: Tailor the indicator to your preferences with customizable alerts for timely notifications.
Usage Instructions:
Engulfing Candles:
Visualize bullish and bearish candles through green and red triangles, respectively.
Capitalize on buying opportunities when bullish candles emerge and consider selling when bearish candles unfold.
RSI Indicator:
Leverage the RSI indicator to gauge overbought and oversold market conditions.
Fine-tune RSI levels based on your trading strategy and risk tolerance.
Alert System:
Set up alerts to stay informed about crucial market movements, ensuring you never miss a trading opportunity.
Custom Configuration:
RSI Source: Customize the data source for RSI calculations to suit your analysis.
RSI Length: Define the length of the RSI period for precise adjustments.
RSI Overbought and Oversold Levels: Tailor the overbought and oversold RSI thresholds to align with your trading preferences.
Important Note: Always conduct thorough analysis and implement proper risk management before executing trades.
Volume Profile in PatternPulse:
In the paid version of the PatternPulse indicator, an advanced Volume Profile tool is included, offering a detailed view of how volume is distributed across different price levels over a specific period. Here's how it works:
Show Volume Profile: You can toggle the display of the volume profile on the chart using the Show VP option.
Depth and Number of Bars Configuration: The tool allows you to adjust the Volume Profile Lookback Depth, which defines how many periods back will be analyzed to calculate the volume profile. You can also set the number of bars (VP Number of Bars) to be displayed on the chart, as well as the bar length and width to customize its appearance.
Delta Type: You can choose from different delta types for the volume profile: Bullish, Bearish, or Both. This enables you to focus on volumes associated with bullish price movements, bearish movements, or both.
Point of Control (POC): The tool also offers an option to extend the Point of Control (POC) line on the volume profile. The POC represents the price level with the highest traded volume during the analyzed period.
Customizable Colors: You can customize the colors of the volume profile bars and the Point of Control (POC) to match your visual preferences.
How to Use It:
The volume profile helps identify price levels where significant volume has been traded, which can be crucial for determining key support and resistance levels in the market. Adjust the parameters to fit your needs for a clear and precise visualization that supports your technical analysis.
Info Box in PatternPulse
In the paid version of PatternPulse, you'll find an info box that provides a comprehensive view of various market aspects. Here's how it works:
General Information: At the top of the info box, you'll see the title "PATTERNPULSEVIP® Info. BOX" in grey with orange text. This title helps you identify that you are viewing the information section.
CCL Dollar: The info box displays the value of the CCL (Contado con Liquidación) dollar for Argentina, which is an important reference for investors in that market.
Indices and Metals: This section includes information on the US Dollar Index (DXY), the Euro Index (EXY), as well as the prices of gold and silver.
Crypto Dominance: Here, you'll see the dominance of Bitcoin (BTC) and Ethereum (ETH) in the cryptocurrency market, helping you understand the influence of these cryptocurrencies on the global market.
MACD: The info box shows the current MACD (Moving Average Convergence Divergence) trend. The trend can be bullish or bearish, providing additional insight into market direction.
RSI: The current RSI (Relative Strength Index) value is also displayed. If the RSI indicates overbought conditions (above 75), the info box will turn teal with white text. If it indicates oversold conditions (below 25), the info box will turn maroon with white text.
Customization: You can adjust the horizontal offset of the info box from the chart and change the style and color of the text to suit your visual preferences.
This info box provides key data at a glance, making it easier to make informed decisions in your technical analysis. Adjust the settings according to your needs to get the most relevant information for your trading strategy.
Bollinger Bands in PatternPulse
In the paid version of PatternPulse, we’ve added the Bollinger Bands (BB) indicator to help you analyze market volatility and trends. Here’s a breakdown of how to use it:
1. Display Options:
Show BB: You can toggle the visibility of the Bollinger Bands on your chart using the "Show BB" option.
2. Configuration:
Length: Adjust the length of the moving average used to calculate the Bollinger Bands. The default is set to 20 periods, but you can modify it to fit your trading strategy.
Source: Choose the data source for the Bollinger Bands calculation, with the default being the closing price.
Standard Deviation: Set the number of standard deviations away from the moving average for the upper and lower bands. The default is 2.0, which is commonly used.
3. Plotting:
Basis: The middle line (basis) of the Bollinger Bands is plotted, which is a simple moving average (SMA) of the specified length.
Upper and Lower Bands: The upper and lower bands are plotted based on the standard deviation from the basis line.
Offset: Adjust the horizontal position of the bands on your chart to better align with your analysis needs.
4. Visualization:
Color: The Bollinger Bands and their background fill are color-coded for easy interpretation. The default colors are shades of blue, but you can customize them if needed.
These Bollinger Bands will help you to visualize price volatility and identify potential market opportunities based on how the price interacts with these bands. Adjust the settings according to your trading preferences to get the most out of this feature.
Parabolic SAR in PatternPulse
In the advanced version of PatternPulse, we've added the Parabolic SAR (PSAR) to help you identify potential trend changes in the market. Here's how this tool works:
1. Activating the Indicator:
Show PSAR: You can toggle the visibility of the Parabolic SAR using the "Show PSAR" option. This controls whether the indicator is displayed on your chart.
2. PSAR Settings:
Start: Adjust the initial value for the PSAR calculation. This value sets the starting point for the acceleration of the indicator.
Increment: Defines the rate at which the PSAR increases. This value increases the acceleration parameter with each new high or low.
Maximum Value: Sets the upper limit for the acceleration parameter. This prevents the indicator from moving too quickly in high-volatility conditions.
3. Visualization:
Color of the Dots: The PSAR dots are displayed in teal if the indicator is below the closing price, indicating a bullish trend. They are shown in maroon if the indicator is above the closing price, indicating a bearish trend.
How to Use It: The Parabolic SAR is useful for identifying potential reversal points in the market. When the indicator switches position relative to the price, it can signal a potential trend change. Use this indicator in conjunction with other analysis tools to make more informed trading decisions.
User Explanation EMAs
This part of the indicator utilizes Exponential Moving Averages (EMAs) to help you identify trends and potential entry or exit points in the market. Here’s how they work and how you can customize them:
What are EMAs?
Exponential Moving Averages (EMAs) are indicators that smooth out historical prices to identify the direction of the trend. Unlike Simple Moving Averages, EMAs give more weight to recent prices, making them more responsive to current price changes.
How Each EMA Works:
1° EMA (Adjustable Length):
Purpose: The first EMA provides a short-term view and can help identify recent movements and potential quick trend changes.
Customization: You can adjust the length of this EMA (number of periods) using the "1° EMA length" option.
2° EMA (Adjustable Length):
Purpose: The second EMA acts as a smoother filter, helping to confirm or discredit signals from the first EMA.
Customization: Adjust its length with "2° EMA length".
3° EMA (Adjustable Length):
Purpose: The third EMA provides a longer-term view, helping to identify mid-term trends and significant turning points.
Customization: Modify its length via "3° EMA length".
4° EMA (Adjustable Length):
Purpose: The fourth EMA represents the long-term trend, offering a perspective on the market’s overall direction.
Customization: Change its length using "4° EMA length".
Customizable Colors:
You can choose the colors for each EMA through the provided color options. This allows you to distinguish each EMA on your chart easily and customize its appearance according to your preferences.
EMA Crosses:
Small Crosses (1° and 2° EMAs):
Functionality: When the 1° EMA crosses above the 2° EMA, it may signal a buy (bullish cross). When it crosses below, it may signal a sell (bearish cross).
Visualization: You can enable or disable the display of these small crosses.
Large Crosses (3° and 4° EMAs):
Functionality: Crosses between the 3° and 4° EMAs help identify more significant trend changes. A bullish cross may indicate an uptrend, while a bearish cross may signal a downtrend.
Visualization: You can also enable or disable these large crosses on your chart.
How to Use This Information:
Trend Identification: EMAs help you see whether the market is in an uptrend or downtrend, and crosses between them can indicate potential trading opportunities.
Entry/Exit Signals: Crosses between EMAs can signal optimal times to enter or exit a position.
This set of EMAs provides you with a clear view of different time frames in the market, allowing you to make more informed trading decisions based on the current trend and price changes.
Support and Resistance
Support and Resistance levels are essential tools in technical analysis, helping traders identify key price levels where the market might reverse or pause. This feature of the indicator provides visual markers for these levels and tracks how the price interacts with them.
Parameters:
Lookback Range: Defines the number of bars to look back when identifying pivot points. A larger value considers more historical data.
Bars Since Breakout: Determines how many bars should have passed since a breakout to detect a potential retest.
Retest Detection Limiter: Limits the number of bars actively checked for confirming a retest after a breakout.
Breakouts and Retests: Options to enable or disable detection for breakouts and retests.
Repainting: Controls how the indicator updates based on different criteria such as candle confirmation or high/low values. This affects how often and in what way the indicator adjusts its markings.
Pivot Points:
Pivot Low and High: The indicator identifies key support (pivot lows) and resistance (pivot highs) points based on the historical price action within the defined lookback range.
Boxes and Labels:
Drawing Boxes: Visual boxes are drawn to represent support and resistance levels. These boxes adjust dynamically with price changes and can extend based on user settings.
Breakout Labels: Labels are created when a breakout occurs, marking the point where the price crosses these support or resistance levels.
Retest Labels: When a potential retest is detected, the indicator can label it to signal areas where the price might test the broken support or resistance.
Customization Options:
Box and Label Styling: Users can customize the style, color, and size of the boxes and labels representing support and resistance.
Text Color Override: Option to change the color of text labels independently from the default color settings.
Key Benefits:
Visual Clarity: Easily identify important levels on the chart.
Dynamic Updates: Levels adjust as new price data comes in, providing relevant and up-to-date information.
Customization: Tailor the appearance and behavior of the support and resistance markings to fit your trading style.
This feature enhances your chart analysis by clearly marking critical levels and events, making it easier to spot potential trading opportunities.
Explanation of the Simple Moving Averages (SMA) Functionality
Simple Moving Averages (SMAs) are technical analysis tools used to smooth out price data and identify market trends. This part of the code allows you to add two SMAs to the chart with customizable settings.
Configuration Parameters:
Show SMA 1 and SMA 2: Enables or disables the display of each moving average. You can choose to show SMA 1, SMA 2, or both on your chart.
SMA Length: Defines the number of periods used to calculate each SMA. For example, a length of 14 for SMA 1 and 50 for SMA 2. A longer length smooths the line more, while a shorter length follows price movements more closely.
SMA Source: Sets which price data (e.g., closing price) is used to calculate the SMA.
Color and Width of SMA: Allows you to customize the color and width of each SMA line to fit your visual preference or to clearly distinguish between different SMAs on the chart.
SMA Style: Provides options to change the line style of the SMA to solid, dashed, or dotted, so you can personalize the appearance according to your analysis style.
SMA Calculation:
Calculation: The SMA is calculated by averaging the closing prices (or selected source) over the specified number of periods. This helps to smooth out daily price fluctuations and reveals the overall trend.
Visualization:
Plot for SMA 1 and SMA 2: Draws the SMA lines on the chart according to the specified settings. If you choose to hide an SMA, it will not appear on the chart.
Line Style: The line is drawn according to the selected style (solid, dashed, or dotted), and you can adjust the thickness and color to suit your visual needs.
Key Benefits:
Trend Clarity: SMAs help smooth out price movement and allow you to see the general trend in the market.
Customization: You can adjust the length, color, thickness, and style of the lines to fit your analysis and visual preferences.
Facilitates Analysis: SMAs can be used to identify crossings and important trading signals, such as when a short-term SMA crosses above or below a longer-term SMA.
This functionality provides you with powerful tools to adjust and customize how moving averages are presented on your charts, making it easier to identify trends and signals in the market.
Thank you for exploring the features of our indicator! We hope you find the customization options and tools provided, including the Simple Moving Averages, valuable for your trading analysis. If you have any questions or need further assistance, please feel free to reach out.
We invite you to try out the complete PatternPulse indicator to experience its full range of functionalities and see how it can enhance your trading strategies. Your feedback is always appreciated!
Happy trading!

Cumulative Delta [TradingFinder] Volume + Periodic + EMA🔵 Introduction
To fully grasp the concept of Cumulative Volume Delta (CVD), it's essential first to understand Volume Delta. In trading and technical analysis, the term "Delta" typically refers to the difference between two values or the rate of change between two data points.
Volume Delta represents the difference between buying and selling pressure, calculated for each candlestick on a chart. This difference can vary across different timeframes.
A positive delta indicates that buying volume exceeds selling volume, while a negative delta shows that selling volume is greater. When buying and selling volumes are equal, the volume delta equals zero.
🟣 What is Cumulative Volume Delta (CVD)?
Cumulative Volume Delta (CVD) is a powerful tool in technical analysis that aggregates delta values for each candlestick, creating a comprehensive indicator that helps traders assess market trends.
Unlike the standard Volume Delta, which compares delta on a candle-by-candle basis, CVD provides insight into the overall buying and selling pressure during key market swings. A downward-trending CVD suggests that selling pressure is dominating, which is typically a bearish signal.
Conversely, an upward-trending CVD indicates bullish sentiment. This analysis becomes even more significant when comparing CVD with price action and market structure, helping traders to predict asset price directions.
By evaluating market highs and lows, one can determine the market trend. A consistent rise in these points indicates an uptrend, while a consistent fall suggests a downtrend.
🔵 How to Use
Understanding how to detect trend changes using Cumulative Volume Delta is crucial for traders. Typically, CVD aligns with market structure, moving in the same direction as price trends.
However, divergences between CVD and price trends or signs of exhaustion in volume can be powerful indicators of potential market reversals. Recognizing these patterns can help traders make informed decisions and improve their trading strategies.
🟣 Identifying Trend Exhaustion with Cumulative Volume Delta (CVD)
The Cumulative Volume Delta (CVD) indicator is especially effective in identifying weakening trends in the market. For instance, if gold's price hits a new low, but CVD does not follow suit, this may indicate a lack of seller interest despite the new low, signaling potential seller exhaustion.
Most traders interpret this as a possible reversal from a bearish to a bullish trend. Similarly, if gold reaches a new high but CVD fails to do the same, it can suggest that buyers lack the strength to push the market higher, indicating a possible trend reversal.
🟣 Utilizing Cumulative Volume Delta (CVD) Divergence in Price Trend Analysis
Another effective use of CVD is identifying divergences in price trends. For example, if CVD breaks a previous high or low while the price remains stable, this divergence often indicates that buying or selling pressure is being absorbed.
For instance, if CVD rises sharply without a corresponding increase in gold prices, it may suggest that sellers are absorbing the buying pressure, potentially leading to a strong sell-off. Conversely, if gold prices remain stable while CVD declines, it could indicate that buyers are absorbing selling pressure, likely leading to a price increase once selling subsides.
🔵 Setting
Cumulative Mode : It has three modes "Total", "Periodic" and "EMA". In "Total" mode, it collects the volume from the beginning to the end. In "Periodic" mode, it accumulates the volume periodically and in "EMA" mode, it calculates the moving average of the volume.
Period : You can set the period of " Periodic " and " EMA " modes.
Market Ultra Data : If you turn on this feature, 26 large brokers will be included in the calculation of the trading volume.
The advantage of this capability is to have more reliable volume data. You should be careful to specify the market you are in, FOREX brokers and Crypto brokers are different.
🔵 Conclusion
Cumulative Volume Delta (CVD) is a powerful analytical tool in financial markets that helps analysts and traders assess buying and selling pressure by aggregating and combining the volume delta for each candlestick.
CVD can indicate the strength or weakness of a market trend. When CVD moves upward, it signals that buying pressure is dominant and is considered a bullish signal; conversely, a downward movement in CVD indicates that selling pressure is stronger and is viewed as a bearish signal.
This indicator is particularly effective in identifying divergences and exhaustion in market trends. For example, if CVD does not align with price movements, it may suggest a potential trend reversal.
Traders use this information to make more informed trading decisions, especially when identifying entry and exit points in the market.
Overall, CVD is a tool that enables analysts to better understand market fluctuations and more accurately predict future market trends.

MVRV Ratio - R.BonaldiMVRV Ratio Indicator
The MVRV Ratio Indicator is a powerful tool for cryptocurrency traders and investors. It provides a visual representation of the Market Value to Realized Value ratio, helping you assess whether a cryptocurrency is overvalued or undervalued.
What is the MVRV Ratio?
Market Value: The current market price of the cryptocurrency multiplied by its circulating supply.
Realized Value: The average price at which each unit of the cryptocurrency was last moved on the blockchain, providing a more realistic view of its actual value.
How to Use This Indicator:
Identify Critical Levels:
The indicator displays a blue line representing the MVRV Ratio.
Horizontal lines at levels 1 (red) and 3 (green) help you quickly see significant thresholds.
When the blue line is below the red line (MVRV < 1), the cryptocurrency is considered undervalued.
When the blue line is above the green line (MVRV > 3), the cryptocurrency is considered overvalued.
Visual Cues:
The background turns red when the MVRV Ratio is below 1, indicating potential buying opportunities.
The background turns green when the MVRV Ratio is above 3, signaling potential selling opportunities.
Why Use the MVRV Ratio?
Risk Management: By identifying overvalued and undervalued conditions, you can make more informed decisions, reducing the risk of buying high and selling low.
Market Sentiment: The MVRV Ratio provides insight into market sentiment, helping you gauge the overall mood and potential future movements.
Timing: Use the indicator to time your entries and exits more effectively, aligning your trades with the underlying value of the cryptocurrency.
Whether you're a long-term investor looking to accumulate during undervalued periods or a short-term trader aiming to capitalize on overvalued spikes, the MVRV Ratio Indicator offers a clear and concise way to enhance your trading strategy.

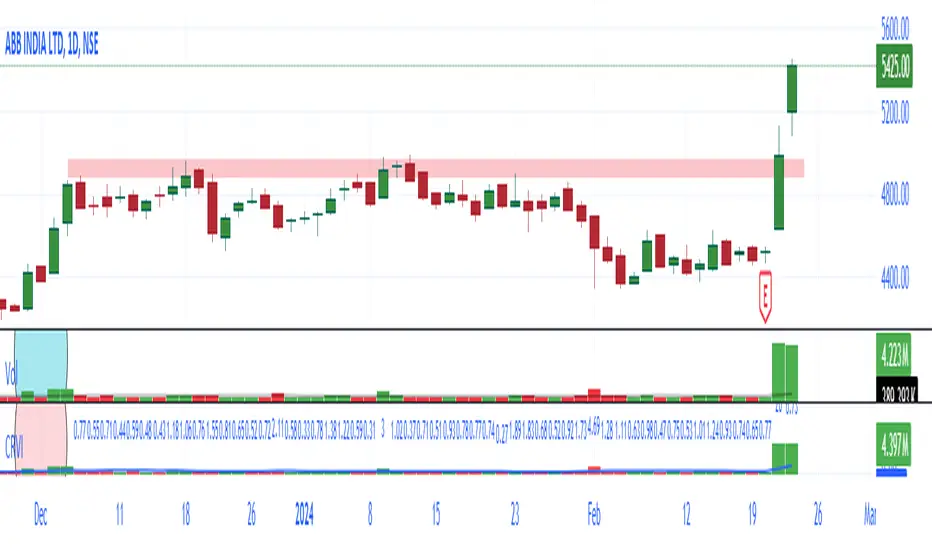
NSE + BSE Volume with Relative Volume Multiplier By AfnanIntroducing the Combined NSE + BSE Volume Indicator with Relative Volume indicator (CRVI).
The Combined NSE + BSE Volume Indicator with Relative Volume Multiplier (CRVI) is an essential tool for Indian traders who are engaged in volume breakout analysis, particularly breakout traders.
Key Features of CRVI:
Combining NSE and BSE Volume: The CRVI consolidates volume data from both the National Stock Exchange (NSE) and the Bombay Stock Exchange (BSE) into a single chart, ensuring that traders do not miss out on vital volume data from either exchange.
Understanding Operator Activity: This indicator gives traders the advantage of identifying whether operators or smart investors are building positions in either exchange. For instance, while observing an NSE stock chart, traders can now identify if operators are building positions in BSE stocks as well.
Add-on to Relative Volume / Volume Breakout Multiplier (RVI) Indicator: The CRVI is an additional feature integrated into the Relative Volume / Volume Breakout Multiplier (RVI) indicator, providing an enhanced perspective on volume dynamics.
Usage of CRVI:
Quantifying Volume Breakouts: The indicator quantifies the degree of volume breakouts concerning the Simple Moving Average (SMA), facilitating a clearer understanding of the strength of volume breakouts.
Relative Volume Interpretation: By comparing the current volume with the volume SMA, the CRVI delivers a breakout number, such as 2.0 for double the volume SMA or 0.50 for half the volume SMA. This assists traders in gauging the momentum and potential trading opportunities more effectively.
Advantages for Traders:
Enhanced Volume Analysis: Breakout traders, in particular, will find the CRVI invaluable for identifying potential trading opportunities and assessing volume strength more accurately.
Essential Toolkit Inclusion: Traders focusing on volume breakout analysis can benefit significantly from incorporating this indicator into their trading toolkit.
Embracing Continuous Improvement:
Every tool and analysis utilized contributes to the ongoing process of becoming more adept traders. Embracing continuous learning and improvement is the foundation of successful trading. As we move forward, armed with the right tools and mindset, we eliminate the doubts of today and pave the way for a more confident tomorrow.
Gratitude :
Your support, likes, and comments are deeply appreciated. If you have any questions, do not hesitate to reach out. Let's work together to make trading an enriching experience!
Price and Volume Stochastic Divergence [MW]Introduction
This indicator creates signals of interest for entering and exiting long and short positions on equities. It primarily uses up and down trends defined by the change in cumulative volume with some filtering provided by a short period exponential moving average (9 EMA by default).
Settings
Moving Average Period : The moving average over which the cumulative volume delta is calculated. Default: 14
Short Period EMA : The EMA used to represent price action, and is used to generate the EMA Delta line. Default: 27 (3*3*3)
Long Period EMA : The second EMA used to calculate the EMA Delta line. Default: 108 (2*2*3*3*3)
Stochastic K Value : The value used for stochastic curve smoothing. Default: 3
Dot Size : The diameter of the larger indicator. Default: 10
Dot Transparency : The transparency level of the outer ring of the primary BUY/SELL signal. Default: 50 (0 is opaque, 100 is transparent)
Band Distance from 0 to 100 : The upper and lower band distance. Default: 20
Calculations
The cumulative volume delta (CVD) is calculated using candle bodies and wicks. For a red candle, buying volume is calculated by multiplying the volume by the spread percentage of the average of the top and bottom wicks, while Selling Volume is calculated multiplying the volume by the spread percentage of the average of the top and bottom wicks - in addition to the spread percentage of the candle body.
For a green candle, buying volume is calculated by multiplying the volume by the spread percentage of the average of the top and bottom wicks - plus the spread percentage of the candle body - while Selling Volume is calculated using only the spread percentage average of the top and bottom wicks.
Once we have the CVD, we can then perform a stochastic calculation of the CVD value.
stochastic calculation = (current value - lowest value in period) / (highest value in period - lowest value in period)
We’ll do the same stochastic calculation for the short term EMA (27 EMA default) as well as for the difference between the short term and long term EMA.
When the stochastic CVD value is rising from zero and the short term EMA stochastic value equals 100, then it’s a major bullish signal. When the stochastic CVD value is falling from 100 and the short term EMA stochastic value equals 0, then it’s a major bearish signal.
Sometimes, after a bullish or bearish signal, the stochastic CVD will reverse direction triggering a new opposing signal.
How to Interpret
The CVD indicates when there is either more buying than selling or vice versa. A value over 50 for the stochastic CVD curve represents more buying taking place. A value below 50 represents more selling. One might intuitively believe that when there is more buying volume than selling volume that the price would follow suit. This is not always the case.
Most of the time buying volume will precede consistent price movement upwards, and selling volume will precede consistent price movement downwards. When this divergence occurs, the indicator generates a signal. When this divergence begins to fail, and buying or selling volume reverses, then another signal is generated indicating that the buying/selling impulse is headed back into the direction of price action.
These interactions are visually represented on the chart with the coral line that represents CVD, and the yellow line that represents the EMA, or the average price. When the coral line goes up and the yellow line stays down, that’s the BUY signal. When the coral line goes down and the yellow line stays up, that’s the sell signal. When the coral line switches direction, the chart generates another signal showing that volume is moving in a direction that supports the price.
The orange line represents the stochastic representation of the difference between the short EMA (27 by default) and the long EMA (108 by default). EMA differences is a method that can be used to define a trend. When a short term EMA is above a longer term EMA, that may represent a bullish trend. When it is below, that may represent a bearish trend. When all 3 lines are rising or falling in the same direction at the same time, it tends to indicate a movement that has the potential to continue.
Other Usage Notes and Limitations
It's important for traders to be aware of the limitations of any indicator and to use them as part of a broader, well-rounded trading strategy that includes risk management, fundamental analysis, and other tools that can help with reducing false signals, determining trend direction, and providing additional confirmation for a trade decision. Diversifying strategies and not relying solely on one type of indicator or analysis can help mitigate some of these risks.
This indicator can be paired with the MW Volume Impulse indicator if it is desired to see the actual buying and selling cumulative volume deltas. Also, in many cases, the BUY and SELL signals tend to correspond with Keltner Bands (ATR Bands) becoming extended. Lastly, volume weighted average price (VWAP) along with other macro events can impact price and negate signals. To view VWAP lines, you may choose to use the Multi VWAP or Multi VWAP for Gaps indicator to help ensure that the signals you see in this indicator are not being affected by VWAP lines.

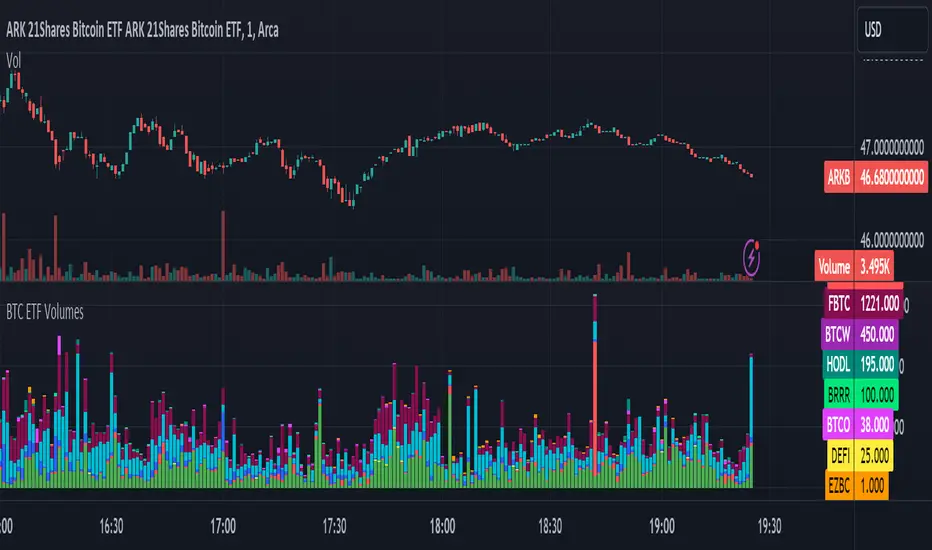
BTC ETF VolumesVolume
This script plots the trading volume of all BTC spot ETFs as well as the aggregate volume. Works on any chart and any timeframe.
Indicators
The volume of every ETF is plotted in a different color, with the total column adding up to the aggregate volume.
If you have price and indicator labels enabled you will also see individual ETF volume on your price scale on the right hand side.
If more BTC ETFs get launched I will add them.
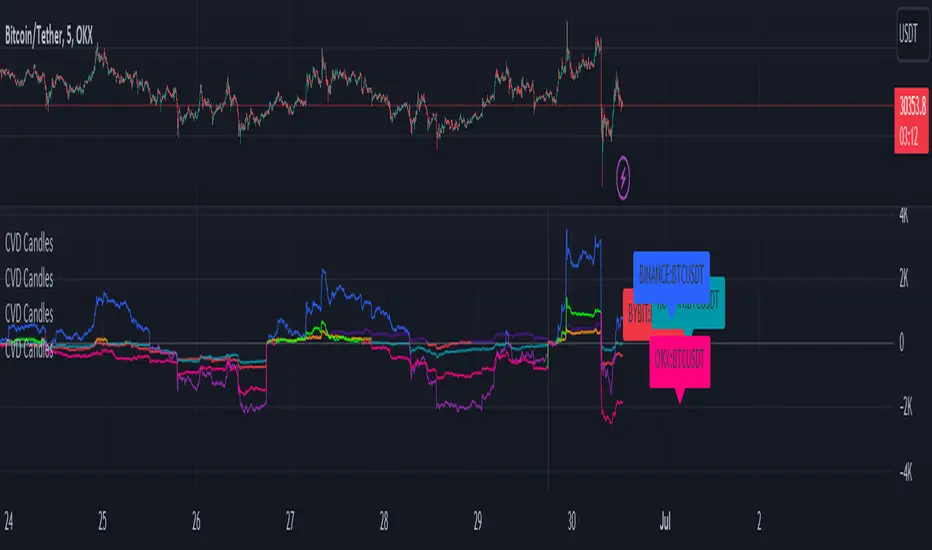
CVD+ - Multi Symbol Cumulative Volume DeltaEdit of TradingView's LTF CVD
TradingView's CVD is already the most accurate CVD on the platform because of the LTF data. The purpose of the edit is to provide the ability to compare volume flow between multiple exchanges, futures & spot, multiple symbols or any other potential use case. All in single layout or even a single pane.
Added features:
- Option to manually select a symbol from which to calculate the LTF CVD
- Option to normalize the selected symbol's CVD to the chart's symbol's CVD (Useful when you want to compare futures and spot on the same pane)
- Label that displays the selected symbol's name and exchange
- Changed presets to plot the CVD line as the predetermined option
All of TV's original features remain the same.
[TTI] Zanger Volume Ratio - Intraday––––HISTORY & CREDITS 🏦
The Zanger Volume Ratio - Intraday indicator is inspired by the work of Dan Zanger, a renowned trader and creator of the Zanger Volume Ratio tool. This specific adaptation of the ratio is designed for the TradingView platform and focuses on intraday trading. Dan Zanger used this same method of reading the chart to establish a world record in turning HKEX:10 ,775 into HKEX:18 ,000,000 in under 2 years.
––––WHAT IT DOES 💡
The Zanger Volume Ratio - Intraday indicator measures the estimated end-of-day volume percentage based on intraday (depending on the timeframe of your chart) comparisons for the last X days (input in the settings). It provides insights into the stock's trading volume in real-time throughout the trading day, giving traders an idea of the stock's relative volume compared to its recent trading history. For instance if you add it to a 5min chart the ratio represents the estimated end of day volume percent based on the last 3 days, the indicator will compare the cumulative volume of the current day to the X days back cumulative average up to that same point in time and tell you how it is around the thresholds.
The indicator categorizes the volume into five levels: Extreme, High, Average, Light, and Dry Up, each represented by different colors on the chart. It also displays a pace indicator, which shows whether the volume is increasing or decreasing during the trading session.
There is also a label that shows the current reading and its pace. The pace is the indication wether the volume ratio pace is increasing and picking up or it is slowing down.
Thesholds
👉EXTREME (red): >200, means "Volume is 200% of average daily volume
👉HIGH (magenta): 110
👉AVERAGE (peach): 85
👉LIGHT (orange): 60
👉DRY (gray): <60
––––HOW TO USE IT 🔧
To use the Zanger Volume Ratio - Intraday indicator effectively, follow these steps:
1️⃣ Apply the indicator to your TradingView chart with an intraday timeframe (>=1min and less than 1 day).
2️⃣Observe the real-time volume levels and their corresponding categories (Extreme, High, Average, Light, and Dry Up) to understand the current volume dynamics.
3️⃣Keep an eye on the pace indicator (arrows) to see if the volume is increasing or decreasing during the session.
4️⃣Use the information provided by the indicator to confirm trade setups, identify potential breakouts, or detect possible reversals. For example, a stock breaking out of a key area with high or extreme volume and an increasing pace arrow may indicate a strong upward move. Conversely, a stock pulling back on light or dry up volume could signal a continuation of the trend once the volume picks up again.
Remember to combine the Zanger Volume Ratio - Intraday indicator with other technical analysis tools and your own trading strategy to make informed decisions.

Strategy Myth-Busting #11 - TrendMagic+SqzMom+CDV - [MYN]This is part of a new series we are calling "Strategy Myth-Busting" where we take open public manual trading strategies and automate them. The goal is to not only validate the authenticity of the claims but to provide an automated version for traders who wish to trade autonomously.
Our 11th one is an automated version of the "Magic Trading Strategy : Most Profitable Indicator : 1 Minute Scalping Strategy Crypto" strategy from "Fx MENTOR US" who doesn't make any official claims but given the indicators he was using, it looked like on the surface that this might actually work. The strategy author uses this on the 1 minute and 3 minute timeframes on mostly FOREX and Heiken Ashi candles but as the title of his strategy indicates is designed for Crypto. So who knows..
To backtest this accurately and get a better picture we resolved the Heiken Ashi bars to standard candlesticks . Even so, I was unable to sustain any consistency in my results on either the 1 or 3 min time frames and both FOREX and Crypto. 10000% Busted.
This strategy uses a combination of 3 open-source public indicators:
Trend Magic by KivancOzbilgic
Squeeze Momentum by LazyBear
Cumulative Delta Volume by LonesomeTheBlue
Trend Magic consists of two main indicators to validate momentum and volatility. It uses an ATR like a trailing Stop to determine the overarching momentum and CCI as a means to validate volatility. Together these are used as the primary indicator in this strategy. When the CCI is above 0 this is confirmation of a volatility event is occurring with affirmation based upon current momentum (ATR).
The CCI volatility indicator gets confirmation by the the Cumulative Delta Volume indicator which calculates the difference between buying and selling pressure. Volume Delta is calculated by taking the difference of the volume that traded at the offer price and the volume that traded at the bid price. The more volume that is traded at the bid price, the more likely there is momentum in the market.
And lastly the Squeeze Momentum indicator which uses a combination of Bollinger Bands, Keltner Channels and Momentum are used to again confirm momentum and volatility. During periods of low volatility, Bollinger bands narrow and trade inside Keltner channels. They can only contract so much before it can’t contain the energy it’s been building. When the Bollinger bands come back out, it explodes higher. When we see the histogram bar exploding into green above 0 that is a clear confirmation of increased momentum and volatile. The opposite (red) below 0 is true when there are low periods. This indicator is used as a means to really determine when there is premium selling plays going on leading to big directional movements again confirming the positive or negative momentum and volatility direction.
If you know of or have a strategy you want to see myth-busted or just have an idea for one, please feel free to message me.
Trading Rules
1 - 3 min candles
FOREX or Crypto
Stop loss at swing high/low | 1.5 risk/ratio
Long Condition
Trend Magic line is Blue ( CCI is above 0) and above the current close on the bar
Squeeze Momentum's histogram bar is green/lime
Cumulative Delta Volume line is green
Short Condition
Trend Magic line is Red ( CCI is below 0) and below the current close on the bar
Squeeze Momentum's histogram bar is red/maroon
Cumulative Delta Volume line is peach

Realtime Cumulative DeltaThis is a Real time volume Delta indicator which has to run real time on the chart to capture observation.
Start it when the session starts and log the data and observe. It plots histograms as well as candlesticks of the the cumulative volume delta, from the style switch whichever you want.
It is done based on real time tick and not based on candlesticks, so the accuracy of volume delta is more. Uptick volumes are added as buy and downtick volumes as sell which is the actual way of calculating CVD
Apply the CVD concepts for trading results.

Cumulative DeltaThis scripts calculates the cumulative volume delta within the current day.
Options allow you to change the display type of this data (3 different configurations are given in the chart above)
The following options are available:
Colors selection
Reset cumulative delta everyday (can be disable to keep a continuous calculation of the delta over days)
Show histogram (used to display the delta as a positive/negative histogram)
Show daily High/Low levels (draw highest and lowest delta levels within the day)
Show candles (display the cumulative delta as candles)
Show Moving average (display a moving average which is reseted everyday at the same time as the cumulative delta itself)
Moving average length
This script will be updated if I feel the need to improve things or to add new features
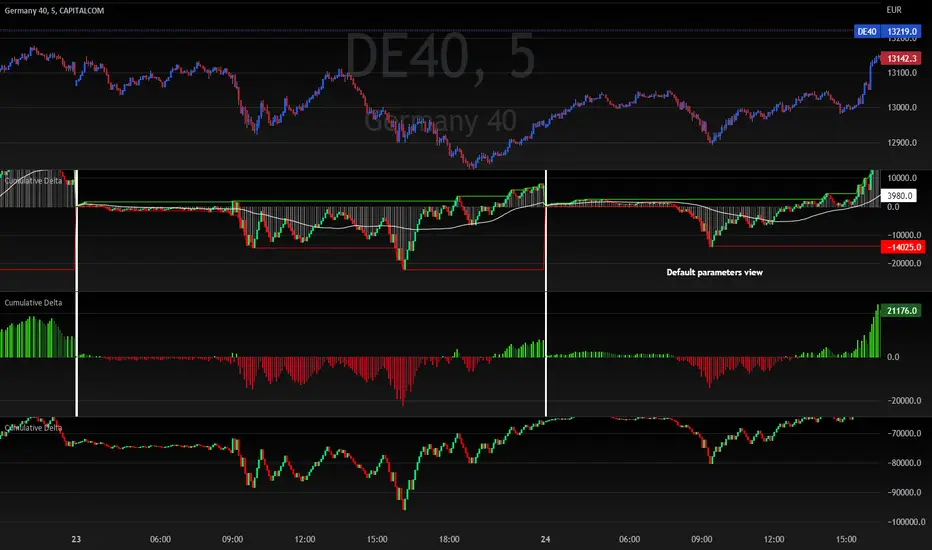
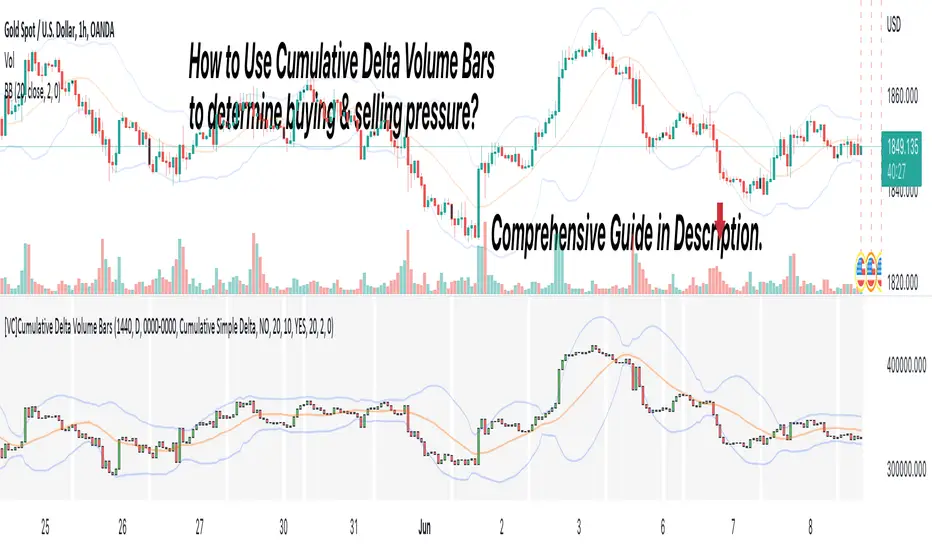
[VC] Cumulative Delta Volume BarsLet's first learn what is Delta & How to Use Cumulative Delta Volume Bars?
Cumulative Delta Volume Bars is one of the leading indicators that you can use when trading order flow. It gives you an instant snapshot of the buying and selling pressure in a market.
After reading the detailed description of "Cumulative Delta Volume Bars," you will understand how volume delta provides a critical edge by allowing you to spot significant potential reversals in the market. You will also learn to use this Cumulative Delta indicator in depth. (including rest session usability features)
What is Delta Volume?
Delta Volume is the difference between Buying and Selling Power. Delta Volume is calculated by taking the difference between the volume traded at the offer price and the volume traded at the bid price. (in simple words, the difference between buying pressure & selling pressure)
If delta volume is more than zero, you have more buying pressure than selling & vice versa, and if delta volume is less than zero, you have more selling pressure than buying.
In Order-Flow Analysis , traders used Cumulative Delta to measure the relationship between the Buying & Selling pressure Vs Price.
Cumulative delta volume takes the delta values for every bar and successively adds them together to provide a graph, as seen below visually.
Let me demonstrate by giving examples of how cumulative Delta can help measure the buying or selling pressure relative to the price move.
★ Trading Absorption & Exhaustion concepts with Delta
See the chart below & try to analyze the next possible move on the basses on the analysis mentioned on the chart.
➽➽ If you said Short, you were correct. ✅
Till Point A , both price & cumulative were aligned. (means there were no imbalances between Delta & Price).
But on Point B , the Cumulative Delta broke the previous resistance clearly and moved even further away from the resistance level, but the Price couldn't break the last resistance. It interprets that buyers applied a lot of buying pressure but no result. (Aggressive buying pressure absorbed by Passive sellers)
Due to this vast effort or failed attempt, buyers were exhausted and had no more strength to pull the Price up. That's why the Price reversed from Point B . See below image
★ Cumulative Delta Volume Bars is helpful when determining buying or selling pressure at different key price levels, such as swing highs or lows.
Let's recap on swing highs and swing lows.
➽ A swing high (S.H) is formed when the high reaches higher than the price action around it. Once the Price moves above a prior swing high and begins to retrace, a new swing high is formed.
➽ A swing low (S.L) is formed when the low reaches lower than price action around it. Once the Price moves below a prior swing low and begins to retrace, a new swing low is formed.
➽ When the Price makes higher highs and higher lows, a market is considered an uptrend.
➽ When the Price is making lower lows followed by lower highs, a market is considered a downtrend.
When evaluating Delta, it's beneficial to compare delta values at swing lows or swing highs to determine the amount of selling or buying pressure and how the market reacts.
The actual Power of Delta is revealed when we use it to determine the market's reaction to powerful buying or selling. We want to see if the market has reacted as we would expect or not.
In the above Example, you will notice that every time price breaks a swing, Delta does as well.
It makes sense as it takes selling pressure to break a swing low or buying pressure to break a swing high. In simple words, we can say that there is no anomaly between delta direction & price direction.
In simple words (No Absorption or Exhaustion)
But what's occurring when this isn't the case, and we have divergence between Price and Delta? Let's analyze it with real examples.
★ Understanding Delta Divergence.
(Lack of Harmony in Buying/Selling Pressure & Price Move)
Notice how the Price breaks out of the previous resistance level on the above chart, but the Delta didn't yet reach even close to its last resistance level. It's a clear divergence between Price and Delta. Buyers may be slightly exhausted at the previous resistance level, and Price & Delta may retrace slightly. But in a broader view, it reflects a strong bullish signal.
See the above chart & see when and why the Price moved. I hope it will help you understand the underlying relation & story between Price & Delta.
Cumulative Delta & Trade Management
Delta will help you spot significant reversals, but it can also be used to help manage your open trade. You want to see a high correlation between Delta and Price when in a long or short position.
Suppose you're short while the Price is breaking a new low. You want to see Delta breaking low if sellers aren't interested in selling at the recent lows, represented by Delta not breaking lows. The probability of a short term reversal or a significant retrace increases.
When in a position, always be on the lookout for exhaustion and absorption, signalling a reversal potential.
What Includes in V.C Cumulative Delta Volume Bars Indicator
Inputs & Settings
Reset accumulation on new session:
Allows you to rest accumulation at the start of each session (you may choose your customized starting & ending time as well by enabling ''Customize Rest Session Time''
Start/End of Session & During Session:
Allows you to show/hide & choose the background color & separator of each session
''Customize Rest Session Time''
When this setting is enabled, your customized given time will be applied, which can be set from the below box. Note: set your time in minutes. For Example, if you want to reset the session after every hour, you need to put 60. If you're going to reset after every 8 hours, you need to put 480. Additionally, your chart time frame must be lower than your customized rest time.
Reset Each Minutes:
Allows you to put your desired rest time in minutes. For Example, for 1 hour 60, for 8 hours 480. (8x60)
Reset Each:
Allows you to choose rest time from the drop-down menu. Note: To apply this setting, don't enable the ''CUSTOMIZE RESET SESSION TIME''.
Select Session:
Allows you to set customized starting & ending times of the session instead of the exchange's default time. For Example, the exchange reset time is 20:00, but if you want 22:00, first, you need to set your chart time as an exchange from the right bottom of the chart, and then you need to put 22:00 22:00 in both fields. Note: Put the same starting & ending time. In simple words, it should not be greater than or less than 24 hours.
Type:
It allows you to select Delta type. (there are two delta types you can choose from, 1st Simple Delta, 2nd Delta % or Volume Weighted Delta)
Candle Colors:
Allows you to change the color of candles.
Envelope Indicator:
Allows you to apply to Envelop Indicator on the delta candle. (all default settings of the Envelop Indicator can be customized as well)
See the below chart with Envelop applied to Delta Candles & Price Candles. (can be used to measure the Delta & Price movement at the micro-level)
Bollinger Bands Indicator:
Allows you to apply to Bollinger Bands Indicator on the delta candle. (all default settings of the Bollinger Bands Indicator can be customized as well)
See the below chart with Bollinger Bands applied to Delta Candles & Price Candles. (can be used to measure the Delta & Price movement at the micro-level)
Start/End of Session on Chart
Allows you to change the first & last candle of the session.
Style Settings:
Allows you to control all the visual settings of delta candles, Envelop & Bollinger bands.
-------------------------------------------------
➽Conclusion:
Cumulative Volume Delta Bars is one of the leading indicators you can include as an order flow trader in your arsenal. It gives you an inside look at buying and selling pressure and how the market reacts.
But Keep in mind, in trading & technical analysis, nothing is 100% certain. No indicator can give you a 100% success rate. There is no holy grail in the financial market. As a trader, with the help of technical & fundamental indicators, our goal is to find an edge over the market. A simple definition of an edge is: Anything that adds a few points to the winning side of an equation builds an edge that lasts a lifetime. A trading edge defines your technical or strategic advantage in the highly competitive market environment. Traders can establish multiple edges by starting with popular strategies and customizing rules to lower the risk of getting trapped with the emotional crowd.
Disclaimer Note:
V.C Cumulative Delta Volume Bars It is purely Volume, Delta, Demand & Supply imbalance and comparative analysis based tool. Before applying this Indicator to your study, you should know about Volume, Delta & Spread, Demand & Supply, and Aggressive & Passive behaviour of buyers/sellers.
Some basic understanding of Sir Richerd Wyckoff's Theory can also be helpful.
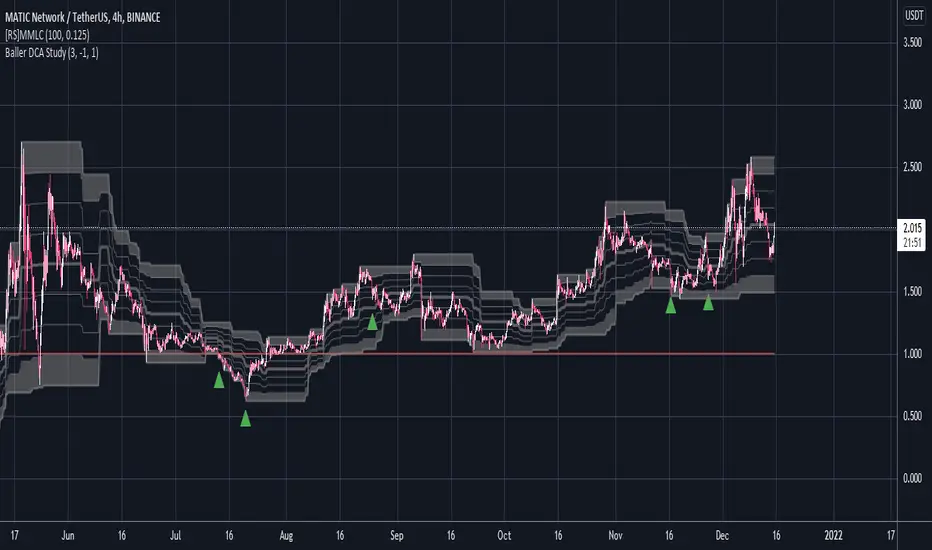
Baller DCA StudyFinds bottoms using CVI. Green arrow is the signal. Used for a DCA strategy in conjunction with MMLC
Baekdoo golden diamond signalHi forks,
I'm trader Baekdoosan who trading Equity from South Korea. This Baekdoo golden Diamond signal indicate good buying position to trade.
Here's the ideas
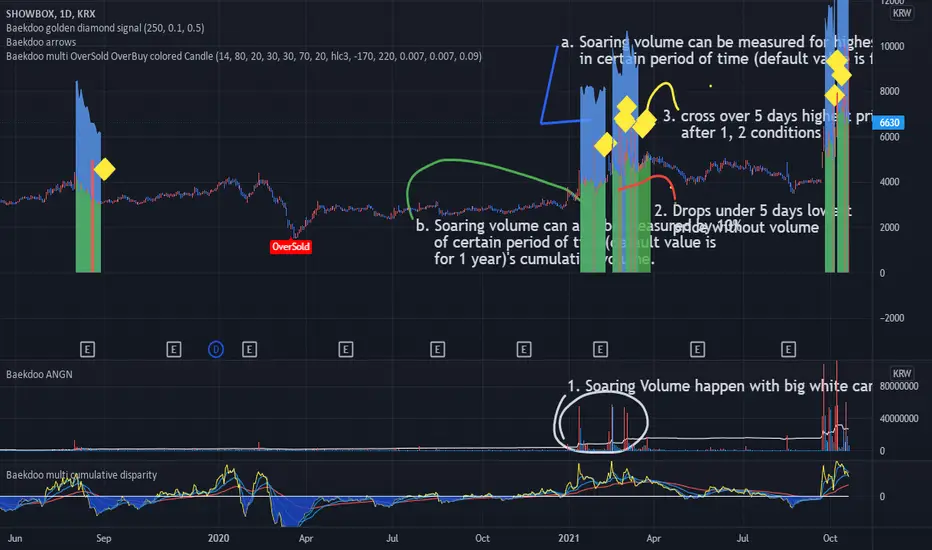
1. Soaring volume happen with big white candle.
a. Soaring volume can be measured for highest volume in certain period of time (default value is for 1 year). (blue area)
b. Soaring volume can also be measured by 10% of certain period of time(default value is for 1 year)'s cumulative volume . (green area) => you can adjust this ratio input. the higher value is the more likely to trail of whale
2. Drops under 5 days lowest price without volume . (red area) => I put half of average volume as default but you may can adjust it (the lower value is the more likely to soar again)
3. cross over 5 days highest price after 1, 2 conditions => Golden Diamond
underneath of this idea is, big chunk of the money comes and correction is on going but major whale's amount hold tight.
you can modify input values based on your investigation. It works well on day chart as well as minute chart. for the area with breaks plots are to checking the 1,2 conditions. so for final indicator will only be shown from this indicator but you can select plots if you think that is useful.
hope this will help your trading on equity as well as crypto. I didn't try it on futures . Best of luck all of you. Gazua~!
Baekdoo Golden Diamond signalHi forks,
I'm trader Baekdoosan who trading Equity from South Korea. This Baekdoo golden Diamond signal indicate good buying position to trade.
Here's the ideas
1. Soaring volume happen with big white candle.
a. Soaring volume can be measured for highest volume in certain period of time (default value is for 1 year). (blue area)
b. Soaring volume can also be measured by 10% of certain period of time(default value is for 1 year)'s cumulative volume. (green area) => you can adjust this ratio input. the higher value is the more likely to trail of whale
2. Drops under 5 days lowest price without volume. (red area) => I put half of average volume as default but you may can adjust it (the lower value is the more likely to soar again)
3. cross over 5 days highest price after 1, 2 conditions => Golden Diamond
underneath of this idea is, big chunk of the money comes and correction is on going but major whale's amount hold tight.
you can modify input values based on your investigation. It works well on day chart as well as minute chart. for the area with breaks plots are to checking the 1,2 conditions. so for final indicator will only be shown from this indicator but you can select plots if you think that is useful.
hope this will help your trading on equity as well as crypto. I didn't try it on futures . Best of luck all of you. Gazua~!

Market Breadth Indicator (percentage of US stocks above * SMA)This script is a revised version of jchang274's Multi-Sub script.
Add more feature from the original jchang274 script.
1.Compare 4 US STOCK INDEX ( Dowjones 30/NASDAQ100/RUSSELL2000/S&P500 ) in the same index of percentage of stocks above 20 /50/100/200 days simple moving average.
2. Use 4 index of percentage of stocks above 20 /50/100/200 days simple moving average,compare the same stock index ( Dowjones 30/NASDAQ100/RUSSELL2000/S&P500 )
How it begin?
Traders and investors use market breadth in order to assess the index’s overall health. Market breadth can be a reliable, if not an accurate, indicator of an upcoming price rise in the index. Similarly, it can also provide early warning signs for a future price decline.
What is it?
Market breadth indicators analyze the number of stocks advancing relative to those that are declining in a given index or on a stock exchange.
Market breadth refers to how many stocks are participating in a given move in an index or on a stock exchange. An index may be rising yet more than half the stocks in the index are falling because a small number of stocks have such large gains that they drag the whole index higher.
How it works?
Market breadth studies attempt to uncover strength or weakness in the movements of an index that are not visible simply by looking at a chart of the index.

NSE (CNX) FUTURES Cumulative Open Interest VolumeThis indicator combines Volumes of all the open contracts of
NSE FUTURES (e.g. NIFTY FUTURES) and Combines them together.
For e.g. Default Ticker is set to NIFTY1!
NIFTY1! + NIFTY2! + NIFTY3!
Since NIFTY3! is not available on Trading View one has to manually add (via indicator settings) the last (third) running month's Futures contract symbol (NSE stock future symbol) in this.

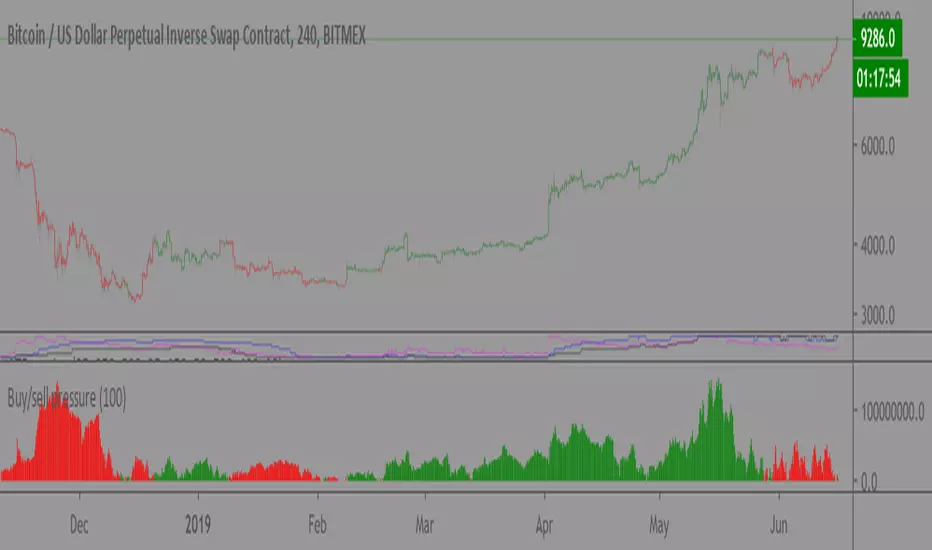
Buy/sell pressure (volume)Still early phase.
Looks at volume pressure over the course of a bar and compares to the last x bars to see if sell or buy pressure is greater. Visualized as an indicator and barcolor.
Recommended length: 100