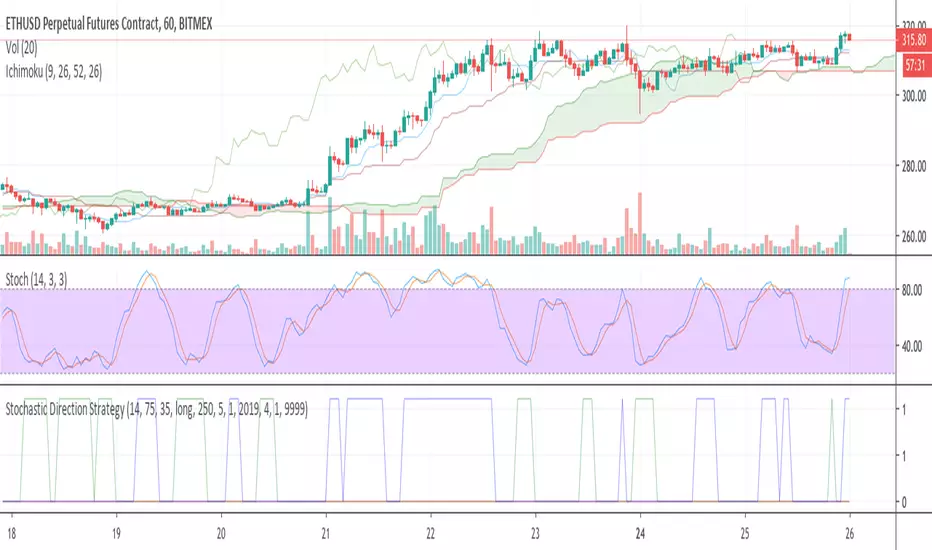
Stochastic Direction StrategyThis is a simple strategy based on the Stochastic Oscillator: stockcharts com/school/doku.php?id=chart_school:technical_indicators:stochastic_oscillator_fast_slow_and_full
Its purpose is to gradually build a position in a trending market (as of June 26th 2016 in most cryptocurrencies).
Inputs:
- direction (long/short)
- overbought/oversold
- close positions (yes/no to only increase positions)
Outputs:
- buy/sell/close signals plotted on a chart below
This script can easily be used as a TradingView study (for alerts) and a strategy (for backtesting). See the comments in the code.
I have added additional alert conditions to be used easily together with a trading bot reading the signals
Yet obviously you can also do manual trading on each alert.
Ethereum (Criptovaluta)
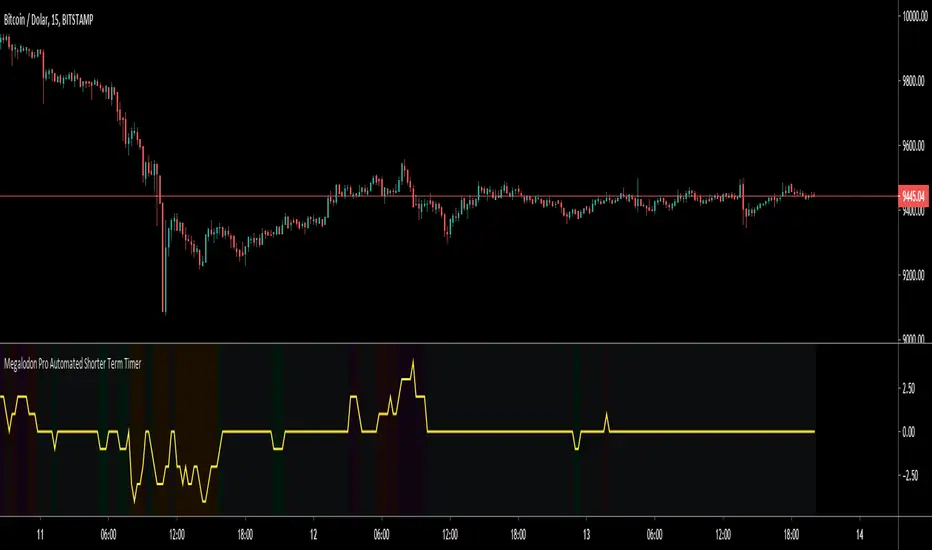
Megalodon Pro Automated Shorter Term TimerHow to use?
It should be used on 1 minute time frame for finding potential market reversal points.
It shows reversal signals by printing Green for Buy - Orange for Strong Buy - Red for Sell - Purple for Strong Sell signals.
Megalodon Pro Automated Longer Term TimerHow to use?
It should be used on DAILY time frame for finding potential market reversal points.
It shows reversal signals by printing Green for Buy - Orange for Strong Buy - Red for Sell - Purple for Strong Sell signals.

Megalodon Pro Automated Longer Term TraderHow to use?
Yellow line isolates between 0-100.
It should be used on DAILY time frame for understanding the market state.
It prints Green for Bull - Orange for Strong Bull - Red for Bear - Purple for Strong Bear signals.

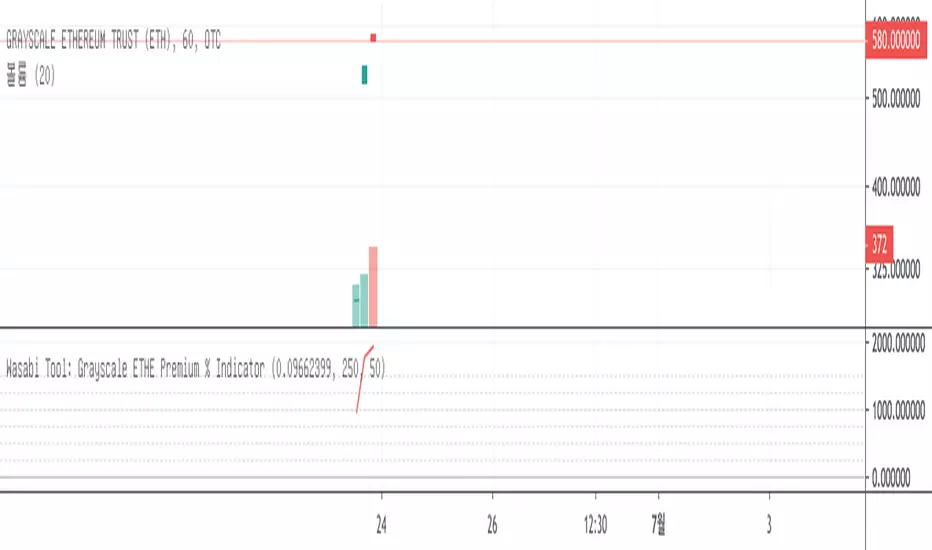
Wasabi Tool: Grayscale ETHE Premium % IndicatorThis indicator is to show the premium of the newly released Grayscale's Ethereum Trust, ETHE in percent(%).
With the volatile nature of Ethereum , the ETHE should also follow the exact price action, up or down, of Ethereum . However, some exuberant interest in the investors and the limited supply of ETHE make ETHE's price go much higher than its NAV (Net Asset Value) price per share, which is the amount of 0.09662399 ETH, also found at the Grayscale website, at the time of writing.
You may find it useful to compare this indicator along with the Ethereum trends found in Internet. The difference is that this indicator is to show the ACTUAL exuberance and eagerness by those of people who have restrictions in investing directly in Ethereum for whatever reasons.
At the time of writing, its NAV price is $28.3 based on today's ETH price of $293. However, the currently traded price is $580, which is ridiculous and is 1900%+ premium.
I hope you like the indicator.
Please subscribe and Like it.
Thanks,
Wasabi
---
안녕하세요. 와사비 입니다.
오늘 새로 만든 지표는 ' Wasabi Tool: Grayscale ETHE Premium Indicator ' 입니다.
이 지표는 그레이스케일 투자 회사의 트러스트 상품인 ETHE 가 실제 가치( NAV )대비 얼마나 프리미엄이 붙어 있는지를 표시하는 지표입니다.
비트코인의 심한 가격변동과 마찬가지로, ETHE도 이더의 가격을 쫓아갑니다. 하지만, 투자자들의 열광적인 투자관심과 ETHE의 부족한 공급물량으로 인해 ETHE의 가격이 NAV (글 쓰는 현재 기준 1 ETHE = 0.09662399 ETH )로 표현되는 실제 가치보다 훨씬 많은 프리미엄(때론, 100%이상)을 내고 거래되어 오고 있는 실정입니다.
2019년 6월 21일 현재 프리미엄이 1900%가 넘습니다.
글을 쓰고 있는 현재, 내재가치( NAV price)는 현재 이더의 가격인 $293에 대해 0.09662399 ETH이므로 약 $28.3에 불과하지만 오늘 시장에서 거래되는 가격은 $580 이고 프리미엄이 1900%+ 에 달합니다. 조심해야할 부분입니다.
어제 출시한 후, 혼탁한 시장의 분위기를 반영하고 있습니다.
와사비 드림.
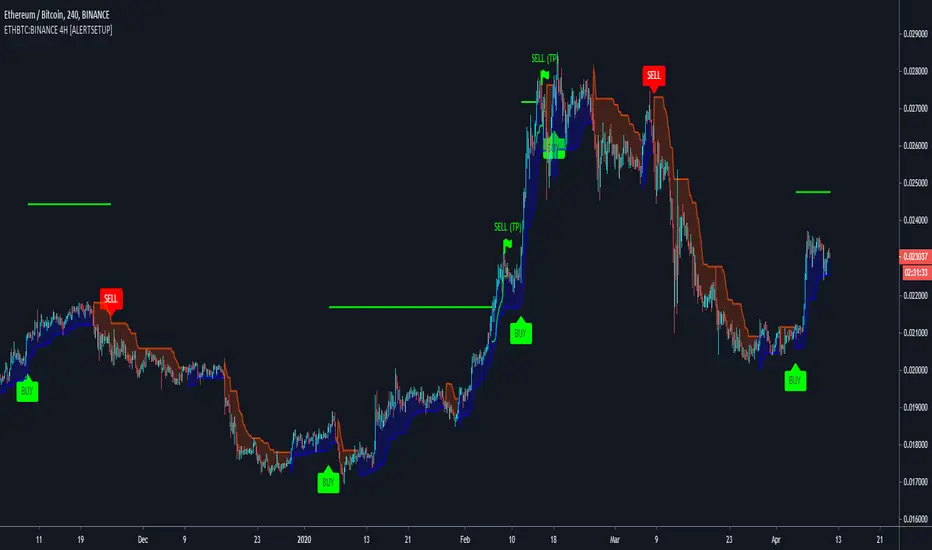
Buy & Sell - ETHBTC:BINANCE 4H Trading BotWith this indicator you can create Buy and Sell alerts to automate your trading.
Optimised for BINANCE:ETHBTC in a 4H timeframe.
> > > READ HOW IT WORKS < < <
The goal of trading ETH against BTC is to increase your amount of BTC. ETH is in the top 5 Coins of all time and its bull rallies are really fast and volatile so it's very important not to miss them!
Built upon my generic indicator Cyatophilum Altcoins Trader , this Strategy creates buy and sell signals to can be used for manual or automated trading.
The year 2019 started with the end of a bull run, and the script was able to catch 29% of profits. Then in Februrary, we saw another rally, but this one dropped fast and the script caught 4% of profits. Until then, two opportunities of trade triggered but ended up as a loss, as the bear market continued. In total, it made 33% of profit and 9.5% of loss . The fact that a bear market has be going on for +3 months is a good thing for what will happen next.
I think we all remember how 2018 was for ETH. It had the most insane rally of all time, another one in April-May then 6 months of bear market. Oh! by the way, did I say the script has an integrated trailing stop loss starting at 4%? Those are the green dots below the price.
I used TradingView's Strategy Tester with historical data starting from 2017-08. Results are calculted using 100% equity from a 10 000$ capital and a 0.05% commission fee on each trade.
See the results below.
> > > READ HOW TO USE < < <
> Get access to the Cyatophilum Indicators <
Gravity Swing Oscillator V1 - optimized for CryptoGravity Swing Oscillator V1 - optimized for Crypto
- Top & Bottoms
- Buy / Sell Signals on colorchanging LED Dots
- can show danger Price Dop Zones on Bars
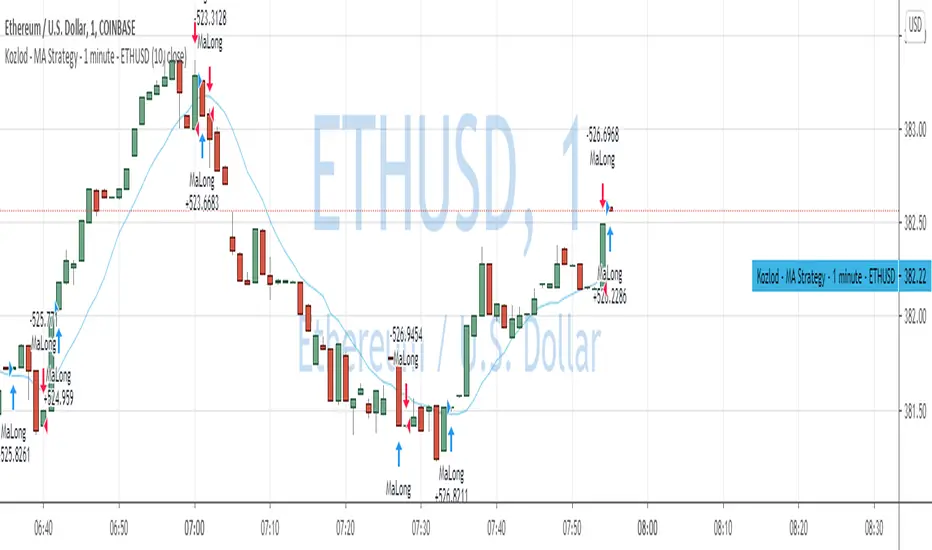
QuantNomad - MA Strategy - 1 minute - ETHUSDInteresting performance for simple MA strategy on 1m ETHUSD. I used only close price and 15 SMA in it.
Performance is 55% over 10 days with a drawdown of only 3.5%.
Percent profitable is only 30% with almost 2k trades.
For sure this won't work as a standalone strategy, with 2k trades commission and slippage will destroy all your PNL but it can be a pretty good base for a more complicated strategy with good filters.
And remember:
Past performance does not guarantee future results.
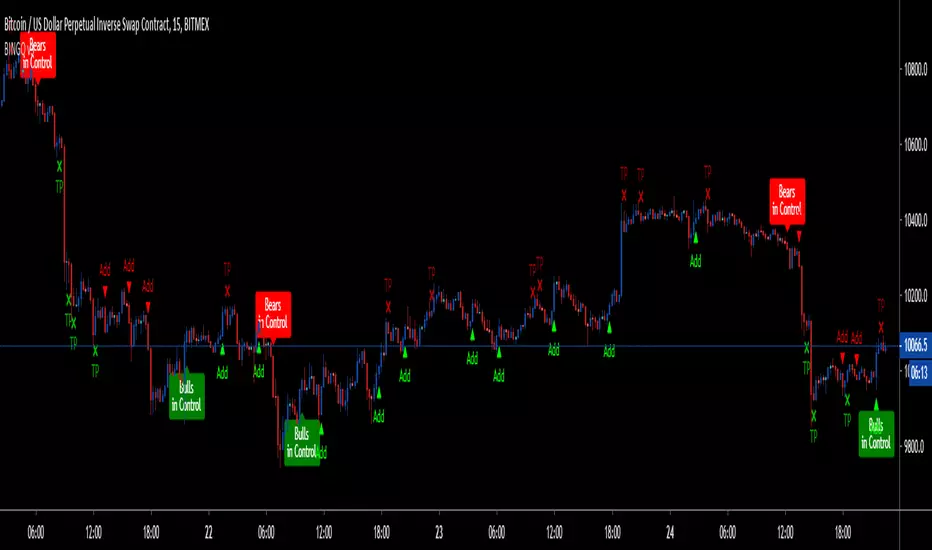
BINGO - LTF Bitmex Scalper for ETHThis is my first script which is exclusively made for ETH/USD for bitmex on 5-10min timeframe(Note: This is not for higher timeframe script, it was not designed to sustain all timeframes, but it might show some good results and you have to test it on your own). It might work for other coins, but i don't recommend it.
Its based on few parameters which I have been using to scalp ETH.
Currently its skipping few trades and exits which i will fix in sometime(getting to learn pine script), nevertheless it is by far most profitable of all my strategies.
LEGENDS:
1. Green Arrow up - Long
2. Red Arrow down - Short
3. Green TP - Take Profit for short position
4. Red TP - Take Profit for long position
If in Long postion, put STOP at low of 2nd last candle until TP1 hits. At TP1, take some profit and move stop to little above entry. Same for Short, put STOP and high of 2nd last candle until TP1 hits.
Also, it does not have alert function, so all of the trades have be manually executed. Trades are shown in chop zones as well, which will result in losses, so better use a chop indicator to avoid those trades.
Next update will have
1. FIxed missing Trades and Exits
2. Alerts
3. Improved Algo( Removal of signals in chop zone, options to have safe and risky entries, Stop placements)
4. Misc features such as, bar color change, multiple Buy/Sell(currently its alternative - Multiple means, if its a BUY and another BUY comes then it will show that too so you can add to the current trade) etc..
Just to clear my intentions, this script will be "paid only access" after next update(2-3 weeks). If you can, please tag your friends so they can benefit too. Please feel free leave a comment with all the suggestions and test results.
If you have made some money with this script, leave some tip:
BTC: 15sbDhh8t4itiFLuSTmznF87SMspvHBrDh
ETH: 0x8be1be65e9d6a167b8a4d10fda152d1d29e8e4cb
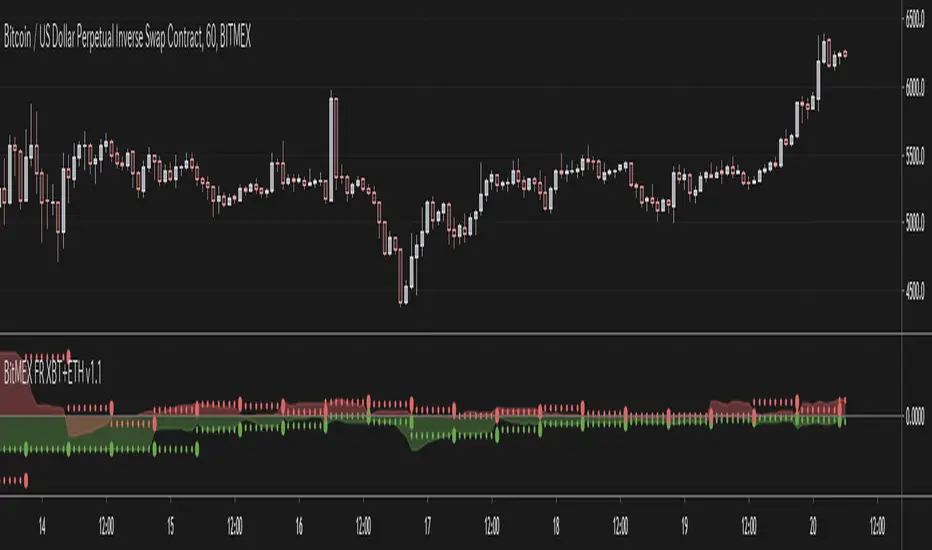
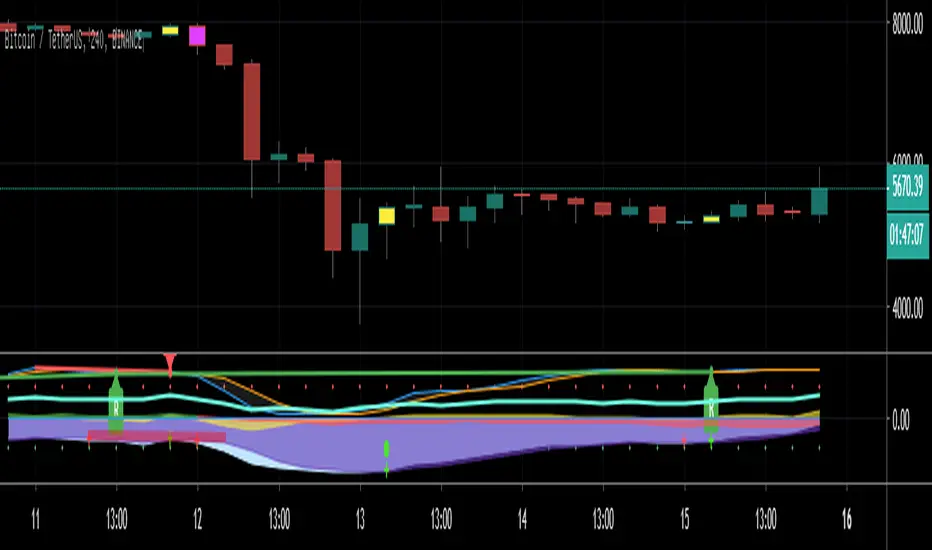
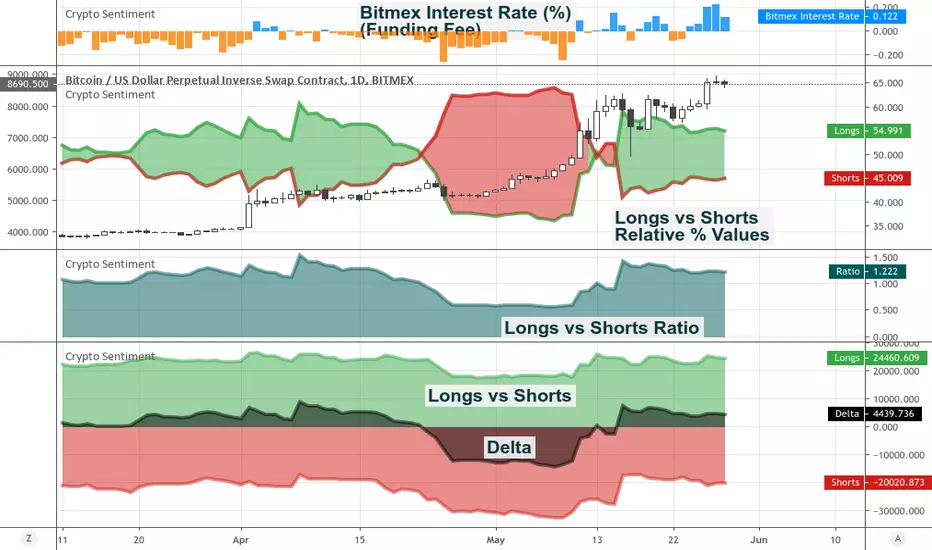
Ultimate Crypto SentimentThis study plots sentiment data from Longs vs Shorts reported at Bitfinex and the Funding Interest Rate that applies at Bitmex.
The indicator includes 4 visualization modes:
Overlapped Areas: Plots Longs and Shorts overlapping each other
Opposed Areas: Displays Longs as positive values and Shorts as negative.
Cloud: Highlights the difference between Longs and Shorts
Bitmex Interest Rate: Shows the funding rate that applies at Bitmex
The Longs vs Shorts data can be displayed either in Absolute mode or in Relative Mode.
The indicator includes visibility controls to Show/Hide:
The Longs
The Shorts
The Delta
The Longs vs Shorts Ratio
MADMEX ETHUSDBitmex BITMEX:ETHUSD Trading Setup for Madmex.io
Features:
- Entries based on several MTF MACDs, RSI and CCI Indicators
- Multiple ATR-based Take-Profit Stops
- Trend Detection
- Position Sizing / Risk Management
Ethereum Automated Strategy - Bitfinex - 3HHello guys !
Here is a ready to use BITFINEX:ETHBTC Automated Strategy with Long and Short Alerts !
You can see the backtest below using 100% equity of 10 000$, 0.1% commission, long and short trades with no leverage.
Indicator used
Leave a comment to get your trial !
or
Get the indicator today !

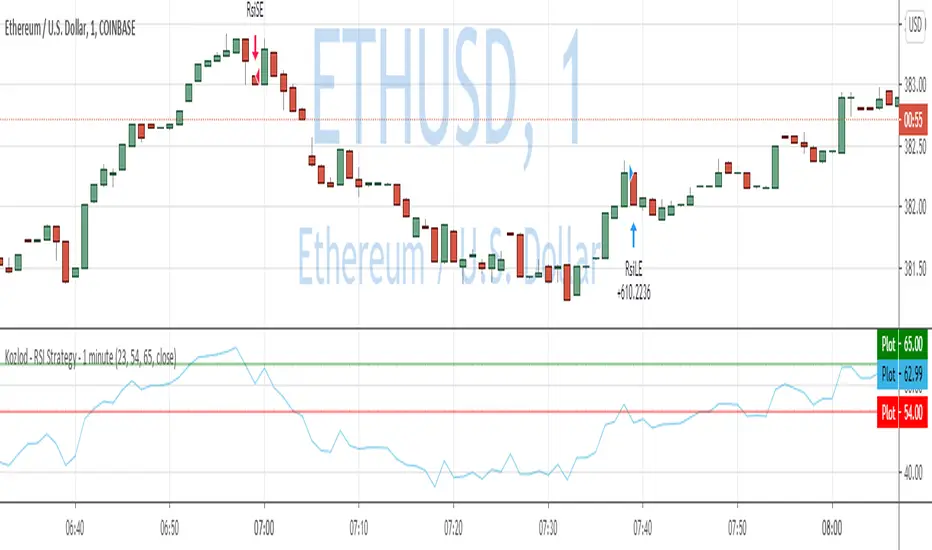
Kozlod - RSI Strategy - 1 minute - ETHUSDTrying to find simple strategies with optimal parameters which work well for certain symbols/timeframe.
Found that basic RSI strategy without any position management works pretty good for 1m chart for BTCUSDT.
It might not work very good on it's not but can give you a pretty good base for more complicated indicators.
Also, some position management as simple as static SL and PT can improve performance quite a lot.
And remember:
Past performance does not guarantee future results.
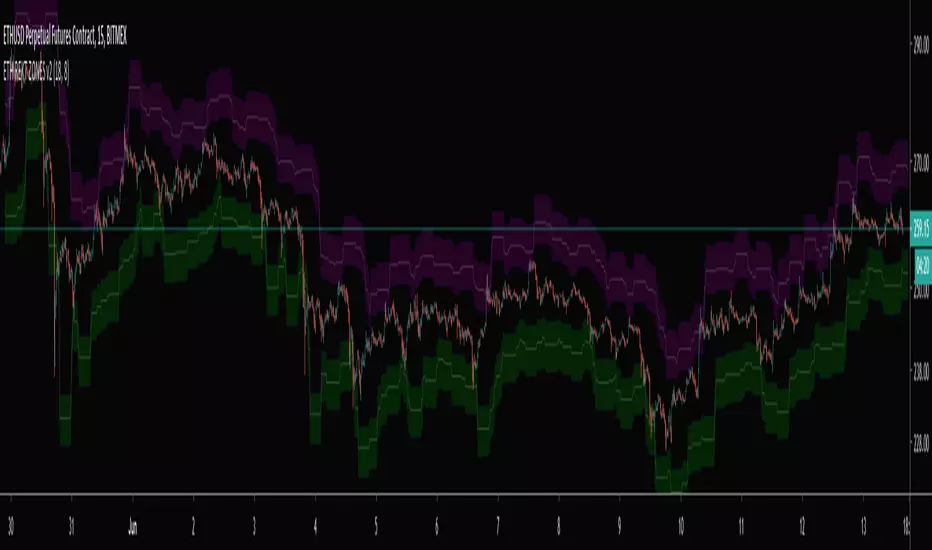
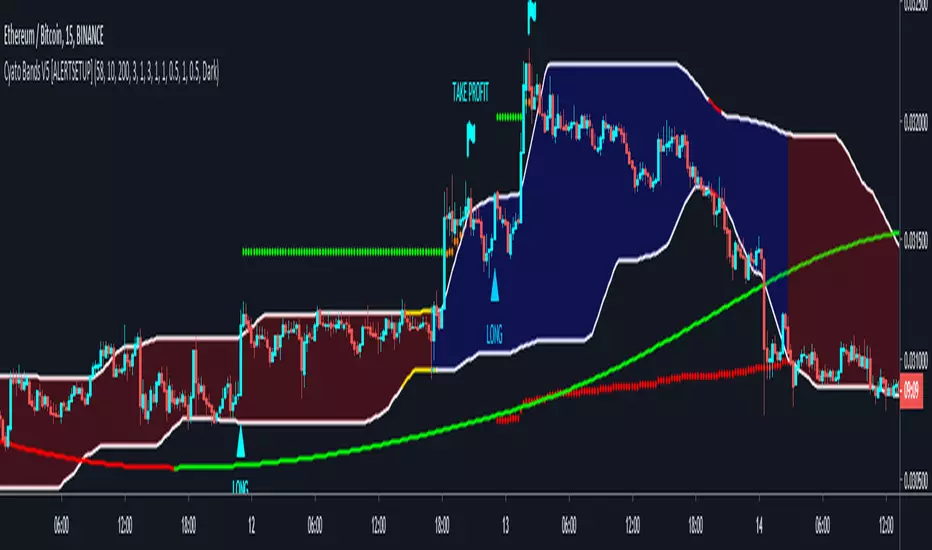
Cyatophilum Bands Pro Trader V5 [ALERTSETUP]Alert Setup version
Get the Free Backtest version here :
This version includes a new feature.
Trailing Take Profit with % deviation.
For those seeing the indicator for the first time, it works like Donchian Channels with lag and a channel width condition to detect breakouts. On top of that I integrated a Stop Loss and Take Profit system to pinescript.
Backtest results below are calculated with :
Short + Long Strategy
0.05% Commission
100% of 10 000% equity per trade
Strategy data from 25/04/2019 to 18/05/2019
Default Configuration for BITFINEX:ETHBTC 3 minutes timeframe.
This version also has the Stop Loss / Take Profit system included in the previous version, plus a short / long setup distinction. For example you can choose a different stop loss % for long and for short trades.
Previous version:
Get access to the Alert Setup version and automate the strategy today !
Purchase the Cyatophilum Indicators pack
I will publish backtests and configurations so make sure to follow me if you don't want to miss anything !
My Website - blockchainfiesta.com -
My Discord channel - discord.gg -
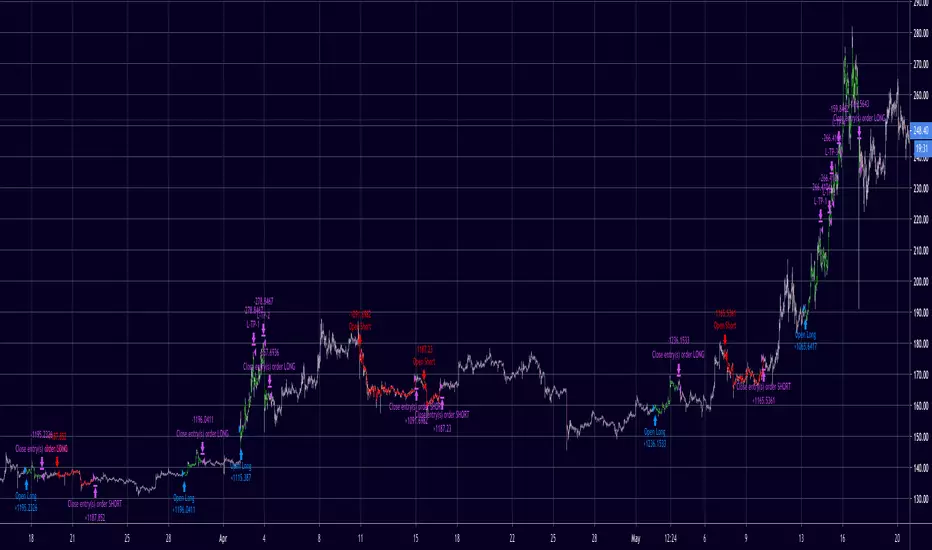
Momentum Signal Moving AverageThis is a script with one modified indicator that mainly tracks and executes positions openings by calculating volume and "enthusiasm" from the exchanges coin pairs. I recommend that it is used on a 15m chart.
When it is a bullish trend it is configured to take profit, but this is of course something you can set values or disable. In bearish trends, the script opens bigger positions, and when a bounce happens the script starts taking profit.
In stagnation, the script used to be week, and made losses. However, with the added scalping feature it seems to at least even it out, or even make profit as I have seen now.
It's still a very 1.0 script and will get updated to make sure the profit keeps getting higher percentage.
I use the Alerts Trader extension to execute orders from Tradingview in Chrome via Bitmex API.
I use it on Bitmex, but surely you can use it on other exchanges that are supported in the Alerts Trader extension, which is extensive.
Important : You will be able to add this script to your chart, but you won't be able to se the source code, so to make it work you need to set the alerts right, with correct code for it to work.
Here is where I come in:
I'll give each user 3 day trial, and after that, if you are satisfied and want to run it longer, you can subscribe for $49/month.
And if you have bigger capital, I will install it and configure it to match the amount of contracts you wish to have.
If you are a person with big capital, you can get 1 week of trial.
And for people with big capital, you can get personal support from me when needed to alter settings or create new alerts. This will cost $50 each time.
But remember, you can also run the trial on the Bitmex testnet, but the volume is very low there so the bot does not preform as well on the testnet as it does on the mainet with big volume.
I am willing to let someone, a 3rd party, with good reputation test it for a few days and make an honest review after.
Disclaimer: I cannot guarantee that this script will make you rich, but after a week of testing, both on testnet and mainnet, the results are good enough for me. (I am no financial expert or professional trader. Any losses from the algorithm is not my issue, use it at your own risk. Always run the script/bot with money you can afford to lose)
All payments to me are made in bitcoin.

Crypto Indicators #u9tusA set of low timeframe (LTF), medium timeframe (MTF), and high timeframe (HTF) indicators for use in crypto currencies / bitcoin.
Traditionally the 10, 20, 50, 100, and 200 SMAs are used in TA. With cryptos, I've found that the 8 EMA, 21, 55, and 128 SMAs backtest better, while no change in length was necessary for the 200. I wanted to combine all these into one indicator to easily add them to a chart layout, hence this script.
You can customize the length of each MA to your liking in the settings, or accept the defaults.
LTF Indicators:
8 EMA in blue hues, medium line stroke.
MTF Indicators:
21, 55 SMA in purple hues, medium line stroke.
HTF Indicators:
128, 200 SMA in yellow hues, thick line stroke.
Defaults are for daily timeframes and lower; suggest changing up the intervals for weekly and monthly to:
21 -> 30
55 -> 50
128 -> 100
$BTC, $ETH, #ALTS
twitter.com
(c) @jhaurawachsman 20190515

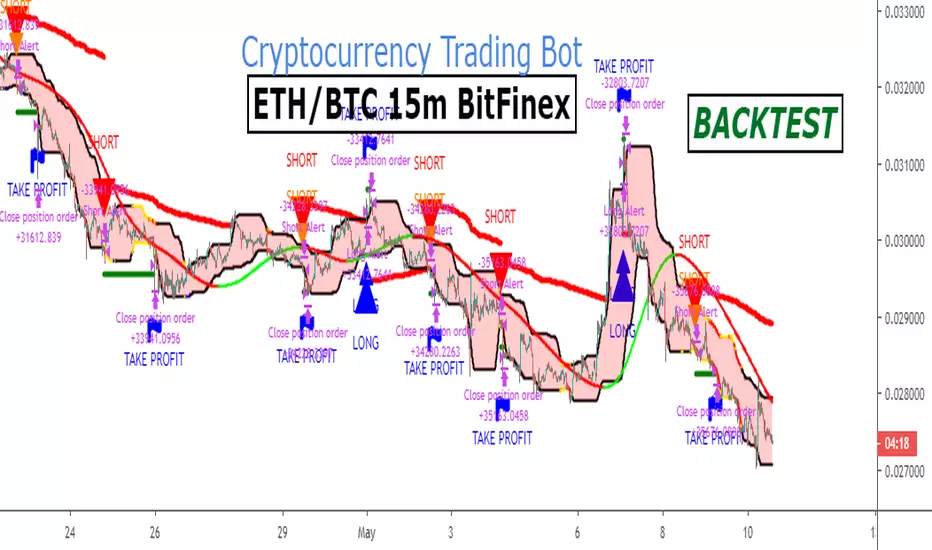
Ethereum FREE Backtest Version ETHBTC 15m BITFINEXA strategy for trading ETH/BTC in 15m timeframe.
The strategy includes long and short trades.
You can find the Alert Setup version below.
More info here .
-------------------------------------------------------------------------------
My website : blockchainfiesta.com
Automated Strategies for TradingView
TJ-Bitmex Funding RateWelcome back to another indicator of the TJ-Series
All indicators I publish, are based on existing indicator ideas just modified and in the selection of a CryptoCurrency Day Trader
This indicator emulates BitMEX funding rates with reasonably accurate results.
I have made a YouTube Video on my channel "TJ Trade Corner" explaining Funding Rates and how each of them work and what these are based on.
There is a google form link in the description, which when filled out correctly will grant you permission to this indicator.
BitMEX funding occurs every 8 hours at 4:00 UTC, 12:00 UTC and 20:00 UTC.
You pay the funding rate if you are in a position at funding time.
The funding rate is predicted from the minute funding occurs over 480 minutes (8 hours).
After 8 hours, which is another funding time, the predicted rate is set as the next funding rate, which will be paid 8 hours later at the next funding time.
For example:
It is 4:00 UTC and funding is paid, and there is currently a predicted rate of 0.01.
The predicted rate, 0.01, will be set as the next funding rate which will be paid in 8 hours at the next funding time.
The predicted rate resets and will become a more accurate prediction each minute.
Funding Rate Bar: On the bar on which funding is paid (see funding times), a column is rendered with the value of the paid funding rate.
Next Funding Rate: The rendered circles show the next funding rate, which will be the value of the Funding Rate Bar
Predicted Funding Rate: The rendered line is the predicted funding rate that resets when funding is paid.
Daily, Weekly, and Monthly views show the total of fundings within the bar.
i.e. a daily bar contains 3 funding periods, so if funding were 0.1 each of those times, the daily funding is 0.3.
There are 21 funding periods in a week, so a week during which the funding was 0.1 on average will have a Weekly bar with a funding value of 2.1
PRINTED VALUES
Predicted Funding Rate | Next Funding Rate | Funding Rate Bar
OPTIONS
Contract: Choose the BitMEX perpetual swap contract for which to emulate funding. XBTUSD or ETHUSD
This Indicator and the video have been published before in my private learning group "ETG".
We are going over many observations and possible trades very frequently.
It is meant for only those who are really interested in becoming a self sufficient trader and learning about all the secrets of trading.
Should you be interested in ETG or the indicators I use, join my discord channel and say hi in chat, then I will give you a free trial for which you might be interested.
Like and Follow me and you will find the space interesting because I am a TA expert and professional day trader in crypto since 2012 that does daily updates and new posts about the hottest and most discussed coins.
Cheers TJ

Market God v6Advance your trading game by applying our TA based indicator-study on your charts. Market God v6 is a tool that can be added to any chart, timeframe, or ticker on https://tradingview.com, and suggests the situation at hand as an opportunity to buy or sell you interests.
Market God v6 Product Description
Advance and Improve your understanding of price movement using the Market God v6 Trading Study (accessed via tradingview.com)
* Set alerts to be delivered via email or SMS (See TradingView.com for limitations that may apply, based on your Tradingview account type)
* Quickly identify market trends with visual buy/sell alerts on chart
* Access charts on-the-go via Tradingview mobile app
* Apply study to any symbol within the entire Tradingview library
* Use on any timeframe available to you on Tradingview
Through use of tradingview.com’s advanced Pine Script programming language, I have spent thousands of hours to find the rights combination that has resulted in the indicator study you see today. That said, it is imperative to understand that this study is not a guarantee profit & should be far from the only reason you enter a trade. It is highly recommended that you backtest, or paper trade before using this study, as it is intended to be a tool, and not the end-all-be-all.
When starting, my goal was clear: to create a study that could suggest consistent, reliable, and accurate trades, at a rate of success that was either equal to, or better than if I were doing it myself. Ideally, I figured that if I could take my own personal buy/sell criteria, standardize it, and create an system that informed me once my own criteria was met, it would allow me to succeed on a more consistent basis, and allow me to focus on other projects.
But lets pull it back to way before this indicator was even on the map – to the middle of 2018, specifically the middle of crypto-winter. Like many, I started by doing something I believe every trader or investor should do: writing down the exact criteria that I would ultimately require that I hold myself, in order to enter or exit a position. I then demanded that I abide by that criteria when making any decision in trading. This was relatively easy, and also forced me to really understand where I went wrong, each time I would losing trade.
While establishing the trade plan, I ran through every study/indicator I used personally already, and utilized online resources to understand what made those indicators give the readings they do, and the various ways price movement and volume can be used to calculate trends.
By taking the wealth of knowledge available online, we have successfully created a study that applies these methods of TA, and standardizes a system of trading that was successfully established in the bear market.

50EMA + 52RSI Day TradeBased on the great day trading video by @TrueCrypto28 ( www.youtube.com ), this indicator is perfect for trading on Binance. Have tweaked it so it is based on the 50EMA instead of SuperTrend.
Default settings
Long signal will be given when RSI is above 52 on the hourly chart to confirm a higher timeframe bullish bias as well as price closing above the 50EMA on the 5 minute chart. High + Low + Close / 3 has been used to smooth signals.
Trade will be closed when price either closes below the 50EMA on the 5 minute or RSI drops above 52 on the hourly.
Colour coded candles included for ease of trading. Green = all signals met to buy. Red = sell.
Can change inputs to suite your style.

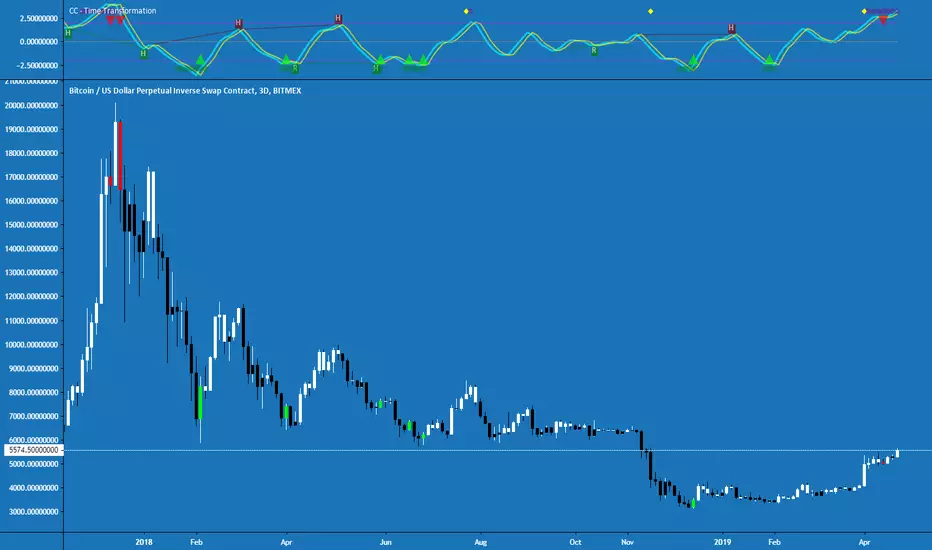
Cracking Cryptocurrency - Time TransformationTime Transformation is the creation of the Cracking Cryptocurrency Premium Trading Group . It's purpose is to provide volume , momentum, trend, and divergence at a glance. This limits the restrictions of a trader dramatically, by providing them with a powerful tool applicable on any asset, any time frame.
Momentum:
Time Transformation accurately interprets precise entry and exit positions in a ranging market via overbought and oversold conditions. When an asset is trending, these levels also indicate short-term exhaustion, and ideal profit taking levels.
These levels are completely customization, by adjusting the Cycle Length, and the boundaries of overbought and oversold itself. Also, with an advanced algorithm that calculates advanced price action, you can adjust this measurement for optimum results. One can even look at the momentum on a different time frame.
Trend:
Utilizing the power of Heikin Ashi to identify the dominant trend, this allows a trader to filter out the noise of Japanese candlesticks while still looking at their more accurate OHLC price information. Bars are colored pursuant to the dominant Heikin Ashi trend. One can also look at the Heikin Ashi trend of a higher or lower time frame to adjust the noise filtration.
Volume:
All traders know that we need volume for profitable movements. This indicator succinctly points out periods of unnatural volume , alerting a trader that a potential reversal or breakout may be occurring.
Divergence:
This Indicator understands fractal patterns of price action and oscillator movement. This allows for both Regular and Hidden divergence to be detected and displayed on the screen in real-time. One of the most powerful features of this indicator.
This Indicator boasts Multi-Time Frame features for both it's Momentum Oscillator and Trend Pattern Function, as well as fully adjustable settings for every function. Alerts are coded for every possible occurrence a trader could want.
Begin your journey towards market domination today. Allow this Indicator to Transform your Trading as it Transforms Time.
For access to this and all other Cracking Cryptocurrency Proprietary Indicators and Strategies, visit Cracking Cryptocurrency Premium Trading Group
Update Log:
-Adjusted default aesthetics to make Signal and Trigger Line more visible on a variety of backgrounds.
-Adjusted default aesthetics of zero line, overbought, oversold.
-Updated entire script to Pine Script Version 3.
-Updated Heikin Ashi Bar Recoloring Script - Will not re-paint, monitors the open and closing price and switches colors faster.
-Updated Input Setings for Multi-Time Frame feature. Much easier and more intuitive to select Time Frames from the drop-down menu.
-Simplified Input Settings, making them more intuitive.
-Updated Alert Messages to ease language barrier difficulties.
By Request: Added Alert Function for regular crosses.
Upcross = Fisher Crossing Over Signal Line.
Downcross = Fisher Crossing Under Signal Line.
Note that these are not buy/sell signals as per the Time Transformation strategy, as those crosses must occur in either overbought or oversold territory. :)