[DS]Bitcoin BTC ETH and others cryptos==DESCRIPTION - English version
The purpose of this script is to show information on graph that can help your decision to buy and sell cryptos.
The script is indicated for Position Trade (Long Term - Holder) and Swing Trade (Medium term).
Position Trade it is recommended to use the Weekly (W) and Daily (D) charts, Swing trade to use the 4H and 2H charts.
It is not advisable to use this indicator with graphic time frame less than 2 hours because the noise levels of information are very high.
An alert function has been inserted in the indicator and to activate this function you will need configure it in the Tradingview.
This alert will indicate the likely points of entry and exit of the asset.
**DESCRIÇÃO - Versão em Português
A proposta deste script é mostrar no gráfico informações que possam auxiliar a sua decisão de compra e venda de cryptos.
Este script é indicado para negociação Position Trade (Longo Prazo - Holders) e Swing Trade (Médio prazo).
Para Position Trade (Holders) é indicado utilizar os gráficos Semanal (W) e Diário (D), para Swing trade utilizar os gráficos 4H e 2H.
Não é aconselhável utilizar este indicador com tempos gráficos menores que 2hs pois os níveis de ruídos nas informação são muito altos.
Foi inserido no indicador uma função de alerta e para ativar esta função, você precisará configurá-la no seu Tradingview.
Este alerta irá indicar os provaveis pontos de entrada e saída do ativo.
====================================================================================================
** English Version
====================================================================================================
█ SETUP applied to Indicator
The setup is based on the average 8, 21 and 56 of the weekly chart (taught on youtube channel: Augusto Backes)
Price above the average 8 on the weekly, indicates that the market is UP trend, below the average 8 on the weekly that the market is DOWN trend
RSI greater than 60% the market is UP trend
RSI greater than 40% and lower 60% the market is in ACCUMULATION
RSI less than 40% the market DOWN trend
The weekly average 8 is represented in GREEN (Upward Trend) and RED (Downward Trend).
The weekly average 21 is represented in LIGHT ORANGE
The weekly average 56 is represented in LIGHT PURPLE
The crossing of weekly averages 8 and 21 is represented with a GREEN (HIGH trend) and RED (LOW trend) cross - this signal is disabled on the graph but you can enable it by clicking on the graph setup
█ FUNCTION USE
(1) Average 8, 21 and 56 on Weekly - show the average 8, 21, 56 weekly on graphic (Average 8 in color red and green, 21 - light orange, 56 light purple)
(2) Crossing of averages 8 and 21 Weekly - is not active but you can activate
(3) Calculation of RSI
(4) barcolor() - mark the candles with the green color (High market) and red color (Dow market)
(5) alertcondition() - you can active this alert on Tadingview
█ BUY AND SELL POINTS - likely points
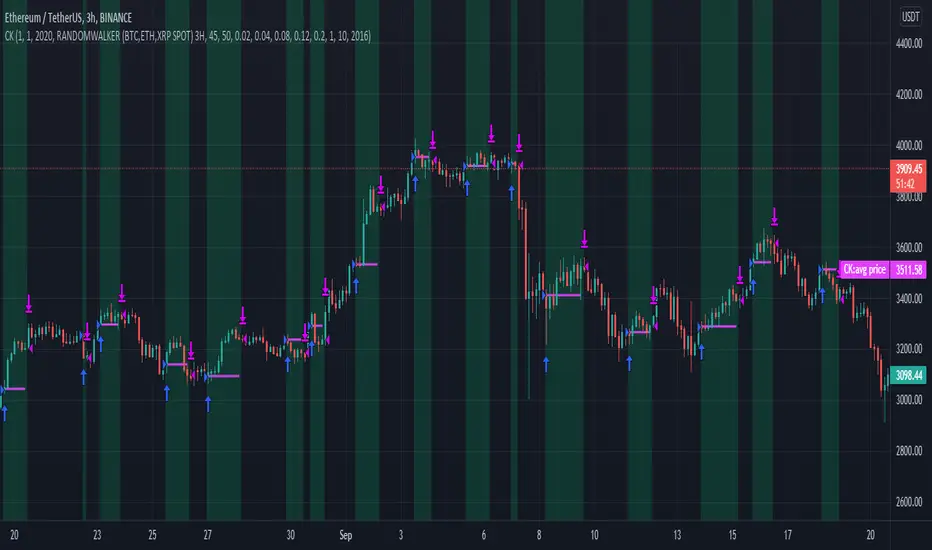
The indication of the BUY position is shown by a green arrow pointing upwards and the sell position by a red arrow pointing downwards. Buy and sell indications are obtained from the divergence in the market trend.
█ THANK TO
PineCoders for everything they do, all the tools and help they provide, and their involvement in making a better community. All PineCoders, Pine Pros and Pine Wizards, people who share their work and knowledge because of it and helping others, I am so happy and so grateful.
█ NOTE
This indicator is not a buy and sell recommendation, it indicates the most likely buy and sell points. Every purchase and sale decision is your responsibility
*****************************************************************************************************
** Versão em Português
*****************************************************************************************************
█ SETUP aplicado no Indicador
O setup está baseado na média 8, 21, e 56 do gráfico semanal
Preço acima da média 8 no semanal indica que o mercado esta em tendência de ALTA, abaixo da média 8 no semanal que o mercado está em tendência de BAIXA
RSI maior que 60% o mercado está em ALTA
RSI maior que 40% e menor 60% o mercado está em ACUMULAÇÃO
RSI menor que 40% o mercado está em BAIXA
A média 8 semanal está representadas nas cores VERDE (Tendência de Alta) e VERMELHA (Tendência de Baixa).
A média 21 semanal está representada na cor laranja claro
A média 56 semanal está representada na cor roxa claro
O cruzamento das médias 8 e 21 semanal esta representado com uma cruz VERDE (Tendência de ALTA) e VERMELHA (Tendência de BAIXA) - este sinal esta desativado no gráfico mas você pode ativá-lo clicando no setup do gráfico
█ FUNÇÕES UTILIZADAS
(1) Média 8, 21 e 56 no Semanal - mostra a média 8, 21, e 56 no gráfico
(2) Cruzamento das médias 8 e 21 Semanal - não está ativo mas você pode ativá-lo
(3) Cálculo do RSI
(4) barcolor() - marca a vela (Candle) com a cor verde (Mercado em Alta) e a cor vermelha (Mercado em Baixa)
(5) alertcondition () - você pode ativar o alerta no Tradingview
█ PONTOS DE COMPRA E VENDA - prováveis pontos
A indicação da posição de COMPRA é apresentada por uma seta na cor verde apontada para cima e a posição de VENDA por uma seta na cor vermelha apontada para baixo. As indicações de compra e venda são obtidas a partir da divergência na tendência do mercado.
█ OBRIGADO PARA
PineCoders por tudo o que fazem, todas as ferramentas e ajuda que fornecem, e seu envolvimento em fazer uma comunidade melhor. Todos os PineCoders, Pine Pros e Pine Wizards, pessoas que compartilham seu trabalho e conhecimento por causa dele e ajudando os outros, estou muito feliz e muito grato.
█ NOTA
Este indicador não é uma recomendação de compra e venda ele indica os pontos mais prováveis de compra e venda. Toda decisão de compra e venda é de sua responsabilidade
Ethereum (Criptovaluta)

[astropark] Trend Skywalker V2 [alarms]Dear Followers,
today I'm glad to present you Trend Skywalker V2 , the evolution of Trend Skywalker V1 indicator that you can see here below:
This indicator works on every timeframe and market, it's quite responsive to market movements, so it's especially good on volatile markets.
In this new version you have 3 trend clouds available :
a short-term one (yellow)
a mid-term one (green)
a long-term one (blue)
You can also enable an option to show all trend clouds as one, the result will be similar to a special bollinger bands tool.
Of course you can edit trend clouds analysis period and color, also you can turn on or off the cloud that you prefer.
The indicator can run 4 different kinds of strategy : one for each trend cloud individually or a mixed one.
Also the indicator tracks for you a peak profit from entry: this tracker is a suggestion for you to take profits while price goes up!
All red-green circles you see in the chart is a reminder that a peak profit label was there in the past: what does this tell you?
if price starts losing the short-term trend and you had a lot of TP suggestions, maybe trend ended and you should start consider closing your trade before you give back all your profit.
This indicator will let you set alerts on each buy/sell/close/tp label.
For backtesting, you can use the indicator here below:
This is a premium indicator , so send me a private message in order to get access to this script.

[astropark] Trend Skywalker V2 [strategy]Dear Followers,
today I'm glad to present you Trend Skywalker V2 , the evolution of Trend Skywalker V1 indicator that you can see here below:
This indicator works on every timeframe and market, it's quite responsive to market movements, so it's especially good on volatile markets.
In this new version you have 3 trend clouds available :
a short-term one (yellow)
a mid-term one (green)
a long-term one (blue)
You can also enable an option to show all trend clouds as one, the result will be similar to a special bollinger bands tool.
Of course you can edit trend clouds analysis period and color, also you can turn on or off the cloud that you prefer.
The indicator can run 4 different kinds of strategy : one for each trend cloud individually or a mixed one.
Also the indicator tracks for you a peak profit from entry: this tracker is a suggestion for you to take profits while price goes up!
All red-green circles you see in the chart is a reminder that a peak profit label was there in the past: what does this tell you?
if price starts losing the short-term trend and you had a lot of TP suggestions, maybe trend ended and you should start consider closing your trade before you give back all your profit.
On backtesting you can you test long and short setups individually or both, as well as performance in a specific time window.
This is a premium indicator , so send me a private message in order to get access to this script.

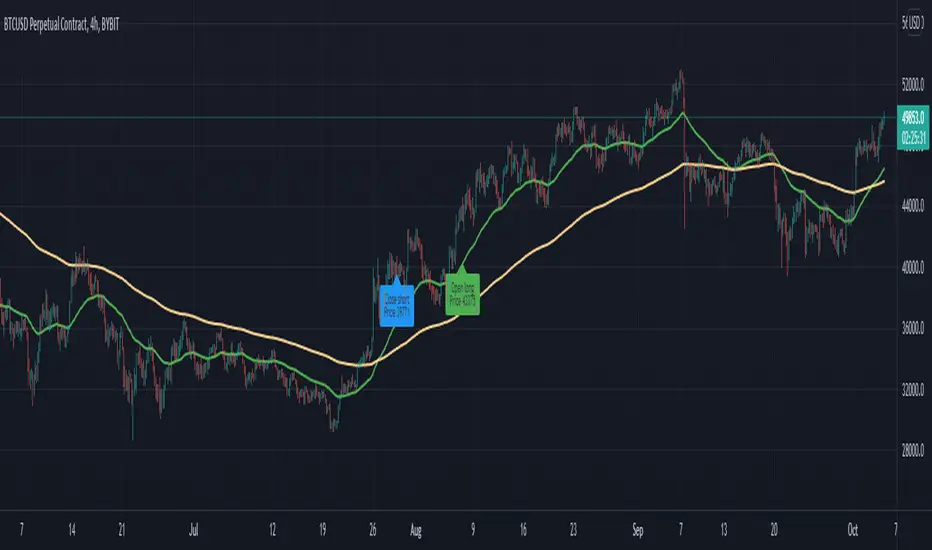
EMASAR Investor ModePLEASE READ THE FULL DESCRIPTION BEFORE BUYING OR USING THIS INDICATOR
THIS IS THE INVESTOR MODE ONLY VERSION OF THE EMASAR INDICATOR. IT INCLUDES THE ORIGINAL SIGNALS TELLING YOU WHEN TO BUY OR SELL. IT ONLY INCLUDES THE OCEAN TO INDICATE PULLBACKS AND NOT OTHER TRADING REGIONS ARE INCLUDED. IT SHOWS THE BUY/SELL SIGNALS AS WAS PUBLISHED IN THE ORIGINAL VERSION OF EMASAR
EMASAR (pronounced Emma-sar) is a strategy based on Exponential Moving Averages and the Parabolic SAR. This is a position trading approach that is derived from Tyler Jenks’ Consensio.
This strategy was developed with four objectives in mind: (1) managing risk (2) protecting from missing out on major moves (3) maximizing risk:reward (4) staying in a trending market and taking profit before it fully reverses.
EMASAR does a great job at accomplishing all of the above through the buy and sell signals that are generated. The data provided below is from the signals that occurred on Bitcoin ( Bitstamp ) from January 1, 2015 to present (November 11, 2019).
(1) Risk is tightly managed, relative to the winners, and losing positions will be exited before the market moves too far against.
The biggest losing trade on Bitcoin , for the time period outlined above, is -18.47%.
(2) Following the EMASAR buy and sell signals guarantees that one will not miss out on a major trend. As a result of the indicators used for this system it is mathematically impossible for a major trend to occur without providing a buy or sell signal. This system isn't meant to catch exact tops or bottoms but it will do a great job of capturing ~85% of a trend.
(3) On average the winning trades will be 5.55 times the losing trades. There will be stretches where the losers are bigger than the winners and this could last for many months, maybe even a year. However, over the long run the average reward is expected to be 5.55 times the average risk*.
*Past performance does not guarantee future results!
(4) This indicator was designed to capitalize on parabolic markets, specifically Bitcoin and alt coins. Crypto markets have a tendency to get moving so fast that many indicators become all but useless.
Entries can get signaled too late and exits will get signaled way too early. This is specifically true when using oscillators that are designed to identify overbought or oversold environments. EMASAR does a great job of keeping us in a position for the duration of a trend and this includes the major parabolic runs that Bitcoin has a tendency to go on.
When Bitcoin , or other alts, really get moving it can be very difficult to distinguish between a correction and a full reversal. We do not want to be exiting during a minor correction, instead this is a time when we want to be holding on or looking to buy the dip.
This is a very fragile balance. The market has a very strong tendency to make corrections looks like reversals and to make reversals look like corrections. Therefore it is very important to have a tool(s) that you trust to distinguish in between the two.
I believe that EMASAR is the best way to find that balance - if I knew of a better way then I would be using it instead!
Following these signals will help us to hold onto positions while the market is still trending in our favor when most think that it has moved too far / too fast, and it will also get us out before a market fully reverses.
Keep in mind that there will be times when we exit a market that is in danger of reversing, only to buy back higher later on. That is okay because it enables us to properly manage risk during times of uncertainty and buying back in at a higher price is more than worth the opportunity cost.
Risks
The biggest risks with trading EMASAR revolve around disobeying the signals. Risk management is built into this system with the exit signals that will occur, however it is up to the individual to execute those signals. Passing on an exit signal could lead to a big loss which would have a dramatic impact on the ROI . Most trading systems will have small and medium losses with small, medium and large wins. That is exactly how this works. The small - medium losses and wins will mostly be a wash and will account for roughly 80% of the trades. The large wins will happen about 20% of the time and will make up 80% - 90% of the profits.
Therefore the two biggest risks are passing on signals entirely, or exiting preemptively. Getting chopped in and out of a market can be quite frustrating. If you become overwhelmed with negative emotions then it could cause you to pass up on the next signal. That signal will often be the one that more than makes up for the small - medium losses that preceded.
On average EMASAR will provide one signal every 6 weeks when using the default settings on the 4h chart. Therefore missing one entry could turn an otherwise profitable year into a loser. If electing to trade a system, whether it is EMASAR or another, it is crucial to commit to taking every signal regardless of outside variables (namely your personal bias about market direction or frustration that follows a losing stretch).
Another major risk with this system is taking too much profit too soon. When getting into a trade that has the potential to be a big winner it can be challenging to continue holding through the swings. Anyone that has watched paper profits vanish will be inclined to start exiting after the market makes a big move in his or her favor. While this is better than watching profits completely evaporate, this mistake can be enough to turn a profitable system into one that loses to the market. If 80% - 90% of our profits come from 10% - 20% of our trades then it is vital we do not cut those positions off at the knees.
If taking too much profit too soon then you will consistently turn potential large winners into medium winners. This may lead to making money over the long run which will make it very difficult to realize that anything is wrong. However making money and beating the market are two very different things. Exiting early and making money is nearly as big of a risk as missing entries entirely.
If you have the discipline to execute signals in a timely manner after they are triggered and the emotional control to let the winners run despite the appearance of a vastly overbought / oversold market, then you should have what it takes to beat the market with EMASAR.
If you are not an experienced trader then it is very important to start out small. The only way to learn is to trade in a live environment and the only way to succeed is to risk much less than you can afford to lose. If you have $2,000 to trade with then start with a maximum position size of $20 - $50 and don’t be shy about scaling that down even further. Focus on ROI instead of actual dollars made. If you can return 100% on a $20 roll then you should be able to do the same with a $2,000 roll.
Important Notes
Make sure that you read / understand the risks outlined above. If you jump into this without understanding the unique risks that this system entails then you are going to have a bad time.
This indicator was developed around the 4h and that is where it works best. For crypto adjusting to higher TF’s will cause for bad results as the entries / exits will be late to the party. For traditional markets the Daily - Weekly time frames are preferred. It was not originally intended for smaller TF's but we have seen some good results on the 15m and 1h. The RSI can be a great compliment when using on smaller TF's. Adding a rule for not entering when RSI > 75 or < 25 and instead entering when RSI retests 50 will help to avoid some bad signals.
Alerts can be set for this indicator. Simply make sure that it is visible on the chart, then click the alert icon on the top panel. In the first dropdown set 'Condition' to 'EMASAR' and the second 'Condition' for the upcoming signal. For example if just entered long then set the second condition to 'Close Long' and you will be notified as soon as that signal occurs. If waiting for the next long entry then set the second condition to 'Open Long' so on and so forth . There is an 'All in One' alert that is also available. If you select that then you will be alerted any time that a signal occurs. The message will tell you to check the chart to see which signal caused the alert.
Bagheri IG Ether v2In this version, the winning ratio has been decreased, but the Risk to Reward Ratio (RRR) has been set to be better than the previous version.
This is a technical trading strategy for Ethereum ( BINANCE:ETHUSDT ). We built and developed it on MetaEditor and optimized it with MetaTrader optimizer.
The main indicators are Donchian Channel, Oscillator of ROC , Bears Power, Balance of Power , and Simple Moving Average ( SMA ). Default values in the input panel are the best combination of these indicators, but you can change any of them and try it for better results.
Please notice that this strategy has been optimized on the 1-minute chart of Ethereum .
For each position, you can see the Take Profit (TP) and Stop Loss (SL) levels. Also, you can find the values of mentioned TP and SL in points from the input panel of the script.
Attention: The price of Ethereum has 2 decimal places.
Therefore, 3000 points for TP means 30 USDT for trading 1 BINANCE:ETHUSDT .

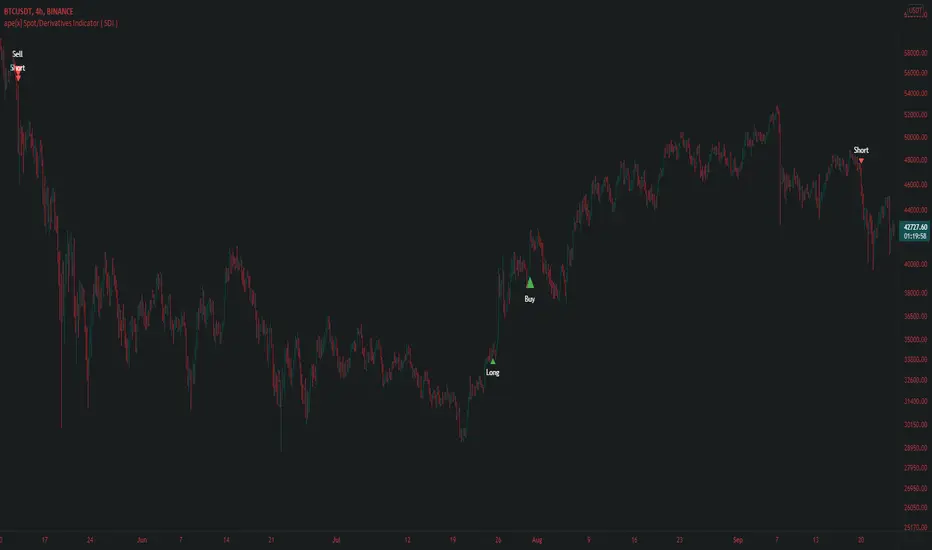
ape[x] Spot/Derivatives Indicator ( SDI )Apex spot and derivatives indicator is the latest generation of volume based algorithmic volatility trend Indicator developed by Quantdegen group.
It is a confluence of multiple modified legacy indicators to suit trader's ease to understand in which direction market is headed.
This generation of apex SDI is also developed with a vision to automate the trades with external third party bots/self scripted bots with the help of trading view alert system.
As we all know market usually outperforms legacy Indicators because they are evolved enough to attack liquidity and take stop loss of those who have poor risk management.
Apex SDI makes sure such attacks do not affect the signals by considering the most important factors like volume and expected volatility. It also confluences higher time frame arrays with lower time frame arrays to filter out the noise which might cause because of LFT volatility.
Quantdegen group is glad to announce this breakthrough in algorithmic trading indicators and make it available for public use.
Trend Fusion By CryptoScriptsWelcome to Trend Fusion! This isn't your typical moving average indicator. It's a multi-timeframe indicator that consists of 3 different moving averages AND let's you choose between EMA, SMA, WMA, VWMA, HMA, and RMA. For example, you can have the 5min 200 EMA, 15min 200 EMA, and 1 hour 200 EMA all on the SAME chart without having to switch timeframes! This helps to create an edge over the competition so you don't have to have multiple charts open and you can see everything on one screen. You can also modify each moving average to the timeframe and value of your choice.
Signals
The Trend Fusion fires a buy signal (green triangle) whenever Moving Average 1 crosses above Moving Average 2 and 3. This is great for catching a bullish trend early, especially when combined with other indicators.
The Trend Fusion fires a sell signal (red triangle) whenever Moving Average 1 crosses below Moving Average 2 and 3. This is great for catching a bearish trend early, especially when combined with other indicators.
You can also make Moving Average 2 and 3 the same value if you just want to create an alert for one moving average crossing over another. (i.e MA 1 is the 50EMA and MA 2 and 3 both have a value of 200 so you're just looking for the 50EMA to cross over the 200EMA).
This indicator is great for catching big trends and catching them early (as seen by the picture), and fires multiple buy signals or sell signals in case you didn't catch the first one so you still have time to get in the trade.
Alerts
You can also set alerts for the buy and sell signals! Just click the clock icon in the top middle of the chart and click Trend Fusion in the drop-down menu. Make sure to select "Once per bar close" so you know the signal is confirmed.
Each timeframe acts differently so make sure you experiment/backtest with each one and tailor your moving average values accordingly.
Disclaimer: Past results are not indicative of future returns.
PM me to obtain access and please let me know if you have any questions! :)

ICHIMOKU Crypto Swing StrategyThis is a crypto swing strategy designed for timeframes bigger than 1h.
The main components are
ICHOMOKU
KDJ
Average High
Average Low
Rules for entry
For long: we have the ichimoku crosses between tenkan and baselines, we have a rising kdj line and at the same time we have a increase in the average high
For short: we have the ichimoku crosses between tenkan and baselines, we have a falling kdj line and at the same time we have an increase in the average low
Rules for exit
We exit when we have inverse conditions than the initial ones used for entry.
Caution
This strategy does not use a risk management, so be careful with it !
If you have any questions let me know !

Traffic Lights Strategy4HS Crypto Market Strategy
This strategy uses 4 ema to get Long or Short Signals
Length are: 4, 9, 18, 100
We take long positions when the order of the emas is the following:
green > yellow > red (As the color of Traffic Lights) and they are above white ema (Used as a filter for long positions)
We take short positions when the order of the emas is the following:
green < yellow < red (As the color of inverse Traffic Lights) and they are below white ema (Used as a filter for short positions)
Enable Long and/or Short Positions in settings
Enable Profit and Stop in strategy settings with different percentage to backtest the strategy. Also if it is better to use a Traditional Stop Loss or a Trailing Stop Loss based on ATR
Change ema filter resolution in settings for better strategy performance
This Strategy was tested on Crypto Market with good results in assets as BTC, ETH, BNB, ADA, LTC, XLM, BCH, among others
Feel free to optimize this strategy, optimizing its parameters. Each asset has its own "personality".

MyTradePartnerMyTradePartner strategy makes the cryptocurrency markets buy and sell automatically. 5 stoploss, fixed profit take and stoploss level can be customized from strategy settings. There are 4 separate strategies that you can set in the strategy. First of them, there are strategies that decide long and short positions in accordance with your settings at the pivot levels, second of the super trend, third of the potential return levels, third of the up and down breaks. Pyramiding can offer multiple entry points. Strategy back tests can be adjusted to the desired time period and can be used as spot or term if desired. Frostybot is set to work fully compatible with js when the necessary inputs are made from these strategy settings. When installing an alarm for FROSTYBOT JS, the alarm message field is {{strategy.order.alert_message}}.
FEATURES:
-Fully compatibly with Frostybot
-High Percent Profitable strategy up to %60
-İnclude five level Trailing Stoploss, fixed stoploss and takeprofit with position size management
-include four strategy mentably in one strategy use one, use two or both
-All settings are customizable. Create your unique strategy with settings.
Bagheri IG EtherThis is a technical trading strategy for Ethereum ( BINANCE:ETHUSDT ). We built and developed it on MetaEditor and optimized it with MetaTrader optimizer.
The main indicators are Donchian Channel, Oscillator of ROC, Bears Power, Balance of Power, and Simple Moving Average (SMA). Default values in the input panel are the best combination of these indicators, but you can change any of them and try it for better results.
Please notice that this strategy has been optimized on the 1-minute chart of Ethereum.
For each position, you can see the Take Profit (TP) and Stop Loss (SL) levels. Also, you can find the values of mentioned TP and SL in points from the input panel of the script.
Attention: The price of Ethereum has 2 decimal places.
Therefore, 3000 points for TP means 30 USDT for trading 1 BINANCE:ETHUSDT .

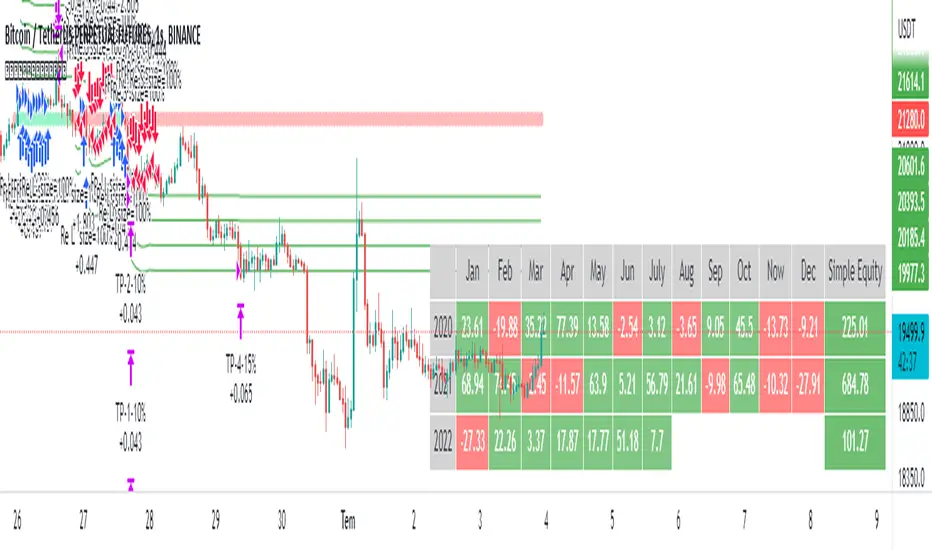
{Gunzo} Stock to Flow (Gold, Silver, Dollar, Bitcoin)This indicator displays the Stock to Flow (S2F) ratio for popular commodities (Gold, Silver, Dollar, Euro, Bitcoin, Ethereum) in order to
compare them and determine which ones could be a good Store of Value (SoV).
OVERVIEW :
Stock to Flow is a popular indicator used to predict commodities scarcity. It evaluates the total stock of a commodity against the total amount that can be produced during a year. This model supposes that if scarcity is increasing, the price is going to increase.
This model has been used over the last years on Bitcoin to determine if the asset was undervalued or overvalued, and even make prediction models on the future price.
This script is going to focus on the Stock to Flow ratio (total stock/amount produced) to compare the following assets over time :
Mining resources (mined) for Gold and Silver
Cryptos assets (mined) for Bitcoin and Ethereum
FIAT currencies (banknotes printed) for Dollar and Euro
CALCULATION :
The calculation of the Stock to Flow ratio evaluates the total stock of a commodity produced against the production made for a specific year. The data is calculated on a yearly basis, then interpolated to get monthly or daily values.
DATA ORIGIN :
The main information needed to calculate the Stock to Flow ratio is the "yearly production" of a commodity. I tried to retrieve that information from the most reliable sources :
for Gold from research on www.gold.org
for Silver from research on www.silverinstitute.org
for Ethereum from research on etherscan.io
for Bitcoin from data source "QUANDL:BCHAIN/TOTBC" from www.quandl.com
for Dollar from research on www.federalreserve.gov
for Euro from research on www.ecb.europa.eu
SETTINGS :
Smoothing for interpolated data : Smoothing factor for assets that are calculated yearly and then interpolated (Gold, Silver, Dollar, Euro, and Ethereum)
Smoothing for non interpolated data : Smoothing factor for assets that are calculated daily and not interpolated (Bitcoin)
Display asset names : Display assets names in a colored rectangle on the right side of the chart
Display asset values : Display assets Stock to Flow ratio in a colored rectangle on the right side of the chart
Display key events for assets : Display important events for the assets at the bottom of the chart using the same color as the assets lines (for example Orange diamond is a Bitcoin halving). Please refer to the script code for the details of all events.
USAGE :
This script can be used on any asset available on TradingView as the data used is either static or external.
However I recommend using it the Gold asset from currency.com as the depth of the chart will be bigger (since 1980s).
It is recommended to used this script on the monthly timeframe as the chart data is calculated yearly and then interpolated.

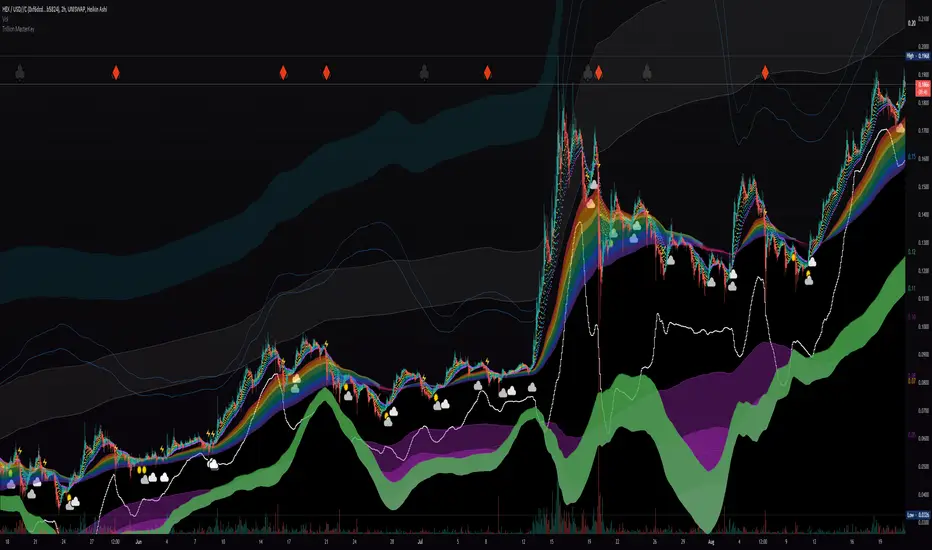
Liquidity Rainbow - Trillion ResearchThis indicator uses regression along with RSI and moving averages from multiple time frames to help you visualize the market in a single view. After learning the notations, you will be able to identify pockets of liquidity and determine high/low probability price zones without drawing a single line.
Booster symbols help confirm short term trends and breakouts based off of two waveform functions, one long period, the other with a much shorter period. You get the buy signal that everyone else sees plus the confirmation!
This is a system that is not fully developed, PNL is not available yet. Strategy version is coming soon, still back testing.
I am tuning this model for crypto specifically, although it works for anything with a price chart.
2 EMAs (configurable to MA)
Dragonskin - RGB circle plots eMA
Rainbow - RGB area plots eMA
+When you see the rainbow appear it means that the price is above the slowest ema baseline. Generally bullish as price tends to ride the rainbow. Ideally, you will see a white cloud at the origin.
-When you see white step line cutting into the upper colors of the rainbow.
Once the price has traded below the rainbow for the FIRST time, not just wicked. You can set a target that's just above the previous high bodys above the rainbow. Do not sell the dip, let the floppers flop.
The second time price cuts down through a thick rainbow is usually bearish .
What makes me so sure? Liquidity
In order to be successful, we need to understand liquidity, the juiciest pockets of profit.
I will reveal more of the strategy in the second script.
For now, use:
SUN symbol - Notice how the price always seems to come back and sweep up any SUNs that get left behind (up and down) this is a liquidity nugget
CLOUD(s) indicators of support. Meaning that on ema trend we expect a lower price but each time that happens, it gets bought up above baseline. weak->strong (little gray - light blue - white)
LIGHTNING indicator of resistance. Meaning the price is not being allowed to recover, each time it rises above baseline, it is sold down again.
YELLOW CROSS - Classically known as a whale manipulation indicator. It tends to indicate a strong bearish move incoming or the reversal of an ongoing bearish move. There's dumping. "Get ready something is happening" indicator.
HEARTS = BUY
SPADES = Buy
CLUBS = Sell
DIAMONDS = SELL
*do not use these during periods of consolidation. consolidation is a period when the price swings in both directions but not too much. In a narrow range the indicators can pop up.
Why does this happen?
Short periods, during which exchanges stabilize the prices, are necessary for the redistribution of assets over the course of trading. Sometimes they happen multiple times a week and can last 24 or 48hours. Also it is a great time to eat up algo traders and that's why you'll see noise.
You want to focus on the period immediately following a consolidations. Don't rush it, they really do take 20 hours+
If you realize that you are in one of these consolidation ranges, limit order the tips of the wicks, nothing in the middle. There is not much profit here but also there is minimal risk.
If you're confirmed in a consolidation, exchanges will work to buoy the price to the appropriate mark price even if there is a big buy/sell order. A lot of time price will go up the congruent amount afterwards to compensate the toxic vwap .
I hope this helps people see the bigger picture and become even more successful with bigger gains.
I've tested this on all the major cryptos. Bitcoin BTC Ethereum ETH HEX
Honestly, I have tested very few stonks with this, later.
-Market Enemy
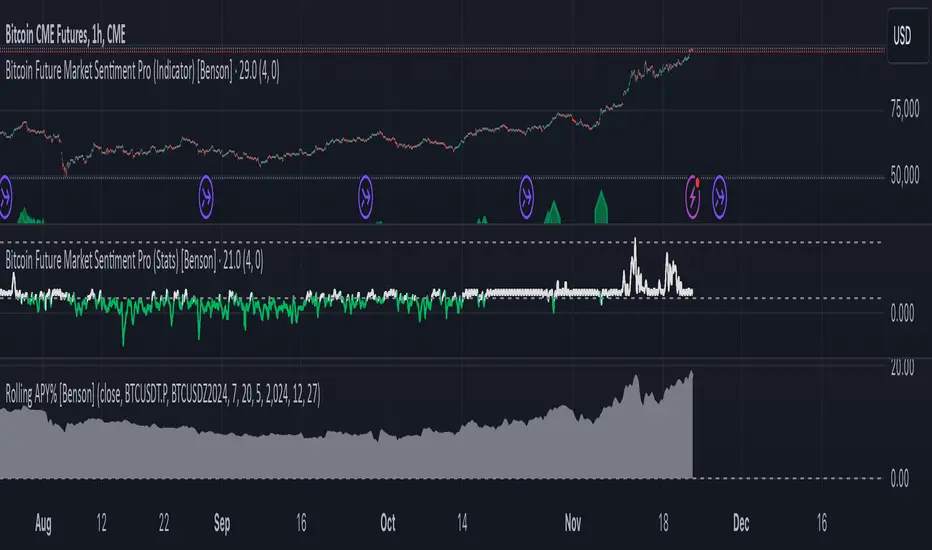
Rolling APY% [Benson]The indicator shows future rolling APY%.
Users can change the market by changing symbol. BTC is the default market.
Meanings of different BTC Rolling APY%:
Below 0 %= DOOMSDAY (it happened during the big crash on March 12, 2020)
0%-5% = extremely fearful
5%-10% = neutral
10%-15% = slightly optimistic
15%-20% = very optimistic
Above 20% = FOMO (it happened during the global top on 14 April, 2021)
Use this indicator to identify the arbitrage opportunities and the price top/bottom.
This is a paid indicator. Only for Sentiment Indicator subscribers.
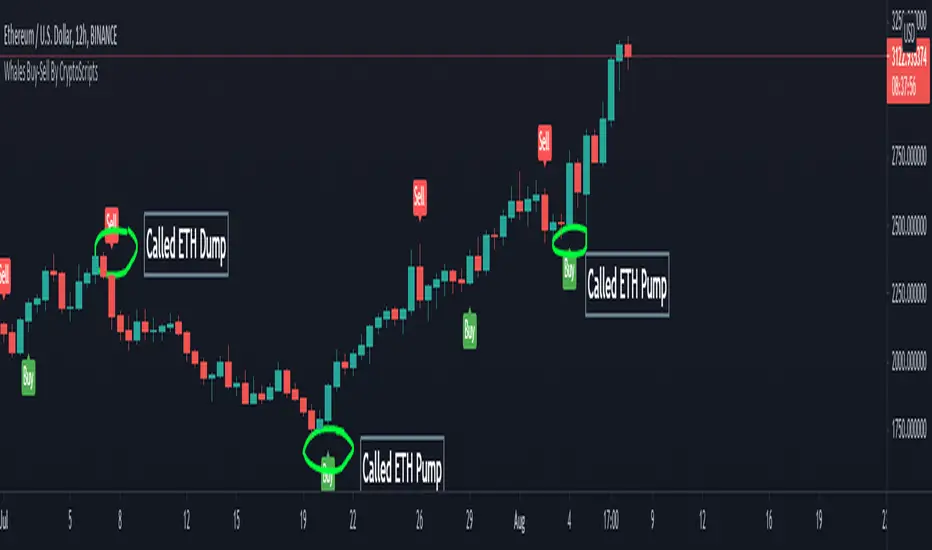
Whales Buy-Sell By CryptoScriptsThe Whales Buy-Sell indicator is very unique because it uses a combination of the smoothing range, average ranges, and hi-band/low-bands combined with various moving averages to nail whenever the overall trend is changing. This is extremely important during periods of high volatility and large moves. It helps to keep someone in a trade longer and get out fast if the trend is changing. The big caveat I can stress is waiting until the candle closes so that you know the signal is confirmed! Use the Bar Replay feature to further understand the intricacies of how the indicator produces signals. I find it is better on larger timeframes (1h and higher) because it's measuring larger trends. It can still be used on smaller timeframes but may not be as accurate. The big shortcoming is that is doesn't do well in choppy environments (i.e barely any price movement up or down) and you may get a lot of back and forth buy/sell signals so PLEASE keep that in mind. Experiment with various tickers/timeframes and see what works best for you :)
This indicator is a trend analysis indicator. Trend analysis is a technique used in technical analysis that attempts to predict future stock price movements based on recently observed trend data. Trend analysis is based on the idea that what has happened in the past gives traders an idea of what will happen in the future, but that is NOT always the case! Past performance is NOT indicative of future returns. There are three main types of trends: short-, intermediate- and long-term. Trend analysis tries to predict a trend, such as a bull market run, and then ride that trend until data suggests a trend reversal, such as a bull-to-bear market.
Alerts
You can set alerts for either a 'Buy Signal' or 'Sell Signal'. I recommend setting alerts for the candle close so that you know the signal is confirmed! If the "Add Alerts" option is greyed out for the indicator, just refresh your tradingview page and you should be able to see it :)
PM me to obtain access and please let me know if you have any questions!
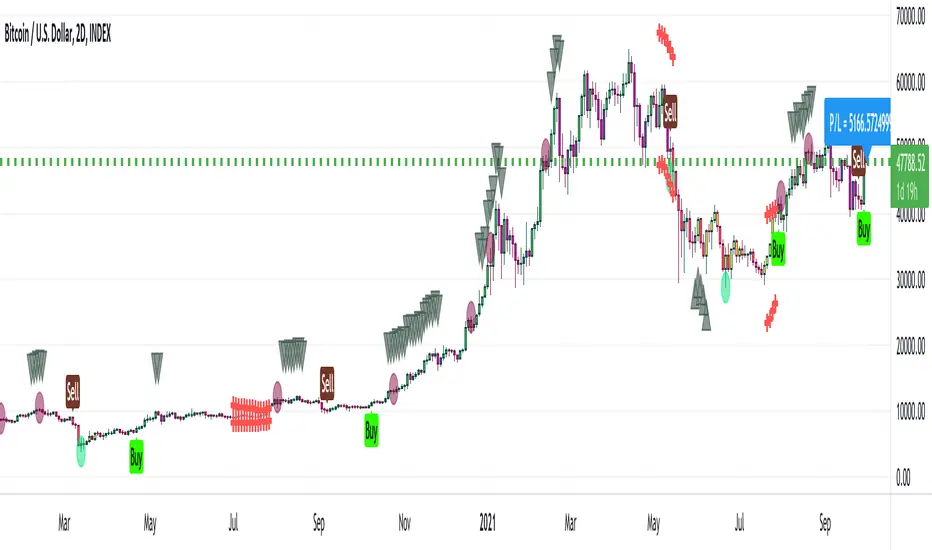
[Joy] Aladdin Long Trading Strategy 1.0.0 AlphaAladdin's Long trading strategy is to test out Aladdin for long trades only
This strategy is mainly used to test whether Aladdin is suitable for a coin/stocks/futures or for any trading. The profitability, average drawdown, average profits, etc are used by me to decide whether to use it for trading.
What is Aladdin and what does it do?
Using the volume and gradual flow of non-interrupted data (wicks and body of the candles), it tries to detect the macro condition of the market so that one may know in which direction the market is flowing.
* Bearish / Sell sign: On the candle's close, I open a short position
* Bullish sign: On the candle's close, I open a long position
* I take at least 50% profit when the indicator indicates to do so. One can configure that value as desired from the configuration depending on one's risk/money management. I might even convert some portion of the position into stable coins.
FAQ
Q: Does it use some EMA /MA/etc.? Does it use any indicator with tweaked settings?
Answer: No.
Q: What does it mostly depend on?
Answer: Volume and gradual flow of non-interrupted data. The logic depends purely on volume , price bars and the wicks.
Q: Does it work with all coins, stocks, futures, instruments?
Answer: I prefer to use the exchange with the best possible data. Then backtest out to find the best possible timeframe, stop loss and target all derived from this script data.
Q: Can you make it free or make it open source?
Answer: There is no free lunch in this world. I will never reveal or share the source code!
Q: Do you provide ongoing support for the indicator?
Answer: Yes, as long as I can, I will continue updating the indicator
Q: Are the bullish /buy & the bearish/sell markers automatic?
Answer: I have no control over the markers. It is driven purely by logic from the script.
Q: Is this financial advice?
Answer: This is not financial advice. I do not guarantee any profit or loss. I am not responsible for any of your losses or profits. My indicators do not assure profit or loss. It also does not auto-open or auto-close a trade.
Assumptions:
Only long trades are opened and closed. No short trades.
Starting Capital: $20,000
Order Size: 20% of Capital
Data used: Whatever data is available from 2011 till today on Trading view
Findings:
INDEX: BTCUSD 83% profitability using 2day tf
54 closed trades
Profit factor: 16
Sortino Ratio: 5.2
Average Winning Trade: 30%
Average Losing Trade: 9.12%
Largest Winning Trade: 1218%
Largest Losing Trade: 20.25%
Below are the profitability rate for the timeframe and the coins listed as found by running the trading strategy over the following as of today (Aug 1st 2021 12:40 pm Sydney Time).
⚜️ INDEX:BTCUSD 83% using 2day tf
⚜️INDEX:ETHUSD 80% using 1day tf
⚜️FTTUSD 81% using 2day tf
⚜️SRMUSD 71% using 1day tf
⚜️ADAUSDT 81% using 2day tf
⚜️ALGOUSD > 90% using 2day tf
⚜️ALTPERP 81% using 2day tf
⚜️AVAXUSDT 75% using 1day tf
⚜️BANDUSD > 90% using 2day tf
⚜️BCHUSD 82% using 2day tf
⚜️BNBUSD 79% using 1day tf
⚜️BNBUSD 85% using 2day tf
⚜️CHZUSD 71% using 1day tf
⚜️COMPUSD 81% using 1day tf
⚜️DOGEUSD 77% using 1day tf
⚜️EXCHPERP 83% using 1day tf
⚜️FILUSD > 90% using 1day tf
⚜️FTMUSD 70% using 2day tf
⚜️HTUSDT 75% using 2day tf
⚜️KINUSD >90% using 2day tf
⚜️LINKPERP 85% using 2day tf
⚜️LTCUSD 80% using 2day tf
⚜️MATICUSD 77% using 2day tf
⚜️NEOUSD 80% using 1day tf
⚜️NEXOUSD > 90% using 1day tf
⚜️OKBUSD 71% using 1day tf
⚜️OMGUSD 75% using 1day tf
⚜️RSRUSD 87% using 1day tf
⚜️RUNEUSD > 90% using 1day tf
⚜️SHITPERP > 90% using 1day tf
⚜️SOLUSD 84% using 1day tf
⚜️SUSHIUSD 71% using 1day tf
⚜️THETAUSD > 90% using 2day tf
⚜️UNIPERP 83% using 1day tf
⚜️VERTPERP > 90% using 1day tf
⚜️XAUUSD 63% using 2day tf
⚜️XTZUSD 83% using 2day tf
⚜️ZECUSD 72% using 2day tf
Disclaimer:
No one knows what will happen in the future. DYOR and decide on your own conditions. Do realize that neither I nor my indicator can guarantee any profit or loss. And there is no assurance that any trade will ever result in any profit. It is not financial advice.

RSVP Extractor By CryptoScriptsThis indicator has the same alerts as the VP Extractor except I overlaid the RSI on top of it (yellow line) to help take advantage when the RSI is overbought/oversold while also being able to see what the VP extractor is saying :)
It highlights yellow any time the RSI is below 30 (potential buy signal) and highlights orange anytime the RSI is above 70 (potential sell signal). You can also adjust the settings so that it'll highlight yellow when RSI is below 25 or 20 etc. so you can pick whatever value you want and the colors will adjust accordingly :) You can also set alerts for RSI overbought/oversold!
Please see the VP Extractor Alerts below! Those are still the same as before but since I now have RSI then you can be more confident in your signals if RSI is flashing a yellow shaded area (oversold) and the VP extractor is flashing a rocket symbol (buy), then both together would be a very strong buy signal. Using the RSI signals with the VP Extractor signals below will make you VERY successful with this indicator :)
The VP Extractor signals is a combination of the Volume Extractor and Price Extractor. There was a lot of coding involved in this one and it involves a Volume / Price Oscillator derived from various volume /price metrics combined with Bollinger Bands and Overbought/Oversold levels. This indicator is unique because it not only measures the standard deviations whenever the oscillator crosses outside the BBs but it does so at ranges that are most advantageous for the trader to identify KEY buy/sell levels (as shown above). I'll break down each signal below and how to best take advantage of them so you can get the best entries and capture the most profit per trade.
*This indicator works best on the Binance or Bybit exchange for crypto but also works for stocks and forex. It's best used on small-medium timeframes such as the 15min, 1h, 4h, 8hr, or 12h. It tends to give more false signals on the 1D timeframes and higher.
Red Alarm - this signal indicates that the volume and/or price oscillators are overbought and/or crossing outside of the bollinger bands . This is a STRONG sell signal but should still be combined with support/resistance levels and confirmed with other indicators.
Red Diamond - this signal indicates that the volume and price oscillators are crossing outside of the bollinger bands above the 20 level but is not yet overbought. This is a potential sell signal but should still be combined with support/resistance levels and confirmed with other indicators.
Red Shaded Area - this indicates the volume and price oscillators are overbought. This is a potential sell signal but should still be combined with support/resistance levels and confirmed with other indicators.
Rocket - this signal indicates that the volume and/or price oscillators are oversold and/or crossing outside of the bollinger bands . This is a STRONG buy signal but should still be combined with support/resistance levels and confirmed with other indicators.
Green Diamond - this signal indicates that the volume and price oscillators are crossing outside of the bollinger bands below the 20 level but is not yet oversold. This is a potential buy signal but should still be combined with support/resistance levels and confirmed with other indicators.
Green Shaded Area - this indicates the volume and price oscillators are oversold. This is a potential buy signal but should still be combined with support/resistance levels and confirmed with other indicators.
Input Options
Show 80 Levels - This checkbox will create a red zone and green zone for the 60-80 levels on the indicator. This is useful if the volume and price oscillators reaches one of these levels, you can be sure it's going to reverse soon and can have more confidence if it crosses outside of the BBs in addition to that.
VEO Length - This changes the height of the oscillator and will change how your signals flash (more or less often). Use this if you find you're getting too many signals or not enough. I find this is best at 21 but feel free to test out what works for you depending on your timeframe.
Moving Average Volume Source - This is currently set to None but you can change it to Exponential, Hull, or Simple moving average . I found that None works best but feel free to test out the different options.
Moving Average Length - Changing this length will do nothing to your chart if None is selected for the Moving Average Volume Source, therefore you will most likely keep this setting default at 9.
Alerts
I've set alerts on this indicator for each icon (Red Alarm, Red Diamond, Overbought, Rocket, Green Diamond, Oversold). I HIGHLY recommend setting the alerts for Candle Close so that you can be sure the signal is confirmed.
You may notice that the indicator can give multiple signals back-to-back or be overbought/oversold for multiple candles. When this happens, it's best to look at other indicators such as the RSI , MFI Pro, etc to nail the best entry and have confluence with your decision. With that said, having multiple signals back-to-back can also be an indication that the move is close to happening.
This indicator is a strong indicator by itself but works best when combined with my other indicators just as the Whales Buy-Sell and the MFI Pro as well as the RSI , and MACD i.e taking a trade when all indicators are showing overbought, "Buy", "Sell", etc. Measuring volume and price action is an extremely important aspect of trading and one I believe should not be overlooked. I hope I made everything as clear as possible and please let me know if I didn't.
PM me to obtain access and please let me know if you have any questions! :D

[Joy] Aladdin (1.0.0 Alpha)Explanation of the markers in the indicator
* Bearish / Sell sign: On the candle's close, I open a short position
* Bullish sign: On the candle's close, I open a long position
* Red circle: On the candle's close, I take at least 50% unrealized profit into a realized profit of any running long leverage position. I might even convert some portion of the position into stable coins.
* Green circle: On the candle's close, I take at least 50% unrealized profit into a realized profit of any running short leverage position. I might even convert some portion of the position into stable coins.
* Down Arrows: When the down arrow finishes and the candle close, I put a tighter stop loss of any running long leverage position. It sometimes indicates the local top.
* Up Arrows: When the up arrow finishes and the candle close, I put a tighter stop loss of any running short leverage position. It sometimes indicates the local bottom.
* Purple candle: Weakly bullish.
* Green candle: Strongly bullish
* Red candle: Strongly bearish
* Yellow candle: Weakly bearish
FAQ
Q: Does it use some EMA /MA/etc.? Does it use any indicator with tweaked settings?
Answer: No.
Q: What does it mostly depend on?
Answer: Volume and gradual flow of non-interrupted data. The logic depends purely on volume, price bars and the wicks.
Q: Does it work with all coins, stocks, futures, instruments?
Answer: I prefer to use the exchange with the best possible data. Then backtest out to find the best possible timeframe, stop loss and target all derived from this script data.
Q: Can you make it free or make it open source?
Answer: There is no free lunch in this world. I will never reveal or share the source code!
Q: Do you provide ongoing support for the indicator?
Answer: Yes, as long as I can, I will continue updating the indicator
Q: Are the bullish /buy & the bearish /sell markers automatic?
Answer: I have no control over the markers. It is driven purely by logic from the script.
Q: Is this financial advice?
Answer: This is not financial advice. I do not guarantee any profit or loss. I am not responsible for any of your losses or profits. My indicators do not assure profit or loss. It also does not auto-open or auto-close a trade.
Note:
The Aladdin has been derived from the Super Algorithm Indicator. I have depreciated the Super Algorithm Indicator I have automatically migrated every user to Aladdin, who had Super Algorithm Indicator. One should not use the SA indicator. One should start using this indicator instead.
Version 1
A derived version of Super Algorithm Indicator with optimized code (uses arrays, removes few warnings in the code, makes code more reusable) so that I can add further features in the future. A few new coding features in the pine script encouraged me to go for this version. Since the codebase has been revamped, it made sense for me to make it a new indicator. have also changed a small parameter that is configurable at the moment. Previously it was valued at 26. Now I am putting value at 21.
Aggregated Volume Colored (Bitcoin, ETH, Altcoins, everything)BITSTAMP:BTCUSD
This indicator aggregates trading volume data of up to 10 symbols and can display the individual data by color.
It is useful for assets which are traded on multiple exchanges, like cryptocurrencies, commodities, forex and derivatives showing you what is happening across the market and on the individual exchanges to give you beter insights.
You can change the symbols from which the indicator gathers data in the settings under inputs, just like the colors, and you can add a moving average.
By default trading volume is aggregated from the following symbols:
Binance, BTC /USDT
Binance, BTC /BUSD
Bingbon, BTC /USD
Huobi, BTC /USDT
OkeX, BTC /USDT
Coinbase, BTC /USD
Bitfinex, BTC /USD
Gemini, BTC /USD
Kraken, XBT/USD
Bitstamp, BTC /USD

GMMAs v2.0 CRYPTO [badshah_e_alam]Hello Traders ,
The GMMAs v2.0 CRYPTO strategy stands for gap modified moving averages designed for cryptos. This is a non Repainting Indicator.
This strategy version is a advanced and modified to one of my previously published indicator named as "gap modified moving average".
I am using my Modified Moving Average indicator for a while. I always wanted to add some more information to moving
averages and made some modification to Moving averages.
The additional Information I have added to the Moving Average helps it to act more quickly based on the price of that
particular asset.
How is strategy gives signals?
when the GMMA'w cross over or cross under the GMMA'y than a trade is taken depending on the filter status.
Info about the settings :
The default setting is for 11m ETHUSD , it works with other cryptos and other timeframe as well . For other timeframes it need to be fine tuned and need little change.
The first category is for the selection of Moving average to be modified and the source to be used for that moving average .
I have added seven moving averages to choose between. SMA works good for me , you can choose and play with other MAs.
following are the option to choose MAs
1.EMA
2.SMA
3.HMA
4.RMA
5.WMA
6.VWMA
7.SWMA
Next option in setting is GMMA'y and GMMA'w :
these two settings define the length and lookback period of the MA you have choosed above.
The length is similar to the length of the moving average chosen to be modified.
The lookback option will look for that number of bars for the modification.
GMMA'w is more sensitive than the GMMA'y. So make sure that the setting input of the GMMA'y is significantly larger than the
GMMA'w.
FILTER:
I have added TradingView inbuilt SUPERTREND as a filter in the strategy, it works very good in filtering out false trades
you can enable/disable it in the settings.
EXIT strategy:
The exit Strategy is based on ATR, Take profit and SL are decided by the ATR in the SL/TP setting option. You can change the RR ratio in the setting.
The backtest settings are as follow:
Initial capital:10k
Initial Commission = 0.000
Initial Pyramiding = 0
Reference :
Thanks to pinecoders and Tradingview community.
my previous gap modified moving average version is :https://in.tradingview.com/script/e3WestBa-Gap-Modified-Moving-Average/
watermark added from:
color gradient framework picked from :https://in.tradingview.com/script/hqH4YIFa-Color-Gradient-Framework-PineCoders/
DISCLAIMER
Any and all liability for risks resulting from investment transactions or other asset dispositions carried out by the user based on information received or a market analysis is expressly excluded by me.
All the information made available here is generally provided to serve as an example only, without obligation and without specific recommendations for action. It does not constitute and cannot replace investment advice. We therefore recommend that you contact your personal financial advisor before carrying out specific transactions and investments.
Do your own research and Risk management before taking any trade.

CryptoKillerCryptoKiller is a trend following trading system. It provides entry and exit points, a money management system and a trade management system.
The entry points (fuchsia line) are determined by CryptoKiller Oscillator (see other published script to understand how the oscillator works).
The trade management system provides the exit points in profit and in loss. This script works with multiple take profits (green lines), the initial position is liquidated little by little as the trend reaches the profit targets. Trade management also provides trailing stop exits to save the remaining profits.
Stop loss (red line) take into account the recent past of the chart to be determined, while take profits are fixed and have been calculated based on historical volatility.
The money management system is very simple, it plans to enter a position with a fixed percentage with respect to equity.
CryptoKiller, during an operation, also draws supports and resistances on the chart - determined by the oscillator (orange lines) these supports and resistances are used as a filter to understand where there is the greatest probability of trend development (some entry points provided by the oscillator will therefore not be considered by CryptoKiller as entry points, as in disagreement with the traced supports / resistances).
We know that an error appears in the backtest calculation, where the script is said to suffer from a bias, so the backtest calculation may not be accurate. Actually this happens in high times like H4 or daily, but CryptoKiller is not designed for these timeframes. it is a short-term strategy.
For more information read the author's instructions to contact us, we will send a PDF file with a more complete explanation of the strategy accompanied by screenshots.
Access to this script is granted along with access to CryptoKiller Oscillator.
Aggregated Perpetuals BasisCONCEPT
The aggregated perpetuals basis compares the prices of perpetual swap contracts in crypto (or "perps" for short) with the price of the spot market.
The idea behind this is that it can help you analyse whether the derivatives market is being overly bullish or bearish.
When the indicator shows positive values (grey colouring by default) it means that perps are trading at higher prices than spot.
Generally speaking we say this is bearish or at least not an ideal scenario to long yourself because most of the time this means that derivatives market participants are too aggressive (overbought territory).
Vice versa when the indicator shows negative values (green colouring by default) it means that there's a spot premium which is considered bullish.
A spot driven market is a healthy market. There could also be a spot premium because market participants that are trading perps are aggressively shorting which puts them at risk of getting short squeezed (again, bullish).
FEATURES
The indicator works for both BTC and ETH.
It's aggregated because it looks at the prices of multiple contracts and it's also volume weighted so that more important markets have a bigger impact.
There are three different types of premiums you can select: coin margin, dollar margin or the combined version.
In crypto there are two types of perpetual swap contracts. Contracts that work with coin margin and contracts that work with dollar margin, which is mostly USDT although FTX for example also accepts other collateral. Sometimes these contracts trade at slightly different prices and you'll notice that there's also a shift in bullishness and importance between these contracts from time to time.
However most of the time the values will be very similar for coin margin and dollar margin.
Markets used for the coin margin perps:
Binance
Bybit
Deribit
Markets used for dollar margin perps:
Binance
Bybit
FTX
The combined premium combines them all.
The spot indices used are:
BXBT (for BTC)
BETH (for ETH)
By default it uses "close" as candle source which means it looks at the premium as if the candle were to close right now.
If you're looking at higher timeframes I suggest using "ohlc4" because there's a lot that happens within one daily candle for example so you might want to use an average candle price (ohlc4 = open+high+low+close/4)
There's a "clamp" feature which puts a cap on extreme values.
Sometimes during capitulation events there's a massive spot premium which dwarfs all the other values and that makes the indicator unreadable.
In such cases the clamp helps to make the indicator useful again.
As you can see I created support and resistance zones (which you can turn off) that max out at 0.4% for bitcoin because by looking at historical data it seems that the premium almost never moves outside of those thresholds (except for those few exceptions during liquidation cascades).
There's also an option to smooth out the values.
TRADING
As discussed earlier, a spot premium is generally speaking considered bullish and a derivatives premium is considered bearish.
It doesn't give buy an sell signals, but it helps you with establishing a bias and gauging general market sentiment.
This in turn can help you with deciding what side of the trade to take and it shows if the conditions are still favourable for you to take the trade you want, because a spot premium for example usually leads to negative funding which makes it interesting to go long.
Send me a private message if you want access so we can discuss it.
Cheers.
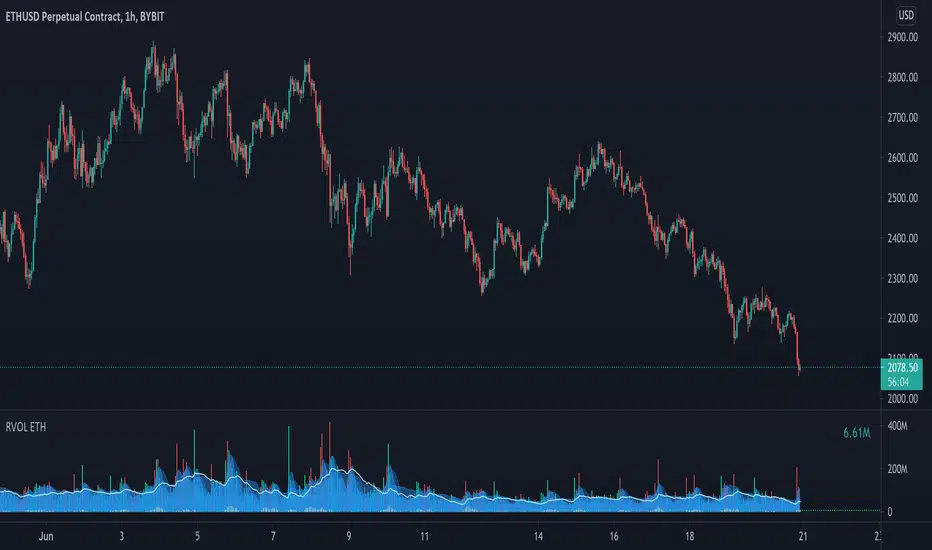
Relative Volume - ETHEREUMRelative Volume indicator that pulls data from 9 different Ethereum exchanges. Please note that this indicator only works with ETH and will not use data from your current chart.
Includes the following exchanges:
BYBIT:ETHUSD
BITFINEX:ETHUSD
BITSTAMP:ETHUSD
INDEX:ETHUSD
COINBASE:ETHUSD
FTX:ETHUSD
PHEMEX:ETHUSD
BITTREX:ETHUSD
POLONIEX:ETHUSDT