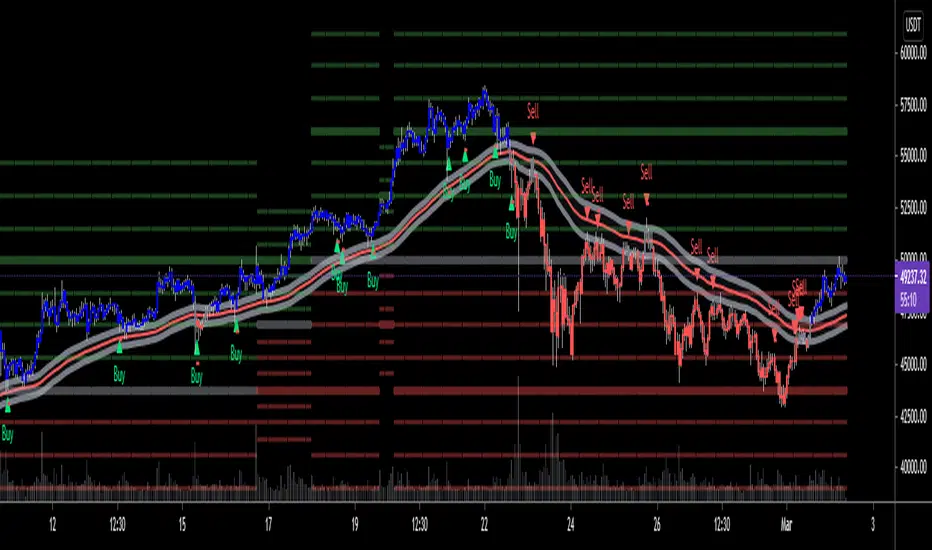
Crypto EMA Trend Reversal StrategyThis is an EMA crossover strategy which involves 5 EMAs to trigger trades. The strategy has two take profit settings and uses a stop loss.
TP1 and SL are based on ATR and TP2 is an EMA crossover.
The strategy goes both long and short and the default settings work particularly well as a scalping strategy for ETHUSDT on the 5M time frame.
I have also created another version with tweaked settings for scalping LINKUSDT on the 5M with very similar results.
There is an option to add a volume condition parameter within the script on lines 26-28 which can be added to the end of lines 34-35 in the following format: and vol_cond
I personally don't currently use the volume condition parameter.
Ethereum (Criptovaluta)

MACD EMA - TradingRush StrategyHey there!
Today I present you a rather simple, but very profitable MACD strategy. Since I trade it with cryptocurrencies, the settings have been adjusted.
I discovered the strategy on a YouTube channel and tried to transfer it as a strategy into a script.
Tested with the crypto pair ETH/USDT in the 15 minute chart.
There is the possibility to switch between short and long positions.
-----------------------------------------------------------------------------------
How does the strategy work?
ENTRY
The MACD indicator must cross below the histogram. If it crosses when the price is below the EMA, only short positions are traded. Above the EMA - long.
EXIT
The Lowest Low (long) / highest high (short) serves as the stop loss. The TP is formed on the basis of a factor. (SL multiplied by factor 2.1 = TP).
The red lines are used to illustrate the SL. Above for short positions below for long positions.
The results of the strategy are without commissions and levers.
If you have any questions or feedback, please let me know in the comments.
If you need more information about the strategy and want to know exactly how to apply it, check out my profile.
I wish you good luck with the strategy!

INDICES against BTC & ETHThe idea is the following; you can easily chart the FTX perp indices against (currently) two baselines, ETH & BTC.
I always choose ETH since it is way harder to outperform ETH at the moment. Doing this helps me see certain trends and/or fractal that might happen again in the future.
Since I already made D.A.M (Defi against Majors / Pricing Defi categories against BTC & ETH: ) I came across the idea of doing the same thing but with the perp indices that FTX offer. At first, I wanted to add this to D.A.M but it has no place in this indicator since this will not only look at Defi but the macro market as a whole.
The indicator currently only looks at the following indexes (weighting can be found here: https:// help. ftx. com/hc/en-us/articles/360027668812-Index-Calculation) :
DRGN: THE DRAGON INDEX
ARPA, BTM, IOST, NEO, NULS, ONT, QTUM, TRX, VET
ALT: ALTCOIN INDEX
BCH, BNB, EOS, ETH, LTC, XRP, TRX, DOT, LINK, ADA
MID: THE MID CAP INDEX
ALGO, ATOM, BAT, CRO, DASH, DCR, DOGE, HT, IOTA, LEO, NEO, OKB, ONT, QTUM, VET, XEM, XLM, XMR, XTZ, ZEC, ZRX, OMG, COMP, BSV, FTT, YFI, UNI, SNX, MKR, AAVE
SHIT: THE SHITCOIN INDEX
AE, AION, ARDR, ARPA, BCD, BEAM, BTG, BTM, BTS, BTT, CHZ, CKB, DGB, ELF, ENJ, GNT, GRIN, GT, HBAR, HC, ICX, IOST, KMD, KNC, LAMB, LRC, LSK, MANA, MATIC, MCO, NANO, NULS, OMG, POWR, PUNDIX, REN, REP, RVN, SC, SNT, STEEM, THETA, TOMO, VSYS, WAVES, XVG, XZC, ZEN, ZIL, ZRX
PRIV: THE PRIVACY INDEX
BEAM, DCR, GRIN, KMD, XMR, XVG, XZC, ZEC, ZEN
DEFI: THE DECENTRALIZED FINANCE INDEX
KNC, MKR, ZRX, REN, REP, SNX, COMP, TOMO, RUNE, CRV, DOT, LINK, MTA, SOL, CREAM, BAND, SRM, SUSHI, SWRV, AVAX, YFI, UNI, WNXM, AAVE, BAL
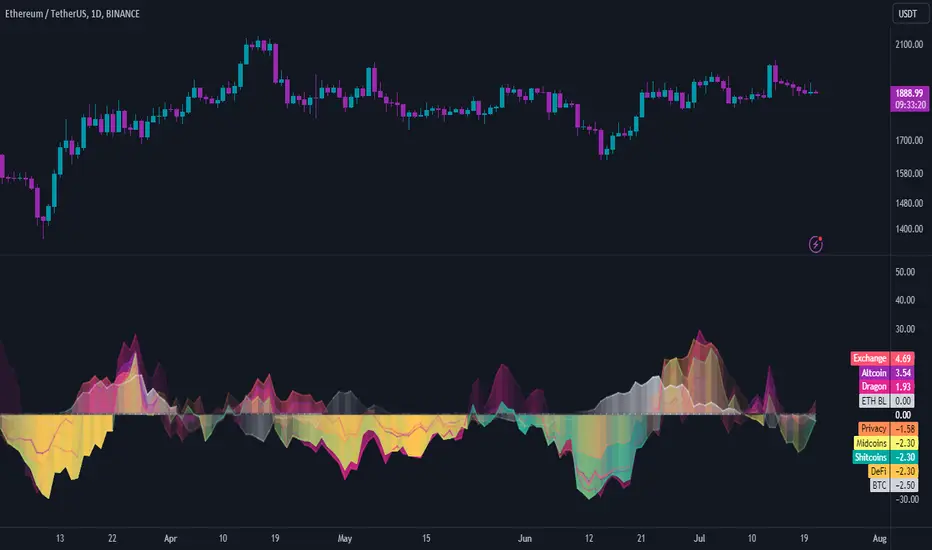
Crypto RSI Oscillator [marksc]This is my main indicator of pricing trend reversals.
It consists of two main indicators:
1. The green/red oscillator shows a general rising (green) or falling (red) price trend over a smoothed average of a number of periods (length).
2. The yellow "OverUnder Line" shows the Relative Strength Index adjusted price trend in real time.
How to use it:
- You will need to adjust the Overbought and Underbought (green and red) horizontal lines such that the yellow line rarely peaks past them. This will depend on historical data and the time-scale you're using. So if you configure it on a 15minute timescale and then switch to hourly the lines will need-readjusted. This is because the yellow line's movement is "Relative" to a number of periods of time in the timescale.
Predicting Pricing Reversals:
Adjust the Overbought and Underbought lines such that, in the past, the yellow line has rarely peaked over or under them.
When the yellow line peaks over or under one of the Over/Underbought lines again the price will likely make a strong reversal.
(Conversely, if the yellow line is not peaking but staying mostly flat or only slightly angled then the pricing trend is likely to continue.)
Predicting "Pump and Dumps":
If the price makes a sharp reversal while the yellow line was far from the over/underbought lines (ie. the yellow line was near the center), this indicates that a larger purchase or sale than has happened in a long time just happened. In most cases the price will quickly correct back to where it was because this sharp price reversal was was abnormal over the length*period used in the RSI calculation.


Ethereum Perpetual SwapsThis script track most important Ethereum Perpetual Swaps vs Spot basis
When strong green color emerge implies that Swaps are trading at premium to spot.
When strong red color emerge implies that Swaps are trading at discount to spot.
These information is useful because it give leading information towards where funding rates are heading.
When trading at premium it will push towards Positive Funding Rates (Longs pay Shorts)
When trading at discount it will push towards Negative Funding Rates (Shorts pay Longs)
It's can also be used to give identify potential local tops or bots when values get too extreme.

(D7R) FTX Ethereum FuturesEthereum FTX Contract Futures Price with 3 different value display modes. (Percentage, Delta, Absolute).
This information can be used to understand when futures are trading at relative strong/weak premium or discount against each other.
This information can either be used for cash-n-carry arbitrage, inter-exchange arbitrage, hedging or directional price speculation.
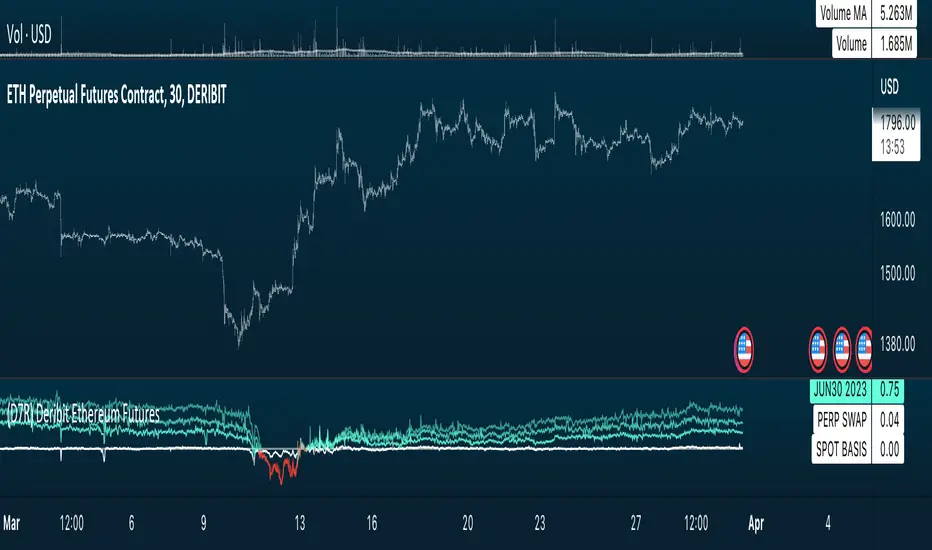
(D7R) Deribit Ethereum FuturesEthereum Deribit Contract Futures Price with 3 different value display modes. (Percentage, Delta, Absolute).
This information can be used to understand when futures are trading at relative strong/weak premium or discount against each other.
This information can either be used for cash-n-carry arbitrage, inter-exchange arbitrage, hedging or directional price speculation.

Price DEFI Categories against BTC & ETH/* Work in progress. The indicator is not finished. *\
The indicator shows the pricing of 3 DEFI categories against 2 possible baselines, BTC and ETH.
To do:
* Make a simple array in the source code to enter and remove new projects to the category. -> Maybe can also make it so that the source code does not have to be altered (projects can be added through input etc.)
* Adjust weightings depending on project data but this is not as important since weightings are being priced in by the market.
* Try to find a way to update input to string instead of booleans. As of currently, I could not seem to use input strings into plot functions because of an error.
* and more. Leave some feedback, that would be highly appreciated!

Hourly Scalp Engine◆ Purpose of this Script
The Hourly Scalp Engine (HSE) is designed to show scalp long opportunities on lower timeframes (H, 2H or 4H) based on a Fibonacci-valued MA-like structure. It was tested for Bitcoin and Ethereum, with the 2H timeframe seemingly giving the best test results. The chart shows a few instances where the price crossed below the HSE to trigger an entry (marked manually with arrows).
◆ Settings
Default scaling input (10.6) is tuned for Ethereum (ETH/USD) on Kraken.
Scaling input for Bitcoin (XBT/USD) on Kraken: 10.4.
Reasonable timeframes: H, 2H, 4H. Recommended timeframe: 2H.
You should probably set an alert for when Price crosses under the HSE.
◆ Instructions
As this is purely a scalp engine (and not feasible for long-term trades), the instructions have to be followed precisely for intended functionality:
As soon as Price crosses below the HSE, contemplate if you want to scalp, i.e. check current price, other indicators and market conditions. If yes, enter a scalp long. Do not enter the trade if : price has crossed above the HSE already and sits more than 1 % above it, or the down-wick was so deep and quick that it already retraced 10 % to the upside from the wick low (even if price is still below the HSE). In both cases it might be too late to enter.
Watch the 2H candle, at which you entered the trade, closing. Draw a 10 % price range from the wick low to the upside. The range high is your exit point. Set a take profit trigger there. Set a stop loss slightly below the wick low.
Observe the price action for the next 6 hours (i.e. the next three 2H candle closes). If price bounces up and hits the target, you exit with 10 % gains. If price hasn't moved to the target after 6 hours, close the trade at current price. If the stop loss should be hit in the meantime, you will have closed the trade automatically. The 10 % gain as a target was chosen because it seems to be hit very often, while higher targets are not reliably hit.
◆ Example Trade
Shown below is an example trade with correct drawing of the 10 % price range.
◆ Viability
From backtesting this should be a viable strategy for most instances where the HSE is crossed. However the HSE is not as hard as a boundary as e.g. the Confidence Bands (also published by DeanTrader), so that price can and will sometimes breach through (= close below) the HSE (as e.g. in the case of the March 2020 black swan event). Still even there a profitable trade could have been performed on the first bounce dependent on actual entry, although more risky due to very high volatility. Before using the HSE please make yourself familiar with the price action history of the considered asset and review the instances where the price crossed below the HSE in connection with the rules laid out in "Instructions" to understand the system and how to execute the trades. Also note that scalp trades are generally harder to perform than slower-paced swing trades, as timing becomes much more important and noise becomes relevant.
◆ Access
For access to this indicator please contact me via DM on TradingView or on Twitter (linked on my TradingView profile and in my signature).

ELIA MULTI INDICATORS STRATEGYExperimental multi indicators strategy, to catch right entry and avoid noise.
Each indicator included in the strategy, assume a value based on its status and because is a trend-follow strategy, some indicator value are higher then the other
Backtested on ETHUSDTPERP
BINANCE:ETHUSDTPERP

Scalping Dips On Trend (by Coinrule)Coinrule's Community is an excellent source of inspiration for our trading strategies.
In these months of Bull Market, our traders opted mostly on buy-the-dips strategies, which resulted in great returns recently. But there has been an element that turned out to be the cause for deep division among the Community.
Is it advisable or not to use a stop-loss during a Bull Market?
This strategy comes with a large stop-loss to offer a safer alternative for those that are not used to trade with a downside protection.
Entry
The strategy buys only when the price is above the Moving Average 50 , making it less risky to buy the dip, which is set to 2%.
The preferred time frame is 1-hour.
The stop-loss is set to be quite loose to increase the chances of closing the trade in profit, yet protecting from unexpected larger drawdowns that could undermine the allocation's liquidity.
Exit
Stop loss: 10%
Take Profit: 3%
In times of Bull Market, such a trading system has a very high percentage of trades closed in profit (ranging between 70% to 80%), which makes it still overall profitable to have a stop-loss three times larger than the take profit.
Pro tip: use a larger stop-loss only when you expect to close in profit most of the trades!
The strategy assumes each order to trade 30% of the available capital and opens a trade at a time. A trading fee of 0.1% is taken into account.

ETH Perp Volume Per ExchangeETH aggregated volume of perpetual swap contracts in stacked or indexed format, denominated in US dollars.
Gives you a simple overview of which markets account for the most volume.
Markets included:
Binance
Huobi
Bybit
Bitmex
FTX
Deribit
Kraken
In the settings you can exclude/include markets.
Do this in the input settings, NOT in the style settings (or the calculations will be messed up).
It's free so just add it to your favourites and you can use it

ETH Spot Volume Per ExchangeETH aggregated spot volume in stacked or indexed format, denominated in US dollars.
Give you a simple overview of which markets account for the most volume.
Markets included:
Binance
Okex
Huobi
Coinbase
Bitfinex
Bitstamp
FTX
In the settings you can exclude/include markets.
Do this in the input settings, NOT in the style settings (or the calculations will be messed up).
It's free so just add it to your favourites and you can use it

Volume Extractor By CryptoScriptsThe Volume Extractor is an indicator I've been working on for awhile that involves a Volume Oscillator derived from various volume metrics combined with Bollinger Bands and Overbought/Oversold levels. This indicator is unique because it not only measures the standard deviations whenever the oscillator crosses outside the BBs but it does so at ranges that are most advantageous for the trader to identify KEY buy/sell levels (as shown above). I'll break down each signal below and how to best take advantage of them so you can get the best entries and capture the most profit per trade.
*This indicator works best on the Binance or Bybit exchange for crypto but also works for stocks and forex. It's best used on small-medium timeframes such as the 15m, 1h, 4h, 8hr, or 12h. It tends to give more false signals on the 1D timeframes and higher.
Red Alarm - this signal indicates that the volume oscillator is overbought AND is crossing outside of the bollinger bands . This is a STRONG sell signal but should still be combined with support/resistance levels and confirmed with other indicators.
Red Diamond - this signal indicates that the volume oscillator is crossing outside of the bollinger bands above the 20 level but is not yet overbought. This is a potential sell signal but should still be combined with support/resistance levels and confirmed with other indicators.
Red Shaded Area - this indicates the volume oscillator is overbought. This is a potential sell signal but should still be combined with support/resistance levels and confirmed with other indicators.
Rocket - this signal indicates that the volume oscillator is oversold AND is crossing outside of the bollinger bands . This is a STRONG buy signal but should still be combined with support/resistance levels and confirmed with other indicators.
Green Diamond - this signal indicates that the volume oscillator is crossing outside of the bollinger bands below the 20 level but is not yet oversold. This is a potential buy signal but should still be combined with support/resistance levels and confirmed with other indicators.
Green Shaded Area - this indicates the volume oscillator is oversold. This is a potential buy signal but should still be combined with support/resistance levels and confirmed with other indicators.
Input Options
Show 80 Levels - This checkbox will create a red zone and green zone for the 60-80 levels on the indicator. This is useful if the volume oscillator reaches one of these levels, you can be sure it's going to reverse soon and can have more confidence if it crosses outside of the BBs in addition to that.
VEO Length - This changes the height of the oscillator and will change how your signals flash (more or less often). Use this if you find you're getting too many signals or not enough. I find this is best at 21 but feel free to test out what works for you depending on your timeframe.
Moving Average Volume Source - This is currently set to None but you can change it to Exponential, Hull, or Simple moving average . I found that None works best but feel free to test out the different options.
Moving Average Length - Changing this length will do nothing to your chart if None is selected for the Moving Average Volume Source, therefore you will most likely keep this setting default at 9.
Alerts
I've set alerts on this indicator for each icon (Red Alarm, Red Diamond, Overbought, Rocket, Green Diamond, Oversold). I HIGHLY recommend setting the alerts for Candle Close so that you can be sure the signal is confirmed.
You may notice that the indicator can give multiple signals back-to-back or be overbought/oversold for multiple candles. When this happens, it's best to look at other indicators such as the RSI , MFI Pro, etc to nail the best entry and have confluence with your decision. With that said, having multiple signals back-to-back can also be an indication that the move is close to happening.
This indicator is a strong indicator by itself but works best when paired with my Price Extractor indicator i.e taking a trade when both indicators are displaying overbought/oversold or crossing outside of the bollinger bands . Measuring price action is an extremely important aspect of trading and one I believe should not be overlooked. I hope I made everything as clear as possible and please let me know if I didn't.
PM me to obtain access and please let me know if you have any questions!

Lash Out OscillatorPurpose of this Script
The Lash Out Oscillator (LOO) is designed to indicate local tops and bottoms of the considered asset when the price considerably 'lashes out', based on normalized price deltas. It also features divergences that can be used for trading. The LOO is mainly used for Ethereum (ETH) and Bitcoin (BTC), but can in theory be used for every asset. Customization of the input settings is then needed to match the boundaries well to the historic price data. The default parameters are tuned for Ethereum.
Settings
Default input settings are tuned for Ethereum (ETH/USD) on Kraken on daily (D) timeframe.
Generally best used on daily (D) timeframe. You might also want to test the 4-hourly (4H) timeframe.
After applying the indicator to the chart, one typically has to zoom into the oscillator as the raw price delta is also plotted (in blue) which often overshadows the oscillator in magnitude.
For all other assets besides Ethereum, the oscillator and boundary values have (very likely) to be adjusted.
All individual pieces can be hidden from the chart (especially important as one might want to hide the blue raw price delta as it could disturb the process of tuning the oscillator due to automatic zoom-outs).
Input Settings for Bitcoin
Aside from Ethereum (default settings), I provide the following settings which can be used for Bitcoin (BNC:BLX) on daily (D) timeframe:
Averaging Length: 20
Donchian Length: 40
Donchian Scaling: 0.2
Fixed Red High: 6.1
Fixed Red Low: 2.3
Fixed Green High: -2.3
Fixed Green Low: -6.1
Still, feel free to tune the LOO to your liking.
Differences to Classic Oscillators as e.g. Relative Strength Index (RSI)
Classic oscillators as the RSI feature fixed limit values (e.g. 0 to 100 for the RSI) and are therefore (as the name says) very relative (you cannot reliably guess tops or bottoms just from the RSI value). The LOO features non-fixed limit values (they can theoretically go to infinity, but are in practice very well contained within some range), leading to less relativity and more absolute behaviour, which is beneficial in spotting local tops and bottoms. Just as the RSI, the LOO shows (bullish and bearish) divergences on the chart, which can be used for refined trading.
Interpretation
Given are two boundary types:
Fixed boundary areas
Donchian channels
Normally one should look out for the LOO to hit the red or green fixed boundary areas. Although the range is in theory infinite, the fixed areas give good hints when a local top could be hit, at least for the Ethereum case. For additional trades one can look for the LOO to hit the Donchian channels. Note that these areas/channels have to be adjusted by hand for all other assets besides Ethereum. General trading ideas are:
After the red (green) area is hit, a short- to mid-term (depends on market phase) short/hedge (long) trade might be in order.
During full bullruns (bearmarkets), the LOO can extend a bit more into the red (green) area. Here look out for bearish (bullish) divergences to possibly enter mid-term trades.
After the upper (lower) Donchian channel is hit, a short/hedge (long) trade could be wagered.
Alerts
Alerts are built-in that trigger when the LOO crosses into the red or green fixed boundary regions.
Access
For access to this indicator please contact me via DM on TradingView or on Twitter (linked on my TradingView profile and in my signature).

Price Extractor By CryptoScriptsThe Price Extractor is an indicator I've been working on for awhile that involves a Price Oscillator derived from various moving averages combined with Bollinger Bands and Overbought/Oversold levels. This indicator is unique because it not only measures the standard deviations whenever the oscillator crosses outside the BBs but it does so at ranges that are most advantageous for the trader to identify KEY buy/sell levels (as shown above). I'll break down each signal below and how to best take advantage of them so you can get the best entries and capture the most profit per trade.
*This indicator works best on the Binance or Bybit exchange for crypto but also works for stocks and forex. It's best used on small-medium timeframes such as the 15m, 1h, 4h, 8hr, or 12h. It tends to give more false signals on the 1D timeframes and higher.
Red Alarm - this signal indicates that the price oscillator is overbought AND is crossing outside of the bollinger bands. This is a STRONG sell signal but should still be combined with support/resistance levels and confirmed with other indicators.
Red Diamond - this signal indicates that the price oscillator is crossing outside of the bollinger bands above the 20 level but is not yet overbought. This is a potential sell signal but should still be combined with support/resistance levels and confirmed with other indicators.
Red Shaded Area - this indicates the price oscillator is overbought. This is a potential sell signal but should still be combined with support/resistance levels and confirmed with other indicators.
Rocket - this signal indicates that the price oscillator is oversold AND is crossing outside of the bollinger bands. This is a STRONG buy signal but should still be combined with support/resistance levels and confirmed with other indicators.
Green Diamond - this signal indicates that the price oscillator is crossing outside of the bollinger bands below the 20 level but is not yet oversold. This is a potential buy signal but should still be combined with support/resistance levels and confirmed with other indicators.
Green Shaded Area - this indicates the price oscillator is oversold. This is a potential buy signal but should still be combined with support/resistance levels and confirmed with other indicators.
Input Options
Show 80 Levels - This checkbox will create a red zone and green zone for the 60-80 levels on the indicator. This is useful if the price oscillator reaches one of these levels, you can be sure it's going to reverse soon and can have more confidence if it crosses outside of the BBs in addition to that.
PEO Length - This changes the height of the oscillator and will change how your signals flash (more or less often). Use this if you find you're getting too many signals or not enough. I find this is best at 21 but feel free to test out what works for you depending on your timeframe.
Moving Average Price Source - This is currently set to None but you can change it to Exponential, Hull, or Simple moving average. I found that None works best but feel free to test out the different options.
Moving Average Length - Changing this length will do nothing to your chart if None is selected for the Moving Average Price Source, therefore you will most likely keep this setting default at 9.
Alerts
I've set alerts on this indicator for each icon (Red Alarm, Red Diamond, Overbought, Rocket, Green Diamond, Oversold). I HIGHLY recommend setting the alerts for Candle Close so that you can be sure the signal is confirmed.
You may notice that the indicator can give multiple signals back-to-back or be overbought/oversold for multiple candles. When this happens, it's best to look at other indicators such as the RSI, MFI Pro, etc to nail the best entry and have confluence with your decision. With that said, having multiple signals back-to-back can also be an indication that the move is close to happening.
This indicator is a strong indicator by itself but works best when paired with my Volume Extractor indicator i.e taking a trade when both indicators are displaying overbought/oversold or crossing outside of the bollinger bands. Measuring price action is an extremely important aspect of trading and one I believe should not be overlooked. I hope I made everything as clear as possible and please let me know if I didn't.
PM me to obtain access and please let me know if you have any questions!

Heikin Ashi+RSI+EMA Strategy 2.0 v4 [Cryptocurrency] by GodtrixHi,
I know a lot of people are looking for a more sophisticated and customizable strategy tool, I'm facing the same problem too, so I created one for myself and decided to share it for free trials and if you think this tool do what you wanted, you can contact me for the subscription "Premium" version.
I'll keep it simple with point forms, if you have any further inquiries or questions, please feel free to message me. Thank you.
Best profit plan with this strategy is you trade on Future leverage while you hold on to your coin, so that when price goes up, your coin value goes up, and at the same time, you trade with your leverage to earn even more, easily doubling up your total profit.
Benefits:
Fully customizable and you can easily personalized it and FINE TUNE it according to the market or coin you trading on.
The strategy is based on REAL PRACTICAL trading skills, so it works in real-world.
I fixed the "repainting" issue so the backtest it shows you IS ACCURATE when you run for real-time.
We all know one indicator is not going to help you win your trades, so this strategy combines ALL three: EMA for long+short term trend, HA for short term trend, RSI for entry/exit
This strategy is designed for LONG trade (Buy low, Sell high), not for SHORT trade.
This is not day trading, it is more to mid-term trading, where there's only few trades per month
Mainly is coded to work with 3Commas bot auto trading, so you only need to key in your Bot ID & Email Token.
Bot trading NOTE:
You need to replace the Alert Message with this: {{strategy.order.alert_message}}
One Alert will work for both Buy and Sell Order
If you using other Bot service, you can enter Custom Command too, so it works on any bot service.
Lastly,
regarding the setting advice, I would say you try playing with different settings and your objective is to achieve a backtest result that has:
1) Profitable is > 80%
2) Losing trades is nearly 0 or below 25% of your winning trades. Trick is using far stop loss %
3) Net Profit be almost same or more than "Buy & Hold Profit"
If you interested in our subscription version, message me for price.
Best Luck & a million dollar profit to you,
Godtrix BITSTAMP:BTCUSD BINANCE:DOTUSDT

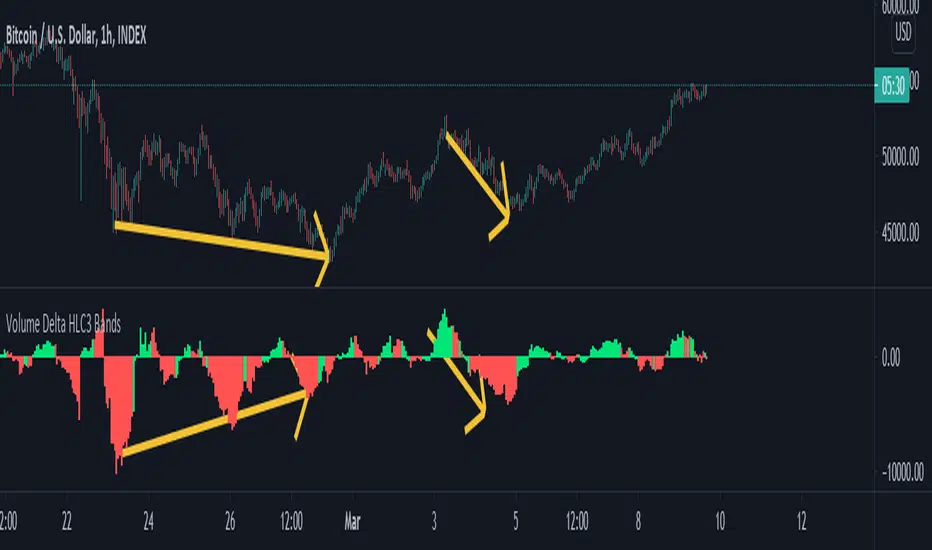
Volume Delta Histogram and BandsThis study takes the lower timeframe volume from the specified "Volume Data Time Period", and calculates the sum of volume over the user specified "Volume Signal period", doing its best to take an approximation of delta.
This is displayed via a histogram, and can be used to trade divergences, see trends strengthen and weaken as illustrated on the chart below.
You can also display reversal areas, which will show when the "Volume Signal Period" exceeds one half of the average volume plus two standard deviations over the "Volume Comparison Period."
Think of this like bollinger bands for volume trends, when the bands are tight crossing outside them can signal strength, but when they are moderate or contracting it can show an area for a likely reversal.
MAC Trader V2.0 [VK]This script is based on a very simple and affective strategy. Usable for scalp, Trend, Swing, positional Trading. Works on all types of markets(Crypto, Stocks, Commodity, Forex, etc) and symbols.
About The Indicator :
The three lines(Grey upper, Red Mid, Grey Lower) moving with the price direction is Moving average channel (MAC) Which is used to determine the Market Direction. Buy/Sell signals are plotted on RSI Oversold/overbought Which is used For Entries. Small Red Line plotted below the Buy/Sell Signals is Stop loss and The Dotted lines in Green, Grey and Red are the take profit lines.
How to use :
Buy When Buy Signal, Sell When Sell Signal (Entry only After Candle Close). Use The red line below/above signals for Stop Loss. Green Red dotted lines to take profit targets, move your stops above/below as targets hits.
Functions :
Moving Average Channel (MAC) For Direction
RSI for entries
ATR for stops
Support/Resistance Lines to Take Profits
Color candles When Price Above/Below MAC
Additional Feature :
Chop Signals for Scalping/continuation/Mid Entries - This feature can be turned on in the indicator settings Which will plot B/S signals for entries.
TIP : Use MAC input 34,48 for low volatile markets (Indices, Gold , etc)
RSI Classic Strategy (by Coinrule)One of the questions hobbyist traders more often ask is: what is the perfect trading indicator?
Every indicator is just a tool, so its efficiency is proportional to your ability to read its signals and translate them into an actionable trading strategy. The RSI is likely the most flexible and easy to use among the technical indicators.
This trading strategy tries to catch short-term swings on the coins of your choice with a simple yet profitable setup.
Buy when the RSI is lower than 30 (you can adjust it to 35 in times of steep uptrend).
Sell when the RSI is greater than 65 (the target may range between 60 and 75 depending on the volatility of the coin).
Note that the buy signal comes when the indicator crosses below 30 and not when it crosses above 30 as it happens on the built-in RSI strategy on Tradingview.
The present script overperforms the built-in strategy, even adding trading fees and using a lower amount of capital for each trade (30%). That means that the system can deliver higher net-profits with lower risk levels.
A typical example of market conditions where this strategy works perfectly is as follows.
The first initial breakout indicates that a new leg up in the trend may start. Bitcoin starts to trade within a range which you can identify when it reaches the point 3. That is the perfect time to start the rule because
- trading within a channel anticipates possible swings up and down
- the trend is on the upside, providing low downside risk in buying the dips.
This strategy works well with selected coins of your choice, and it's a great fit on leverage exchanges like Binance Futures.
If you prefer to run it across all available coins on the market, instead, you may choose an optimized version.

Adaptive RSI and MACDHello guys,
this script provides a adaptive version of the RSI and MACD. Also you can check in the settings for the long-short-ratio of bitcoin and ethereum.
The indicator is adaptive, because it looks at historic price action of a specific period to define, wether the trend is bullish or bearish and therefore adapts the values.
What you need to look out for:
- MACD crosses, highs (top area) and lows (lower area)
- RSI divergences (e.g. adaptive rsi falls and price goes higher)
- long-short divergences (e.g. long-short ratio rises and price goes down)
- if macd or rsi is above the middle line, the trend is rising and other way around
Let me know, what you've been thinking bout the script :-)
