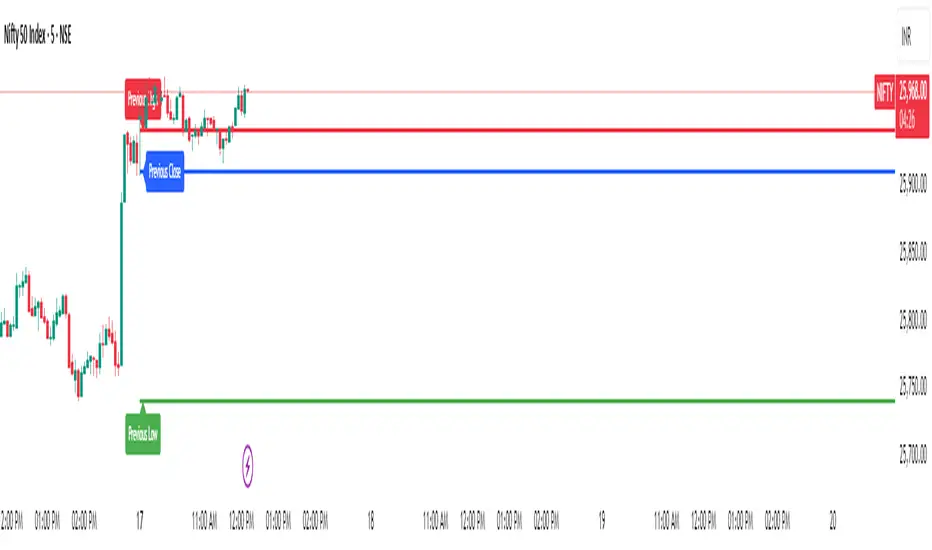
Daily contextThis indicator automatically marks the Previous Day’s High and Low, as well as the market’s midnight opening price.
These levels are updated at the start of each new trading day and remain visible throughout the entire session.
By providing key daily reference points, the indicator helps establish a clear market context and allows traders to immediately understand where price is positioned relative to the previous day’s range and the daily open.
Indice High-Low

Session Range Control [PointAlgo]Session Range Control (SRC)
The Session Range Control (SRC) indicator provides a structured view of intraday price behavior by tracking where the current price sits within the session’s high–low range and how today’s volatility compares to the Average Daily Range (ADR). It combines range analytics, momentum context, volatility interpretation, and visual cues to help traders understand session strength and shifts in intraday conditions.
Core Concept
Every trading session forms a unique high and low. SRC continuously reads these values and calculates the Position in Range, expressed on a scale from 0% to 100%:
0% → Price at Day Low
100% → Price at Day High
50% → Mid-range equilibrium
By normalizing price into a percentage, traders can quickly interpret where market pressure is concentrated during the session.
Trend Zones and Market State
SRC divides the range into logical zones to show the likely sentiment of the session:
1. Strong Uptrend Zone (Above Threshold)
When price consistently holds above the user-defined upper threshold (e.g., 60%), the indicator marks a Strong Uptrend.
This typically reflects:
Persistent intraday buying pressure
Price acceptance near the upper part of the range
Reduced likelihood of deep pullbacks
2. Strong Downtrend Zone (Below Threshold)
When price remains below the lower threshold (e.g., 40%), SRC signals a Strong Downtrend, indicating:
Dominant intraday selling
Consistent pressure keeping price near session lows
3. Bullish / Bearish Zones
Between the midline and strong thresholds, SRC displays softer trend zones:
Above 50% = Bullish Zone
Below 50% = Bearish Zone
These zones help classify whether price is trending, balanced, or drifting.
4. Neutral Territory
When price hovers around the mid-level without conviction, the indicator treats it as a neutral or undecided phase.
Signal Logic :
SRC includes built-in momentum shift signals based on range transitions:
Long Signal
Triggered when price crosses upward through 50%, often showing:
A shift from intraday weakness to strength
Buyers gaining control of the session
Short Signal
Triggered when price crosses downward through 50%, suggesting:
Loss of intraday strength
Sellers taking control
These signals help highlight potential turning points inside the session.
Extreme Levels :
SRC highlights the top and bottom 10% of the range:
> 90% = Extreme High (Overbought intraday condition)
< 10% = Extreme Low (Oversold intraday condition)
These conditions can be useful for identifying overextended movements or potential reaction zones.
ADR Comparison and Volatility Context :
The indicator also measures how today’s price range compares to the Average Daily Range (ADR):
Range Expanding: Today’s range is significantly larger than the ADR
Indicates heightened volatility
Often associated with trending or breakout environments
Range Compressing: Today’s range is much smaller
Suggests low volatility
Common before breakout phases
Characteristic of consolidation or balanced markets
This volatility context helps traders assess whether the session is behaving within normal boundaries or deviating significantly.
Dashboard Overview :
When enabled, the dashboard summarizes key intraday metrics in a structured table:
Trend status (Strong Uptrend, Strong Downtrend, Bullish, Bearish, Neutral)
Range position (%)
Signal status (Long Cross, Short Cross, Extreme High/Low, or None)
Day range calculation
Range vs ADR (%)
Day High / Day Low
Current price level
Simplified action label based on current conditions
This provides a quick reference system to interpret both trend and volatility at a glance without analyzing the full chart visually.
Visual Elements
SRC includes:
Colored dynamic plot for easy trend recognition
Horizontal reference lines at key levels (0%, 50%, 100%, strong-trend thresholds)
Background shading during extreme zone conditions
A separate ADR comparison plot
These visuals ensure the indicator remains intuitive regardless of chart style or timeframe.
Alerts
The script includes alert conditions for:
Long cross
Short cross
Strong trend detection
Extreme high / extreme low
These allow users to automate notifications during key market events without manually monitoring the chart.
Customization Options
Users can configure:
ADR length
Strong trend thresholds
Dashboard visibility
Dashboard position on chart
This makes SRC adaptable to different trading instruments and intraday styles.
Usage Notes
Works best on intraday timeframes where session boundaries are clearly defined.
Designed for analytical interpretation—trend bias, volatility phase, and range structure.
Can complement other tools such as moving averages, volume, or market structure analysis.
Disclaimer :
This indicator is intended for chart analysis and educational purposes only.
It does not generate financial, investment, or trading advice.
Users should validate signals with additional research and apply proper risk management.

LL-HL PivotThis indicator scans for the bullish structure known as a Higher Low (HL) across multiple lengths simultaneously, automatically selects the most suitable pattern, and plots it on the chart.
Below is a detailed explanation of how it works.
1. Basic Calculation Method (Definition of LL and HL)
This indicator is built on TradingView’s ta.pivotlow function.
Detecting Pivot Lows
For a given length, a Pivot Low is identified as the lowest point among the candles within the specified range to the left and right.
LL and HL Determination
LL (Lowest Low): The most recent Pivot Low is treated as the previous low.
HL (Higher Low): When a new Pivot Low forms above the previous LL, it is recognized as an HL, and the setup is considered “complete.”
Identifying the Pivot Line
During the LL–HL structure, the highest high between them is identified and used as the breakout level (Pivot Line / resistance), where a horizontal line is drawn.
2. Multi-Length Scanning
Unlike standard indicators that use only one length (e.g., Length = 5), this indicator evaluates a full range of lengths.
Min Length to Max Length
Example: Min = 2, Max = 10
Internally, it functions as if nine separate indicators (Length 2, 3, 4 … 10) are running simultaneously.
This allows the indicator to capture:
Small waves (short-term pullbacks)
Larger waves (broader structural moves)
3. Priority Mode System
Because multiple lengths are calculated at the same time, different LL–HL patterns may appear simultaneously.Priority Mode determines which setup is selected and displayed.
A. Lowest LH
Selects the pattern with the lowest pivot line (intermediate high).
Advantages:
Produces the lowest possible entry price
B. Longest Length
Selects the pattern with the longest length.
Advantages:
Focuses on larger structures and broader waves
Filters out noise
C. Shortest Length
Selects the pattern with the shortest length.
Advantages:
Reacts quickly to small moves
Useful for scalping or fast trend-following
Captures very short-term pullbacks
4. Additional Behavior and Features
Real-Time Invalidation
If price breaks below the confirmed HL, the structure is immediately considered invalid.
All previously drawn lines and labels are removed instantly, preventing outdated structures from remaining on the chart.
Pivot Line Extension
As long as the HL remains intact, the Pivot Line (breakout level) continues extending to the right.
Alerts
An alert can be triggered the moment price breaks above the Pivot Line on a closing basis.

HTF LiquidityThe ICT Liquidity Sweeps Indicator is designed to track liquidity zones in the market areas where stop-losses and pending orders are typically clustered. This indicator marks buyside liquidity (resistance) and sellside liquidity (support) from HTF (H4, H1 and M15), helping traders identify areas where price is likely to manipulate liquidity before making a significant move.
This tool is based on Inner Circle Trader (ICT) Smart Money Concepts, which emphasize how institutional traders, or “Smart Money,” manipulate liquidity to fuel price movements. By identifying these zones, traders can anticipate liquidity sweeps and position themselves accordingly.
⚙️ How It Works
1️⃣ Detects Key Liquidity Zones
The script automatically identifies significant swing highs and swing lows in price action using a pivot-based method.
A swing high (buyside liquidity) is a peak where price struggles to break higher, forming a resistance level.
A swing low (sellside liquidity) is a valley where price struggles to go lower, creating a support level.
These liquidity points are prime targets for liquidity sweeps before a true trend direction is confirmed.
2️⃣ Draws Liquidity Lines
Once a swing high or low is identified, a horizontal line is drawn at that level.
The lines extend to the right, serving as future liquidity targets until they are broken.
The indicator allows customization in terms of color, line width, and maximum number of liquidity lines displayed at once.
3️⃣ Handles Liquidity Sweeps
When price breaks a liquidity level, the indicator reacts based on the chosen action setting:
Dotted/Dashed: The line remains visible but changes style to indicate a sweep.
Delete: The line is completely removed once price has interacted with it.
This feature ensures that traders can easily spot where liquidity has been taken and determine whether a reversal or continuation is likely.
4️⃣ Prevents Chart Clutter
To maintain a clean chart, the script limits the number of liquidity lines displayed at any given time.
When new liquidity zones are formed, the oldest lines are automatically removed, keeping the focus on the most relevant liquidity zones.

Stochastic RSI (MTF) by Martin BueckerMulti-Timeframe Smoothed Stochastic RSI Indicator
Author: Martin Bücker
This indicator calculates the Stochastic RSI based on a higher timeframe while running on a lower timeframe chart, providing a smoother and more responsive curve without the typical step-like behavior of higher timeframe data.
Multi-Timeframe Support: Computes the Stochastic RSI using data from a user-defined higher timeframe (e.g., 3-minute on a 1-minute chart) while aligning updates to the current chart's timeframe for timely signals.
Smoothing: Applies smoothing to both %K and %D lines to reduce noise and create smooth curves, avoiding the stair-step effect common in higher timeframe indicators.
Customization: Allows the user to adjust RSI length, stochastic length, and smoothing parameters for fine-tuning.
Visuals: Plots %K and %D lines with clear coloring and highlights overbought/oversold zones with background fills.
This tool is ideal for traders seeking to integrate higher timeframe momentum information into lower timeframe decision-making without losing timing accuracy or smoothness.


6EMA & SMA with alertOverview
This indicator is designed to combine multiple moving averages, higher-timeframe levels, and flexible alerts into a single tool. It helps you monitor trend direction, dynamic support/resistance, and key daily/weekly/monthly levels without loading several separate indicators.
Main Features
1 12 Moving Averages in One Indicator
・Plots a total of 12 lines: 6 EMAs and 6 SMAs.
・All lengths and sources are fully configurable from the settings, so you can adapt them to your own style and timeframe.
2 Slope-Based Color Change
・One EMA and one SMA are colored based on their slope (rising vs. falling).
・This makes it easy to visually confirm when the medium/long-term bias is turning up or down.
3 Price-vs-MA Alerts
・You can enable alerts when price touches or crosses any selected EMA or SMA.
・Direction can be set to “Up”, “Down”, or “Both”, and you can choose to trigger only on bar close.
・The script can also send detailed alert() messages containing the symbol, timeframe, price, and line value at the moment of the cross.
4 Daily / Weekly / Monthly High–Low Levels
・Optionally display the current Daily, Weekly, and Monthly high/low levels as rays extended to the right.
・Each set of levels can be shown or hidden individually, and has its own color, style, and width options.
・Labels (DH/DL, WH/WL, MH/ML) are attached at the right side of each line for quick identification.
Notes & Disclaimer
This indicator is for charting and alerting purposes only. It does not open, close, or manage any positions.
It does not guarantee any specific results or performance. All examples are for educational and informational purposes only.
Always test and adjust the settings on your own symbols and timeframes, and use proper risk management when applying it to live trading.

Week high / Week low (Mo–Fr)The indicator tracks the weekly high and low levels of the market starting from Monday 00:00 and updates them throughout the week until Friday. It draws horizontal lines across the chart representing:
Weekly High
Weekly Low
Each level also displays a label that can be positioned in different ways depending on user settings.
🧠 How it works step-by-step
1. Every Monday a new week starts
When a new week begins:
The script stores the current candle’s high as the initial weekHigh
And the current candle’s low as weekLow
Previous week's lines and labels are deleted
New horizontal lines are created and extended to the right
Labels (for high & low) are placed initially at the start of the week
2. During Monday–Friday
On every candle:
If a new higher price is reached → weekly high updates
If a new lower price is reached → weekly low updates
The horizontal line moves to the new value
A saved index remembers where that high/low was created
3. Label Position Control
The user can choose how labels should be anchored:
Mode Meaning
Update point Label stays where the high/low occurred
Right edge Label always moves to the current bar (right end of week)
Right offset Like Right edge but shifted further right by X bars
You can also customize:
label background color
label text color
label size
whether the label points up/down (above or below the line)
line color, style, and width
4. Weekend behavior
On Saturday, the script stops extending the lines, effectively freezing the weekly high and low for that completed week.
Summary
This indicator is useful for traders who want automatic weekly levels, visually clean chart structure, and customizable label placement. It tracks market structure weekly, keeps levels persistent across the chart, and lets you choose exactly how those levels appear.
If you want, I can also create:
✔ previous week high/low
✔ midline (50% of the range)
✔ alerts when price breaks the weekly high/low
✔ highlight liquidity sweeps

MSSM - Multi-Session Structural Map (Precision Sweeps)MSSM – Multi-Session Structural Map (Precision Sweeps)
This indicator provides a structured view of the market based on four key components:
1). Previous session levels
2). Confirmed fractal swing points
3). Volume pocket highlights
4). Non-repainting precision liquidity sweep markers
It is designed to help analyze how price interacts with important reference areas and structural points. This tool does not generate signals or predictions. All information is visual and educational only.
HOW THE INDICATOR WORKS
PREVIOUS SESSION LEVELS
The script plots the previous session’s High, Low, and Mid. These levels help observe how the current session behaves around the prior day’s range. They act as reference areas only.
FRACTAL SWING MAP (NON-REPAINTING)
Confirmed fractals are used to mark historical swing highs and swing lows. Since fractals confirm after a certain number of bars, the swings do not repaint once formed. These swings provide a clearer view of market structure.
VOLUME POCKETS
The indicator highlights areas where volume expands relative to a rolling volume average. These regions show increased participation or activity. The highlights are informational and do not imply direction.
PRECISION LIQUIDITY SWEEPS (NON-REPAINTING)
A sweep is tagged only when:
• Price trades beyond a confirmed swing high or swing low
• Price closes back inside the previous swing level
• A wick rejection occurs
• Volume expands relative to a recent rolling average
These markers simply show where price interacted with liquidity around prior structural levels. They do not indicate a trading signal or bias.
HOW TO ADD THE INDICATOR
Open the Pine Editor in TradingView
Search the indicator name and add to favorites.
Click “Add to chart”
Adjust settings as needed (fractals, sweeps, volume pockets, or session levels)
HOW TO READ AND USE THE INDICATOR
SESSION LEVELS
Observe whether price respects, rejects, compresses around, or expands beyond the previous session high, low, or midpoint. These are observational reference levels only.
FRACTALS
Fractal highs and lows help visualize structural turning points. They provide a clearer picture of where liquidity may rest above or below past swing levels.
VOLUME POCKETS
When volume expands compared to the recent average, the candle is shaded. These areas may show increased participation, but no directional meaning is implied.
PRECISION SWEEPS
Sweeps highlight when price reaches beyond a prior confirmed swing level and then rejects that area with displacement. These markers identify interactions with liquidity, but they are not signals and do not forecast future outcomes.
CUSTOMIZATION OPTIONS
Users can adjust:
• Session level visibility
• Fractal sensitivity
• Volume pocket threshold
• Sweep sensitivity and visibility
• Transparency and styling
This makes the tool flexible across different symbols and timeframes.
IMPORTANT NOTES AND POLICY COMPLIANCE
• The indicator does not provide buy or sell signals
• The indicator does not predict price or direction
• All plotted elements are based on past price behavior
• All components are informational only
• Users should perform their own analysis and risk evaluation
• Past behavior does not guarantee future performance
SUMMARY
MSSM provides a structured view of price by combining previous session levels, confirmed swing structure, volume expansion zones, and non-repainting sweep identification. Its purpose is to assist traders in visually analyzing market structure while staying fully aligned with TradingView’s House Rules and content policies.

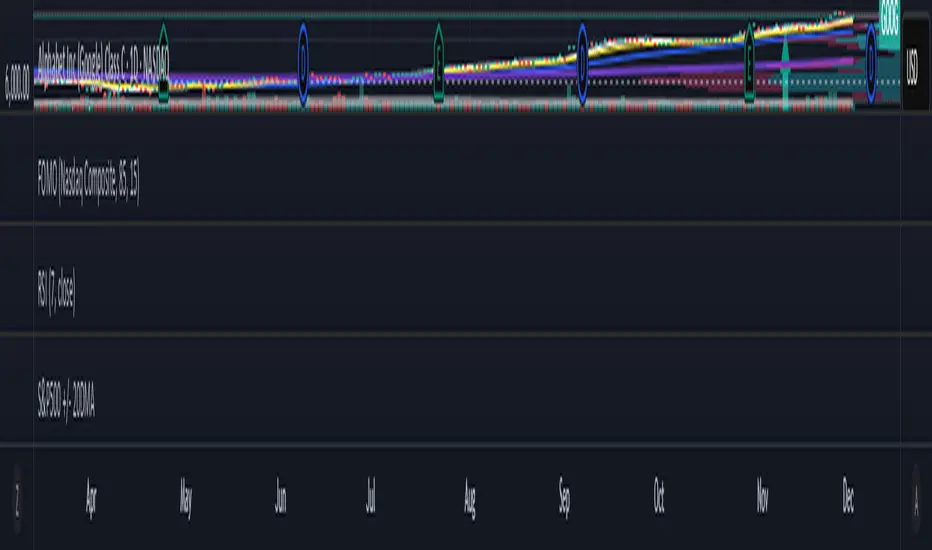
S&P 500 Breadth: Bull vs Bear (20DMA)S&P 500 Breadth: Bull vs Bear (20DMA)
Use as simple market breadth
Cycle Forecast + MACD Divergence (Kombi v6 FULL)This indicator merges two powerful analytical models:
🔮 1. Dominant Cycle Forecasting
The script automatically identifies major structural market cycles by detecting significant swing highs and lows.
It then fits a sinusoidal wave (amplitude, phase, and period) to the dominant cycle and projects it into the future.
Features:
Automatically extracts large, dominant cycles (no noise, no small swings)
Smooth sinusoidal historical cycle visualization
Future cycle projection for 1–2 upcoming cycle periods
Dynamic amplitude and phase alignment based on market structure
Helps anticipate cycle tops and bottoms for long-term timing
📉 2. MACD Divergence Detection
Full divergence detection engine using MACD or MACD Histogram.
Detects:
Bullish Divergence
Price ↓ while MACD (or Histogram) ↑
→ Possible trend reversal upward
Bearish Divergence
Price ↑ while MACD (or Histogram) ↓
→ Possible trend reversal downward
Features:
Pivot-based divergence confirmation (no repaint)
Choice of MACD Line or Histogram as divergence source
Labels + connecting divergence lines
Works across all markets and timeframes
⚙️ Smart Auto-Pivot System
The indicator optionally adjusts pivot sensitivity based on timeframe:
Weekly → tighter pivots
Daily → medium pivots
Intraday → wider pivots
Ensures stable, meaningful divergence signals even on higher timeframes.
🎯 Use cases
Identify upcoming cycle highs/lows
Spot major trend reversals early
Improve swing entries with MACD divergences near cycle turns
Combine forecasting with momentum exhaustion
Suitable for crypto, stocks, indices, forex & commodities
🧠 Why this indicator is powerful
This tool blends time-based cycle forecasting with momentum-based divergence signals, giving you a unique perspective of where the market is likely to turn.
Cycles reveal when a move may occur.
Divergences reveal why a move may occur.
Combined, they offer highly effective market timing.

Weekly Future and ZoneDescription
🔹This multi-tool indicator plots Best-Strike–based R/S levels, BEP zones, Panic zones, Synthetic Future High/Low, Previous Day OHLC, Daily Open, CPR (Daily/Weekly), and key EMAs.
Designed for option writers, index traders, and intraday traders who want all major reference levels in one place.
🔹Includes toggles for every module, auto-cleaned drawing objects, CPR box shading, customizable MAs, and optimized last-bar rendering.
Best Strike : CE/PE Close price which is near.
Need Input CE/PE High, Low, Close Price
💡 Key Features:
Best-strike derived R1, R2, S1, S2
BEP (Break-even) Levels
Panic Zones for directional risk
Synthetic Future High/Low using CE/PE premium imbalance
Previous Day OHLC for intraday structure mapping
Daily Session Open
CPR (Daily/Weekly) + automatic CPR zone shading
EMA Trend Pack + customizable SMA/EMA/WMA/VWMA
⚠️ Disclaimer
This indicator is provided for educational and analytical purposes only.
It does not provide trading advice or buy/sell signals.
Use responsibly and in conjunction with your market analysis.

User Predefined Lines / IntervalsThis script, marks some of the values/intervals used in trading.
The following features are drawn:
Previous high and low
Asia high and low
London high and low
Opening prices at 00:00 and 08:30
Price range for 03:00 (03:00-3:59)
For each group you can set:
The number of the last days drawn on the chart
The length of the lines, in hours per group
The name and range of time for each group as needed
Please note the script uses the timezone set in the TradingView
The script uses the values from TradingView. So in 1D time interval, you wouldn't be able to see those hourly indicators.
If the indicator appears with the list of inputs on your chart legend, you can disable it in indicator-setting-style- disable show inputs

ORB + Fair Value Gaps (FVG/iFVG) Suite with Daily 50% MidlineA complete smart-money–focused price-action toolkit combining the New York Open Range Breakout (ORB), ICT-style Fair Value Gaps, Inverted FVGs, and a dynamic Daily 50% Midline.
Designed for traders who want a clean, fast, and highly visual way to track liquidity, imbalances, and intraday directional bias.
📌 Key Features
1. NY Session ORB (09:30–09:45 New York Time)
Automatically plots:
ORB High
ORB Low
Labels for ORB high/low
Optional 5-minute chart restriction
Lines extend forward for easy reference
Used to identify breakout conditions, liquidity sweeps, and directional bias into the morning session.
📌 2. ICT-Style Fair Value Gaps (FVGs)
Full automated detection of bullish & bearish FVGs based on the classic 3-candle displacement structure:
Bullish FVG: high < low
Bearish FVG: low > high
Each FVG is drawn as a box with:
Custom colour
Custom border style (solid, dashed, dotted)
Automatic extension to the right until filled
Optional size text showing the gap in points (font size/colour adjustable)
Adjustable max lookback for performance
📌 3. Inverted FVGs (iFVGs)
Once price fully fills an FVG, it automatically becomes an iFVG, shown with:
Custom iFVG colour
Custom border style
Extension to the right
Once price trades through the zone from the opposite side, the iFVG is considered “consumed” and:
It stops extending
And optionally auto-deletes based on user settings
This makes it easy to track meaningful imbalances that turn into liquidity pockets.
📌 4. “Show Only After ORB” Filter
Optionally hide all FVGs/iFVGs formed before the ORB completes.
This is especially useful for intraday strategies focused on NY session structure only.
📌 5. Daily 50% Midline (OHLC Midpoint)
A dynamic, always-updating midpoint of the current daily candle:
Mid = (Daily High + Daily Low) / 2
Features:
Custom colour
Dashed styling
Extends left and right as a horizontal ray
Updates live as the daily candle forms
Great for bias filters, mean reversion, and daily liquidity zones.
📌 6. Performance-Optimized (Fast!)
Built with:
Fully configurable max lookback
Memory-efficient arrays
Auto-cleaning of old FVG/iFVG objects
Lightweight daily midline recalculation
This allows extremely fast rendering even on 1-minute charts.
📌 7. Alerts
Includes a clean alert condition:
Price returned to a Fair Value Gap
Works for both bullish and bearish FVG revisits.
🎯 Who This Indicator Is For
This tool is ideal for traders who use:
ICT / SMC concepts
Liquidity-based trading
ORB strategies
Imbalance-driven price action
Intraday or NY session-focused setups
Futures, crypto, forex, and equities
🎁 Summary
This indicator gives you:
A clean ORB framework
Automatic, dynamic FVG and iFVG analysis
Real-time daily candle context
Customizable visuals
Powerful session filtering
Efficient performance
All in one clean, intuitive package built for real-time decision making.

RSI Divergence (Regular + Hidden, @darshakssc)This indicator detects regular and hidden divergence between price and RSI, using confirmed swing highs and swing lows (pivots) on both series. It is designed as a visual analysis tool, not as a signal generator or trading system.
The goal is to highlight moments where price action and RSI momentum move in different directions, which some traders study as potential early warnings of trend exhaustion or trend continuation. All divergence signals are only drawn after a pivot is fully confirmed, helping to avoid repainting.
The script supports four divergence types:
Regular Bullish Divergence
Regular Bearish Divergence
Hidden Bullish Divergence
Hidden Bearish Divergence
Each type is drawn with a different color and labeled clearly on the chart.
Core Concepts Used
1. RSI (Relative Strength Index)
The script uses standard RSI, calculated on a configurable input source (default: close) and length (default: 14).
RSI is treated purely as a momentum oscillator – the script does not enforce oversold/overbought interpretations.
2. Pivots / Swings
The indicator defines swing highs and swing lows using ta.pivothigh() and ta.pivotlow():
A swing high forms when a bar’s high is higher than a specified number of bars to the left and to the right.
A swing low forms when a bar’s low is lower than a specified number of bars to the left and to the right.
The same pivot logic is applied to both price and RSI.
Because pivots require “right side” bars to form, the indicator:
Waits for the full pivot to be confirmed (no forward-looking referencing beyond the rightBars parameter).
Only then considers that pivot for divergence detection.
This helps prevent repainting of divergence signals.
How Divergence Is Detected
The script always uses the two most recent confirmed pivots for both price and RSI. It tracks:
Last two swing lows in price and RSI
Last two swing highs in price and RSI
Their pivot bar indexes and values
A basic minimum distance filter between the pivots (in bars) is also applied to reduce noise.
1. Regular Bullish Divergence
Condition:
Price makes a lower low (LL) between the last two lows
RSI makes a higher low (HL) over the same two pivot lows
The RSI difference between the two lows is greater than or equal to the user-defined minimum (Min RSI Difference)
The two low pivots are separated by at least Min Bars Between Swings
Interpretation:
Some traders view this as bearish momentum weakening while price prints a new low. The script only marks this structure; it does not assume any outcome.
On the chart:
Drawn between the previous and current price swing lows
Labeled: “Regular Bullish”
Color: Green (by default in the script)
2. Regular Bearish Divergence
Condition:
Price makes a higher high (HH) between the last two highs
RSI makes a lower high (LH) over the same two pivot highs
RSI difference exceeds Min RSI Difference
Pivots are separated by at least Min Bars Between Swings
Interpretation:
Some traders see this as bullish momentum weakening while price prints a new high. Again, the indicator simply highlights this divergence.
On the chart:
Drawn between the previous and current price swing highs
Labeled: “Regular Bearish”
Color: Red
3. Hidden Bullish Divergence
Condition:
Price makes a higher low (HL) between the last two lows
RSI makes a lower low (LL) over the same two lows
RSI difference exceeds Min RSI Difference
Pivots meet the minimum distance requirement
Interpretation:
Some traders interpret hidden bullish divergence as a potential trend continuation signal within an existing uptrend. The indicator does not classify trends; it just tags the pattern when price and RSI pivots meet the conditions.
On the chart:
Drawn between the previous and current price swing lows
Labeled: “Hidden Bullish”
Color: Teal
4. Hidden Bearish Divergence
Condition:
Price makes a lower high (LH) between the last two highs
RSI makes a higher high (HH) over those highs
RSI difference exceeds Min RSI Difference
Pivots meet the minimum distance filter
Interpretation:
Some traders associate hidden bearish divergence with potential downtrend continuation, but again, this script only visualizes the structure.
On the chart:
Drawn between the previous and current price swing highs
Labeled: “Hidden Bearish”
Color: Orange
Inputs and Settings
1. RSI Settings
RSI Source – Price source for RSI (default: close).
RSI Length – Period for RSI calculation (default: 14).
These control the responsiveness of the RSI. Shorter lengths may show more frequent divergence; longer lengths smooth the signal.
2. Swing / Pivot Settings
Left Swing Bars (leftBars)
Right Swing Bars (rightBars)
These define how strict the pivot detection is:
Higher values → fewer, more significant swings
Lower values → more swings, more signals
Because the script uses ta.pivothigh / ta.pivotlow, a pivot is only confirmed once rightBars candles have closed after the candidate bar. This is an intentional design to reduce repainting and make pivots stable.
3. Divergence Filters
Min Bars Between Swings (Min Bars Between Swings)
Requires a minimum bar distance between the two pivots used to form divergence.
Helps avoid clutter from pivots that are too close to each other.
Min RSI Difference (Min RSI Difference)
Requires a minimum absolute difference between RSI values at the two pivots.
Filters out very minor changes in RSI that may not be meaningful.
4. Visibility Toggles
Show Regular Divergence
Show Hidden Divergence
You can choose to display:
Both regular and hidden divergence, or
Only regular divergence, or
Only hidden divergence
This is useful if you prefer to focus on one type of structure.
5. Alerts
Enable Alerts
When enabled, the script exposes four alert conditions:
Regular Bullish Divergence Confirmed
Regular Bearish Divergence Confirmed
Hidden Bullish Divergence Confirmed
Hidden Bearish Divergence Confirmed
Each alert fires after the corresponding divergence has been fully confirmed based on the pivot and bar confirmation logic. The script does not issue rapid or intrabar signals; it uses confirmed historical conditions.
You can set these in the TradingView Alerts dialog by choosing this indicator and selecting the desired condition.
Visual Elements
On the main price chart, the indicator:
Draws a line between the two price pivots involved in the divergence.
Adds a small label at the latest pivot, describing the divergence type.
Colors are used to differentiate divergence categories (Green/Red/Teal/Orange).
This makes it easy to visually scan the chart for zones where price and RSI have diverged.
What to Look For (Analytical Use)
This indicator is intended as a visual helper, especially when:
You want to quickly see where price made new highs or lows while RSI did not confirm them in the same way.
You are studying momentum exhaustion, shifts, or continuation using RSI divergence as one of many tools.
You want to compare divergence occurrences across different timeframes or instruments.
Important:
The indicator does not tell you when to enter or exit trades.
It does not rank or validate the “quality” of a divergence.
Divergence can persist or fail; it is not a guarantee of reversal or continuation.
Many traders combine divergence analysis with:
Higher timeframe context
Trend filters (moving averages, structure)
Support/resistance zones or liquidity areas
Volume, structure breaks, or other confirmations
Disclaimer
This script is provided for educational and analytical purposes only.
It does not constitute financial advice, trading advice, or investment recommendations.
No part of this indicator is intended to suggest, encourage, or guarantee any specific trading outcome.
Users are solely responsible for their own decisions and risk management.

Liquidity Sweep & Reversal MapLiquidity Sweep & Reversal Map (LSRM) is a visual tool designed to help traders study how price interacts with key liquidity areas such as daily highs, daily lows, previous-day levels, and potential sweep zones. Its purpose is to map structure, highlight volatility around major reference points, and visualize how price behaves after taking liquidity.
This indicator does not attempt to predict market direction. It simply identifies conditions where price has interacted with a known reference level and marks that interaction for user analysis.
🔍 What This Indicator Shows
1. Key Liquidity Reference Levels
The script automatically draws and updates the following levels:
TH — Today’s High
TL — Today’s Low
PDH — Previous Day High
PDL — Previous Day Low
These levels are widely monitored by many traders and can be helpful when studying liquidity behavior and intraday volatility.
2. Liquidity Sweeps
A liquidity sweep occurs when:
Price briefly moves beyond a major high or low
And then closes back within the prior range
The indicator marks detected sweep interactions with:
BS (Bullish Sweep) when liquidity is taken below a low
SS (Bearish Sweep) when liquidity is taken above a high
A sweep only appears after the bar has closed, helping users analyze completed price structure.
3. Optional Sweep Zones
When enabled, the tool draws a shaded zone between:
The swept wick
The reference level
This can help highlight areas where liquidity was taken.
4. Volume & Candle Filters
The indicator includes optional filters such as:
Relative volume spikes
Strong candle body requirement
These filters are provided only to refine the visual highlight of sweeps; they do not constitute trading signals.
🎛 Customization
Users can configure:
Instrument presets
Sweep buffers
Volume sensitivity
Line visibility and thickness
Label display
Zone visibility
All settings are optional and intended for chart annotation only.
⚠️ Important Notes
This tool is not a trading system, signal generator, or strategy.
It does not provide buy/sell advice or predict future price movement.
All markings are visual aids for chart study and structural analysis only.
Users should rely on their own judgment and independent analysis when making trading decisions.

RED-E Index and ETF ConverterThis indicator provides real-time conversion between major US stock market indices and their corresponding ETFs, displaying current prices, calculated conversions, and market sentiment in an easy-to-read dashboard format.
WHAT IT DOES:
Tracks three major index-ETF pairs and shows bi-directional conversions:
SPX (S&P 500 Index) ↔ SPY (SPDR S&P 500 ETF)
NDX (NASDAQ-100 Index) ↔ QQQ (Invesco QQQ ETF)
RUT (Russell 2000 Index) ↔ IWM (iShares Russell 2000 ETF)
HOW IT WORKS:
The script uses request.security() to fetch real-time price data from each instrument and applies standard conversion ratios:
SPX to SPY: ~1:10 ratio
NDX to QQQ: ~1:40 ratio
RUT to IWM: ~1:10 ratio
Market sentiment is determined by comparing current price to previous bar, displaying BULLISH (green ▲), BEARISH (red ▼), or NEUTRAL (gray ●).
KEY FEATURES:
Real-time price tracking for all six instruments
Bi-directional conversion calculations
Visual sentiment indicators based on price movement
Customizable dashboard position
Adjustable font sizes
Toggle individual index pairs on/off
Color-coded sections
Clean professional table layout
USAGE:
Add the indicator to any chart. The dashboard will display in the bottom left corner by default. Use the settings to:
Change dashboard position
Adjust font size
Show/hide specific index-ETF pairs
Customize sentiment colors
This tool is useful for traders who:
Trade both indices and ETFs
Want to quickly compare index vs ETF pricing
Monitor multiple market segments simultaneously
Need at-a-glance sentiment across major indices
Note: Conversion ratios are approximate and based on standard tracking ratios. Actual ETF prices may vary slightly due to tracking error, fees, and market conditions.
Disclaimer: This indicator is for educational and informational purposes only. It does not constitute financial advice. The creator is not a financial advisor, and users should consult with a licensed financial professional before making any investment decisions. Use at your own risk.

Session High/Low by BKMarks all session highs and lows
Asia High/Low
London High/Low
New York High/Low

Previous Day Levels @darshaksscThis indicator provides intraday traders and analysts with immediate visual reference to the previous day's high, low, and close. These historical price levels are frequently watched by market participants for potential reaction, context, and session structure.
How to Add the Indicator:
Open any chart on TradingView.
Click the Indicators button at the top.
Search for “Previous Day Levels @darshakssc” in the Public Library.
Click the ★ Favorite icon if you wish to save it for quick access in the future.
Click the indicator’s name to add it to your chart.
The lines and labels will appear automatically on any intraday timeframe.
What You Will See:
Previous day’s High (red line and label: “Previous High”).
Previous day’s Low (green line and label: “Previous Low”).
Previous day’s Close (blue line and label: “Previous Close”).
These are drawn automatically at each new session and remain visible throughout today’s trading.
Usage:
Use these levels as reference points for context, risk placement, or understanding shifts in session structure.
Watch for price interactions, rejections, or consolidations around these lines—they often act as support/resistance for many trading strategies.
No signals or trade advice are provided by this tool. All decisions are made manually by the trader.
Features:
Persistent, color-coded horizontal lines and clear, small labels.
No alerts, buy/sell arrows, or any indication of trading performance.
Fully automated for each new session—no action required from the user after adding.
Disclaimer:
This indicator is intended for informational and charting purposes only. It is not financial advice or a buy/sell recommendation. Always perform your own due diligence before making trading decisions.
session high and low (only for current day) -HITHVEERits about session highs and lows and only for the current day and main sessions are asia london and newyork

Liquidity Void Detector + Pro SignalsWhat This Indicator Does
This indicator detects “liquidity voids”—large displacement candles with very high body-to-wick ratios and size significantly above recent ATR—where price moved rapidly and left untested areas.
It automatically draws shaded boxes for new, non-overlapping voids, shows a moveable dashboard (void fill probabilities), and provides one clean, actionable long/short signal per void when price action and momentum confirm.
How It Works
Void Detection: Candles with a body/wick ratio and size above user threshold trigger a potential liquidity void.
Box Drawing: Each new void is drawn as a shaded box (yellow/orange) that never overlaps other active voids.
Signal Confirmation: A “LONG” or “SHORT” label appears at the first bar within each valid void if momentum and candlestick structure align.
Dashboard: User-selectable dashboard shows up-to-date stats on remaining unfilled, partially filled, and fully filled voids.
Alerts: Built-in alerts fire when a new high-probability long/short signal is detected (user must add alerts manually).
Key Features
No overlap, no clutter: Only the latest set of boxes and a single signal per event are drawn. Oldest boxes are pruned automatically.
Momentum filter: Signals combine void and trend strength for higher conviction, filtering out weak/fake moves.
Non-repainting: Signals, boxes, and logic only use confirmed bar data—no repaint or future leaks.
Adjustable settings: Every threshold (body/wick ratio, ATR size, maximum boxes, dashboard location, signal label size) is user-configurable.
Efficient for all timeframes and asset classes.
How to Use
Add to your chart:
Click "Add to Chart" or search “Liquidity Void Detector” in the indicator search panel.
Tune your inputs:
Adjust the Body/Wick Ratio and Min Size vs ATR for your market or timeframe.
Set the Void Box Length (how many bars the box displays), signal sensitivity, and maximum concurrent voids.
Move the dashboard as needed for your chart layout.
What to look for:
Yellow/orange boxes highlight recent liquidity voids—untested price gaps where future reactions may occur.
LONG/SHORT signals appear only where a fresh void coincides with confirmed momentum in that direction.
Dashboard tracks probability of voids remaining unfilled, being partially filled, or fully refilled by price.
Trading logic and best use:
Traders may use void boxes to anticipate where price might react, reverse, or trend continuation can resume.
Combine signals with additional price action confirmation such as S/R levels, order blocks, wick rejections, volume spikes, or patterns (e.g., pin bars, engulfing).
Use signal alerts in conjunction with order flow, session profile, or support/resistance tools for increased confluence.
Always backtest and demo trade before live use.
Important Compliance & Disclaimer
No advice: This tool provides visual context only. All trading and risk decisions are the user’s responsibility.
No repainting, original source: The code is fully open-source, uses only native Pine Script, and never repaints.
No spam, no links, no 3rd-party promotion: 100% TradingView House Rules compliant.
If you find this useful, please consider leaving a positive review, and remember to always confirm with your own analysis.

Swing High/Low Support ResistanceThis indicator detects recent swing highs and swing lows using Pine Script pivots and marks them with visible chart labels. These points highlight potential turning areas in price action and can help identify short-term support or resistance for intraday or swing trading.
How to Apply
Locate the indicator in TradingView’s “Indicators” library; search by its name or author.
Click the star icon to mark it as a favourite for quick future access.
Apply directly to your chosen chart and timeframe with a single click—no need to enter or paste code.
Adjust the input parameters from the settings panel if desired to personalize swing sensitivity.
Choose Your Timeframe:
Apply to any intraday or swing timeframe; shorter lengths show more frequent pivots.
Set Sensitivity:
Use the “Swing Detection Length” input to adjust how many bars define a pivot, making swings more or less sensitive to price action.
How to Analyze
Swing High Labels: Mark recent local peaks, suggesting resistance zones or possible reversal points.
Swing Low Labels: Highlight recent bottoms, indicating support or bounce areas.
Monitor labels for clustering or repeated appearance at similar levels, which may strengthen their importance as price reacts near those points.
Track how price behaves after forming new pivots—multiple tests can affirm the relevance of a level.
What Traders Should Watch
Price reaction at labeled areas: frequent tests may anticipate reversals or breakouts.
Transition between higher highs/higher lows (uptrend) vs. lower highs/lower lows (downtrend).
Combine the swing levels with other analysis methods, such as volume, RSI, or EMA, for better signal quality.
Features Included
Dynamic swing high and low detection via confirmed pivots.
Direct labeling on the chart for market structure clarity.
No repainting—labels show only after complete formation.
Fully automatic updates as price action unfolds.
No promotional, external, or non-compliant elements; open source and safe for public or private use.
Compliance Notes
No signals, buy/sell calls, financial advice, or performance claims.
No hidden code, advertising, or off-platform contacts.
Pure educational and analytical utility; adheres to all TradingView house rules and script publishing policies.
Disclaimer
This indicator is for informational purposes only and does not constitute advice. Always do your own research and use proper risk management.

Price Action ZigZag (Impulses & Corrections)This indicator tracks price structure by connecting significant swing highs and lows—giving a clear, actionable “ZigZag” view of market movement. It automatically maps the underlying price action as alternating impulses (trend legs) and corrections (pullbacks), directly on your chart, for any timeframe.
How does it work?
Swing Detection:
The script uses the user-selected “pivot length” to identify confirmed swing highs and lows with Pine Script’s ta.pivothigh and ta.pivotlow.
These pivots only print after full confirmation, making all lines strictly non-repainting.
ZigZag Drawing:
After pivots are captured, the indicator connects each alternating swing with lines that trace the progression of price structure.
Each line segment is mapped according to the sequence and direction of swings:
Impulse: Moves that break further away from prior swing in the same direction (continuations/uptrends/downtrends)
Correction: Moves that pull price back, but do not extend past the previous impulse (retracements/sideways action)
Impulse vs Correction Logic:
Bullish impulse: swing from a higher low to a higher high (fast upward moves after a low)
Bearish impulse: swing from a lower high to a lower low (fast downward moves after a high)
Corrections appear as smaller lines between alternating swing points not leading to new trend extension.
Labels & Colors:
Impulse lines are drawn teal (customizable), corrections in gray.
Tiny labels ("Impulse", "Correction") are shown for clarity (optional).
Most recent pivots are highlighted with yellow dots for quick visual reference.
Key Features:
User-adjustable pivot length controls sensitivity and structure size (scalp to swing).
Distinguishes between impulses and corrections instantly on the chart.
Labels and color coding for clarity—traders can spot trend continuation vs. pullback at a glance.
Non-repainting confirmed pivots and lines; never show incomplete data.
Fully customizable appearance—all colors and label display adjustable in settings.
Zero lookahead or repainting: all signals use confirmed, historical price only.
How to use:
Add to any chart and set 'Swing Length' to fit your trading style (shorter for scalping, longer for bigger structure).
Follow the ZigZag lines to see when price makes an impulse vs. correction, and use this to identify high-probability momentum or reversal zones.
Combine this script with your own analysis/strategy or other indicators for deeper context.
Adjust colors and label options for your preferred chart clarity.
Disclaimer:
This script is a visualization and analysis tool for educational purposes—it does not predict future price movement, guarantee results, or provide trading signals. Always use sound risk management and your own judgment in live trading.
