intraday_bondsStatistics for assisting with intraday bond trading, using five minute periods and one hour ranges. There are two tables, a volatility table and a correlation table. The correlation table shows the correlation of five minute returns (absolute) between the four different bond contracts that trade on the CME. The volatility table shows for each contract:
- The current realized volatility, based on the previous one hour of realized volatility. This figure is annualized for easy comparison with options contracts.
- The current realized volatility's z-score, based on all available data.
- The tick range of an "N" standard deviation move over one hour. Choose "N" using the stdevs input.
- The previous hour's true range (high - low).
The ranges are expressed in ticks.
Volatilità storica

Swing School MetricsI wrote this script to give me a few metrics I follow and to quickly identify if they have the strength and momentum I am looking for. The metrics are used by StockBee and Qullamaggie to distinguish fast moving stocks gaining momentum.
The measures are:
Average Daily Range similar to TradingView's Monthly Volatility is above 5%
Intermediate moving average is above long term or short term is over intermediate term
Trend Intensity above 1.05 calculated by (SMA7/SMA65)
Recent ER Beat
Recent Sales Beat
I also list the market cap, average daily dollar volume, and float to give an idea of liquidity and tradability.

Volatility Risk Premium (VRP) 1.0ENGLISH
This indicator (V-R-P) calculates the (one month) Volatility Risk Premium for S&P500 and Nasdaq-100.
V-R-P is the premium hedgers pay for over Realized Volatility for S&P500 and Nasdaq-100 index options.
The premium stems from hedgers paying to insure their portfolios, and manifests itself in the differential between the price at which options are sold (Implied Volatility) and the volatility the S&P500 and Nasdaq-100 ultimately realize (Realized Volatility).
I am using 30-day Implied Volatility (IV) and 21-day Realized Volatility (HV) as the basis for my calculation, as one month of IV is based on 30 calendaristic days and one month of HV is based on 21 trading days.
At first, the indicator appears blank and a label instructs you to choose which index you want the V-R-P to plot on the chart. Use the indicator settings (the sprocket) to choose one of the indices (or both).
Together with the V-R-P line, the indicator will show its one year moving average within a range of +/- 15% (which you can change) for benchmarking purposes. We should consider this range the “normalized” V-R-P for the actual period.
The Zero Line is also marked on the indicator.
Interpretation
When V-R-P is within the “normalized” range, … well... volatility and uncertainty, as it’s seen by the option market, is “normal”. We have a “premium” of volatility which should be considered normal.
When V-R-P is above the “normalized” range, the volatility premium is high. This means that investors are willing to pay more for options because they see an increasing uncertainty in markets.
When V-R-P is below the “normalized” range but positive (above the Zero line), the premium investors are willing to pay for risk is low, meaning they see decreasing uncertainty and risks in the market, but not by much.
When V-R-P is negative (below the Zero line), we have COMPLACENCY. This means investors see upcoming risk as being lower than what happened in the market in the recent past (within the last 30 days).
CONCEPTS:
Volatility Risk Premium
The volatility risk premium (V-R-P) is the notion that implied volatility (IV) tends to be higher than realized volatility (HV) as market participants tend to overestimate the likelihood of a significant market crash.
This overestimation may account for an increase in demand for options as protection against an equity portfolio. Basically, this heightened perception of risk may lead to a higher willingness to pay for these options to hedge a portfolio.
In other words, investors are willing to pay a premium for options to have protection against significant market crashes even if statistically the probability of these crashes is lesser or even negligible.
Therefore, the tendency of implied volatility is to be higher than realized volatility, thus V-R-P being positive.
Realized/Historical Volatility
Historical Volatility (HV) is the statistical measure of the dispersion of returns for an index over a given period of time.
Historical volatility is a well-known concept in finance, but there is confusion in how exactly it is calculated. Different sources may use slightly different historical volatility formulas.
For calculating Historical Volatility I am using the most common approach: annualized standard deviation of logarithmic returns, based on daily closing prices.
Implied Volatility
Implied Volatility (IV) is the market's forecast of a likely movement in the price of the index and it is expressed annualized, using percentages and standard deviations over a specified time horizon (usually 30 days).
IV is used to price options contracts where high implied volatility results in options with higher premiums and vice versa. Also, options supply and demand and time value are major determining factors for calculating Implied Volatility.
Implied Volatility usually increases in bearish markets and decreases when the market is bullish.
For determining S&P500 and Nasdaq-100 implied volatility I used their volatility indices: VIX and VXN (30-day IV) provided by CBOE.
Warning
Please be aware that because CBOE doesn’t provide real-time data in Tradingview, my V-R-P calculation is also delayed, so you shouldn’t use it in the first 15 minutes after the opening.
This indicator is calibrated for a daily time frame.
ESPAŇOL
Este indicador (V-R-P) calcula la Prima de Riesgo de Volatilidad (de un mes) para S&P500 y Nasdaq-100.
V-R-P es la prima que pagan los hedgers sobre la Volatilidad Realizada para las opciones de los índices S&P500 y Nasdaq-100.
La prima proviene de los hedgers que pagan para asegurar sus carteras y se manifiesta en el diferencial entre el precio al que se venden las opciones (Volatilidad Implícita) y la volatilidad que finalmente se realiza en el S&P500 y el Nasdaq-100 (Volatilidad Realizada).
Estoy utilizando la Volatilidad Implícita (IV) de 30 días y la Volatilidad Realizada (HV) de 21 días como base para mi cálculo, ya que un mes de IV se basa en 30 días calendario y un mes de HV se basa en 21 días de negociación.
Al principio, el indicador aparece en blanco y una etiqueta le indica que elija qué índice desea que el V-R-P represente en el gráfico. Use la configuración del indicador (la rueda dentada) para elegir uno de los índices (o ambos).
Junto con la línea V-R-P, el indicador mostrará su promedio móvil de un año dentro de un rango de +/- 15% (que puede cambiar) con fines de evaluación comparativa. Deberíamos considerar este rango como el V-R-P "normalizado" para el período real.
La línea Cero también está marcada en el indicador.
Interpretación
Cuando el V-R-P está dentro del rango "normalizado",... bueno... la volatilidad y la incertidumbre, como las ve el mercado de opciones, es "normal". Tenemos una “prima” de volatilidad que debería considerarse normal.
Cuando V-R-P está por encima del rango "normalizado", la prima de volatilidad es alta. Esto significa que los inversores están dispuestos a pagar más por las opciones porque ven una creciente incertidumbre en los mercados.
Cuando el V-R-P está por debajo del rango "normalizado" pero es positivo (por encima de la línea Cero), la prima que los inversores están dispuestos a pagar por el riesgo es baja, lo que significa que ven una disminución, pero no pronunciada, de la incertidumbre y los riesgos en el mercado.
Cuando V-R-P es negativo (por debajo de la línea Cero), tenemos COMPLACENCIA. Esto significa que los inversores ven el riesgo próximo como menor que lo que sucedió en el mercado en el pasado reciente (en los últimos 30 días).
CONCEPTOS:
Prima de Riesgo de Volatilidad
La Prima de Riesgo de Volatilidad (V-R-P) es la noción de que la Volatilidad Implícita (IV) tiende a ser más alta que la Volatilidad Realizada (HV) ya que los participantes del mercado tienden a sobrestimar la probabilidad de una caída significativa del mercado.
Esta sobreestimación puede explicar un aumento en la demanda de opciones como protección contra una cartera de acciones. Básicamente, esta mayor percepción de riesgo puede conducir a una mayor disposición a pagar por estas opciones para cubrir una cartera.
En otras palabras, los inversores están dispuestos a pagar una prima por las opciones para tener protección contra caídas significativas del mercado, incluso si estadísticamente la probabilidad de estas caídas es menor o insignificante.
Por lo tanto, la tendencia de la Volatilidad Implícita es de ser mayor que la Volatilidad Realizada, por lo cual el V-R-P es positivo.
Volatilidad Realizada/Histórica
La Volatilidad Histórica (HV) es la medida estadística de la dispersión de los rendimientos de un índice durante un período de tiempo determinado.
La Volatilidad Histórica es un concepto bien conocido en finanzas, pero existe confusión sobre cómo se calcula exactamente. Varias fuentes pueden usar fórmulas de Volatilidad Histórica ligeramente diferentes.
Para calcular la Volatilidad Histórica, utilicé el enfoque más común: desviación estándar anualizada de rendimientos logarítmicos, basada en los precios de cierre diarios.
Volatilidad Implícita
La Volatilidad Implícita (IV) es la previsión del mercado de un posible movimiento en el precio del índice y se expresa anualizada, utilizando porcentajes y desviaciones estándar en un horizonte de tiempo específico (generalmente 30 días).
IV se utiliza para cotizar contratos de opciones donde la alta Volatilidad Implícita da como resultado opciones con primas más altas y viceversa. Además, la oferta y la demanda de opciones y el valor temporal son factores determinantes importantes para calcular la Volatilidad Implícita.
La Volatilidad Implícita generalmente aumenta en los mercados bajistas y disminuye cuando el mercado es alcista.
Para determinar la Volatilidad Implícita de S&P500 y Nasdaq-100 utilicé sus índices de volatilidad: VIX y VXN (30 días IV) proporcionados por CBOE.
Precaución
Tenga en cuenta que debido a que CBOE no proporciona datos en tiempo real en Tradingview, mi cálculo de V-R-P también se retrasa, y por este motivo no se recomienda usar en los primeros 15 minutos desde la apertura.
Este indicador está calibrado para un marco de tiempo diario.

ATR Report & Tool█ OVERVIEW
This indicator reports the historical probabilities of the price trading past its Average True Range (ATR).
█ CONCEPTS
It is common knowledge that the market is not likely to trade past 1x ATR. Is this true? How much unlikely exactly? The indicator reports the data in a table and tells you precisely how often the price made it past x times ATR.
You have identified two plausible entries at different price structures or two targets at significant projections; which one should you choose? While is it possible to reach them, is this indeed probable? The indicator complements your analysis for making sounds trading decisions.
█ FEATURES
Price Selection Tool
The indicator has a price selection tool embedded. You can select a price on the chart and it will show the distance relative to the ATR so you can easily refer to the historical probability table.
Multi-Timeframe
By default, the indicator uses the daily timeframe for analyzing how much price moves compared to its average volatility during a day. To the same extent, you can set it to any other timeframe.
Configurable ATR
• Pick your preferred smoothing between the Simple Moving Average (SMA) or the Relative Moving Average (RMA).
• Set the length for getting the average price movement. For example, you can set it to 20 for the daily ATR (20 trading days in a month), 12 for the weekly ATR (3 months), or 6 for the monthly ATR.
• Select the reference between “previous” or “current” ATR value (default set on previous).
Data Window
The indicator provides additional volatility-related values and reporting data.
Others
Automatically hides the indicator when the chart’s timeframe is higher than the indicator’s one.
█ NOTES
Calculation
The volatility is calculated from the selected period's low to high. It may use the previous close when the market gaps up/down.

IB + ExtensionsInitial Balance with Extensions.
Other traders have posted similar indicators. I wrote my own because I wanted additional features.
Features:
Supports up to 9 extensions. Default = 3.
Each extension is filled using an automatic gradient. Fill can be disabled if you like.
IB levels extend into the future to the end of the current session.
By default only the current IB levels are shown, but you can enable past IB's as well.
When showing past IB's, each session has a clean break - no awkward lines connecting one session to the other (this really annoyed me about other IB indicators!)
The IB midpoint is also supported. It is on by default, but can be disabled.
You may notice the midpoint of past IB's looks different than the current IB . There is a technical reason for this that I won't go into here. Ask if you want the full explanation.
NOTE: This indicator was designed for the crypto charts. It may have some rendering issues when used with other markets.

[DisDev] Market Maker | Technical Time AnalysisThis indicator has three main components: Days of Week Separators , User-Customized Reminder Notes , and Projected Lines . Each component is explained and demonstrated how it could be used as a trading tool.
The basis of this indicator is to analyze past price movements and then project them as a reminder for traders that previously, at that particular time, there was a price increase/decrease.
1) Vertical lines and labels separate days of the week.
a. The vertical lines allow you to quickly see what day of the week the price movement occurred. For example, if a notable price move happens on Monday, you can use the “Reminder Notes” input to enter a note directly on the chart, as explained below.
b. You can select different colors and styles for the lines or background.
2) Vertical lines can be customized to be displayed in the past and future.
a. This allows you to select a specific time when price has increased/decreased, see how often this has occurred, then notate it as a reminder in the future.
3) User-customized reminder notes for future projected lines.
a. This allows you to input notes to be displayed with the future projected lines.
b. Example: You notice that at 06:45, there had previously been significant price action. Your notes can be updated directly on the chart to remind you of them just before 06:45 on the following days.
Below is the indicator in full use.
You can adjust each line's style, width, color, and reminder notes.

Nearest Percentile Moving Average BandsWhile coding some filters into another indicator for Long/Short I noticed that ta.nearest.percentile might be the most useful tool in pinescript I've ever encountered.
While percentile_nearest can be used for all kind of things I decided to code moving averages from it and made bands for bottom percentage and top percentage.
The indicator will calculate the top % price of the given bar length.
Example settings:
length: 150
percentile: 99
So when using 99% it will draw a green line when price is moving above the top 1% price of the last 150 candles. It then calculates if the price is below the bottom 1% of the last 150 candles.
Trading use:
Use this indicator to check if the market is leaving normal territory. This signals a breakout move for example the dogecoin pump or the top of the range. I use this indicator to catch bull/bear moves for botting purposes. An other use would be to countertrend trade after the move has ended. With price being in top 1% for a while it is very probable that we see a large correction.
Below example of dogecoin pumps:

SVDThis indicator aims to compare between two charts if trader isn't sure which one is more active and powerful, it does NOT show entries or help your chart analysis directly.
The main features of this indicator is to show vitality and range of any given chart.
Volatility: it calculates the average profit of every swing in the range and the final result will be the chart volatility, which indicate how profitable this chart is.
Range: it calculates the profit of the whole range compared to the total price. (E.g. range bottom is 0.1 and range top is 0.2 the range will be 100%)
Extra: indicator shows the total direction of the chart in term of (STRONG UPTREND, UPTREND, SIDEWAYS, DOWNTREND, STRONG DOWNTREND), if you got (Somthing_wrong) please contact me.
How to use: apply the indicator on different charts that you have chosen and the higher (volatility & range) the more profitable the chart is.
inputs:
Lookback length: how long the range is (how many candles are included).
How intense should the Swing be: how many candles should be counted as a confirmation complete swing.
Show counted Swings: if checked as true, will show the swings counted in the volatility calculation.
For any notes on the indicator to be edited, or for another indicator ideas please comment.

Percentage Range IndicatorThe Percentage Range Indicator is useful for assessing the volatility of pairs for percentage-based grid bots. The higher the percentage range for a given time period, the more trades a grid bot is likely to generate in that period. Conversely, a grid bot can be optimised by using grids that are less than the Percentage Range Indicator value.
I have been using the Percentage Range Indicator based on the one hour time period and 168 periods of smoothing (seven days based on one-hour periods).
Enjoy.

Basic Shannon Entropy & DerivativesThis script performs the basic Shannon entropy on the closing value of the stock. Additionally, it performs the trailing first and second derivatives of the Shannon Entropy, giving you more information about its movement.
You can change the "Source" to be whatever value you like.

Sessions with High/Low DiffThe main purpose of this indicator is to facilitate backtesting, but it may also be useful for traders to easily identify the current
active/open trading sessions on lower-timeframe charts.
This indicator also tracks the session high/low difference and plots it as a label on the last candle of the session once the last
bar of that session has finished printing and a new candle opened. The position and direction of the label is based on the
session open and close - if the session open is greater than the session close (which would equate to the equivalent of a red candle),
the label will be printed UNDER the last candle, and vice versa if the session close is above the session open.
The number printed inside the label is the difference between the session high and the session low, scaled to the minimum tick value of the chart.
Note #1: There is a Pinescript maximum of 500 labels allowed on any chart. While I could have gotten fancy and done some wizardry with label arrays,
I didn't really see a point to it. If labels are enabled for all 4 sessions at the same time, that would still have them available for the past 125
sessions, which would be about 6 months (approx 252 trading days per year, and this would cover 125 of them). If you limit to 2 sessions, you double
your potential look-back to almost a year (250 days out of the 252 average trading days each year), and for a single session, you double it yet again
to just under 2 years.
Note #2: As this indicator tracks open, high, low, and close for each session, it can potentially be enhanced (or forked) to construct "session candles".
I'm not sure what use this would be to anyone, but the pieces are there should someone find a use for it.
While it would be easy to add alerts on sessions opening/closing, I didn't see a purpose or value in that as it would be little more than a
glorified alarm clock. If I get enough demand to add them, I will gladly consider it.

rv_iv_vrpThis script provides realized volatility (rv), implied volatility (iv), and volatility risk premium (vrp) information for each of CBOE's volatility indices. The individual outputs are:
- Blue/red line: the realized volatility. This is an annualized, 20-period moving average estimate of realized volatility--in other words, the variability in the instrument's actual returns. The line is blue when realized volatility is below implied volatility, red otherwise.
- Fuchsia line (opaque): the median of realized volatility. The median is based on all data between the "start" and "end" dates.
- Gray line (transparent): the implied volatility (iv). According to CBOE's volatility methodology, this is similar to a weighted average of out-of-the-money ivs for options with approximately 30 calendar days to expiration. Notice that we compare rv20 to iv30 because there are about twenty trading periods in thirty calendar days.
- Fuchsia line (transparent): the median of implied volatility.
- Lightly shaded gray background: the background between "start" and "end" is shaded a very light gray.
- Table: the table shows the current, percentile, and median values for iv, rv, and vrp. Percentile means the value is greater than "N" percent of all values for that measure.
-----
Volatility risk premium (vrp) is simply the difference between implied and realized volatility. Along with implied and realized volatility, traders interpret this measure in various ways. Some prefer to be buying options when there volatility, implied or realized, reaches absolute levels, or low risk premium, whereas others have the opposite opinion. However, all volatility traders like to look at these measures in relation to their past values, which this script assists with.
By the way, this script is similar to my "vol premia," which provides the vrp data for all of these instruments on one page. However, this script loads faster and lets you see historical data. I recommend viewing the indicator and the corresponding instrument at the same time, to see how volatility reacts to changes in the underlying price.

Portfolio Performance - Effects of RebalancingFunction:
- Can be used to evaluate the performance of a portfolio containing 2 assets over a set time interval
- Shows the % return of the portfolio over the time interval defined by the user
- Includes a threshold rebalancing algorithm to show the effects that rebalancing has on the portfolio over the long term
- Created to evaluate of the performance of portfolios containing different weightings of stocks and bonds over time assuming that the user would rebalance the portfolio when asset weights crossed a threshold
Instructions:
- To be used with dividends adjustments turned on
- Add this script to a symbol. e.g. AMEX:SPY
- Click the chart to define the entry time and the exit time. i.e. the time interval
- Define the initial investment of the portfolio. Default setting is $100,000
- Define the second asset to be included in the portfolio. e.g. BATS:AGG
- The strategy comes pre-populated with a portfolio that has a weight of 80% asset 1 and 20% asset 2. i.e. 80% AMEX:SPY and 20% BATS:AGG if the symbols mentioned above were chosen
- The 7 lines show the weighted % return of each portfolio over the time period defined by the user
- Each line (except the blue) is the return based on a different rebalancing threshold. The default settings are 1%, 2.5%, 5%, 10%, 15%, 20%, 30%
- The blue line is the % return of a portfolio that was made up of 100% asset 1 over the time interval. i.e. 100% AMEX:SPY
- Asset weights and rebalancing thresholds are adjustable via the settings
- Each plot can be turned on and turned off via a tick box in the settings

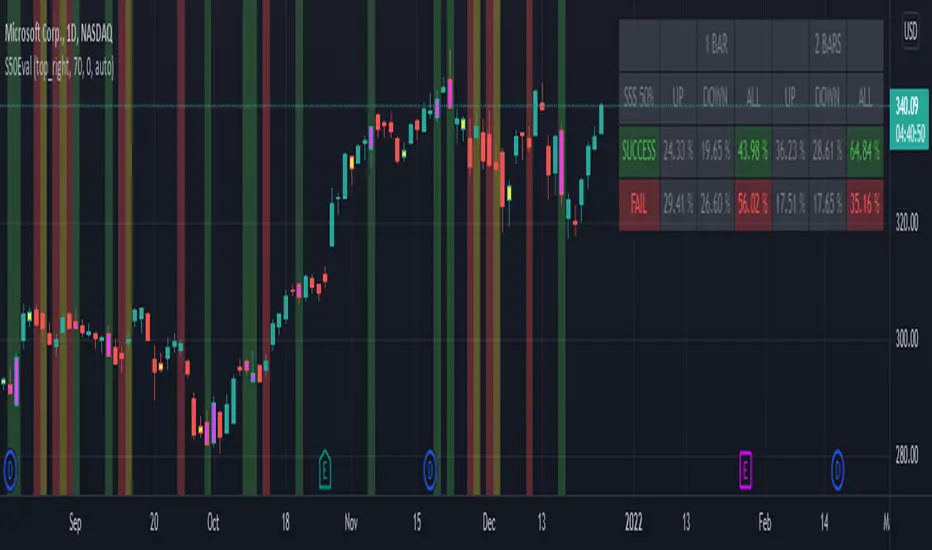
[BM] SSS 50% Rule EvaluatorSara Strat Sniper 50% Rule Evaluator
█ OVERVIEW
This indicator is based on Sara Strat Sniper's - 50% Rule for trading Outside Bars and helps you to evaluate the historical success rate of that rule.
█ FEATURES
Calculation
• You can choose to evaluate only the current bar to see if it forms an outside bar (success) or not (fail), but you can also choose to include the next bar to see if that one forms a compound outside bar.
• You can enable a start and/or end date to limit the calculation period.
Table
• Show or hide the table with the calculation results.
• Show or hide the calculation details (up/down data).
• Position of the table, opacity, cell width and text size can be customized.
Colors
• Table colors can be customized.
• You can choose to show the inside/outside bars in customizable bar colors.
• You can choose to identify successful/failed/recovered outside bars in customizable background colors.
█ LIMITATIONS
• This script uses a special characteristic of the `security()` function allowing the inspection of intrabars — which is not officially supported by TradingView.
• Intrabar inspection only works on some chart timeframes: 5, 10, 15, 30, 45 and 195 minutes, 1, 2, 3, 4, 5, 6, 7 and 8 hours, 1, 2, 3, 4 and 5 days, 1, 2, 3 and 4 weeks, 1, 2, 3, 4, 5, 6, 7, 8, 9, 10, 11 and 12 months. The script’s code can be modified to run on other resolutions.
• There is a limit to how far back intrabar calculations can be performed, and is dependant on both the intrabar resolution and your subscription (which determines the number of available bars).
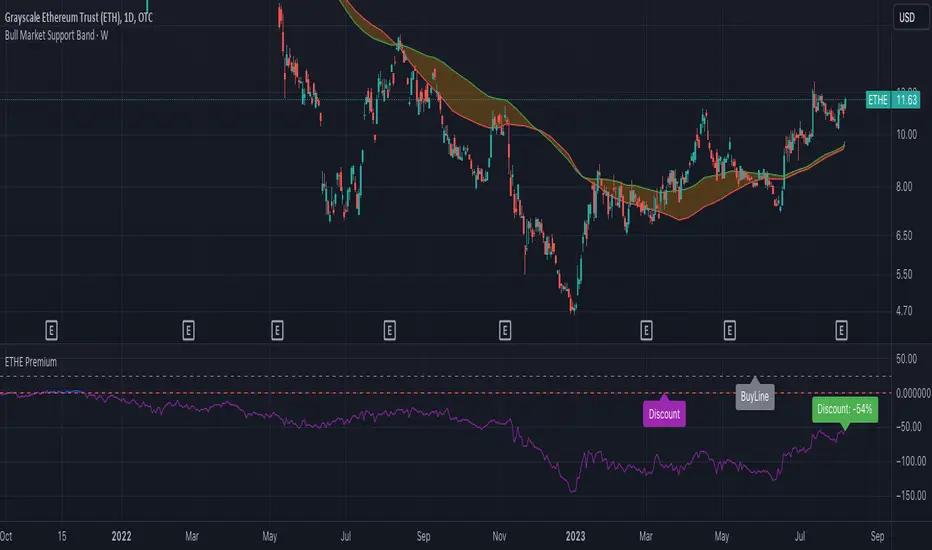
ETHE PremiumShows the premium/discount for Grayscale ETHE vs. the fractional amount of ETH per share held.
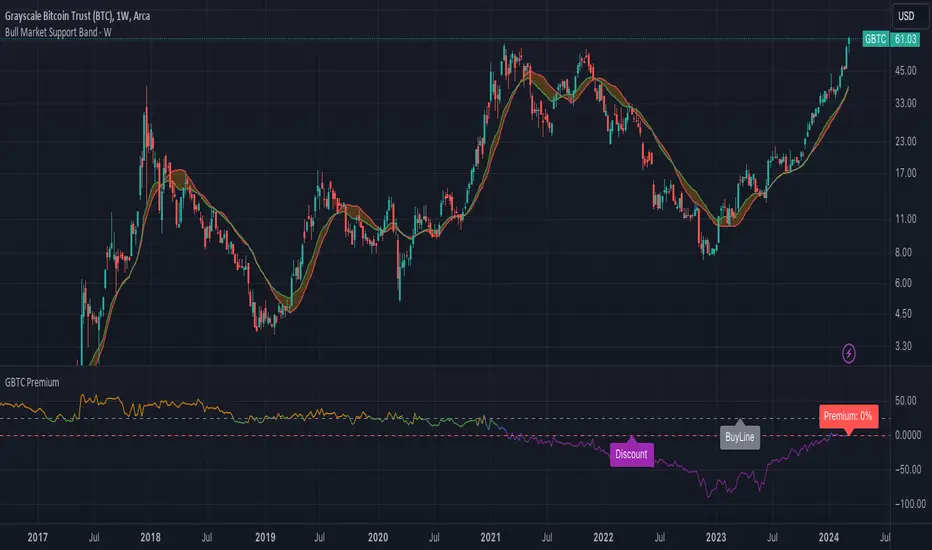
GBTC PremiumCalculates the historical and current premium/discount for a share of Grayscale GBTC vs. Bitcoin spot price.
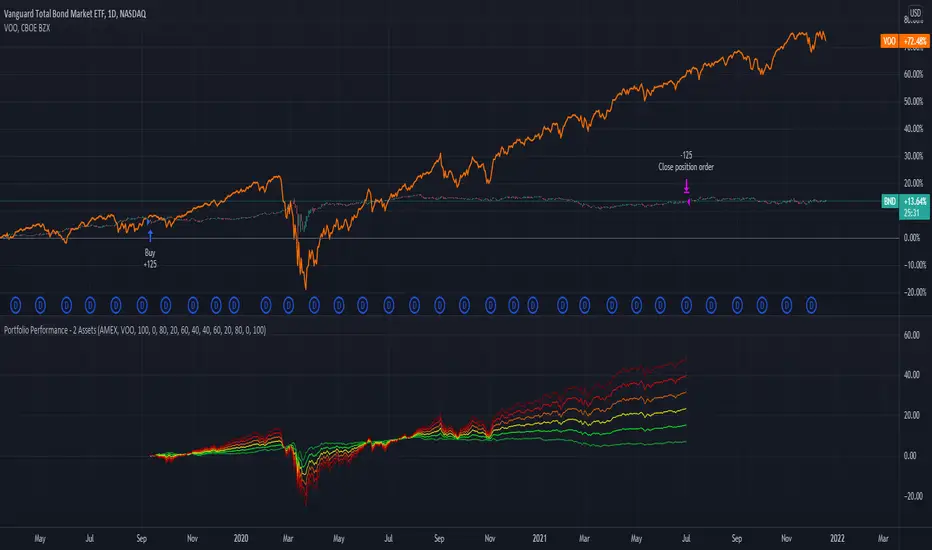
Portfolio Performance - 2 AssetsFunction:
- Can be used to evaluate the performance of portfolios containing 2 assets over a set time interval
- Created to evaluate of the performance of portfolios containing different weightings of stocks and bonds over time
- Shows the % return of each portfolio over the time interval defined by the user
- Capable of showing the risk adjusted % return of each portfolio over the time interval defined by the user (setting turned off by default)
Instructions:
- To be used with dividends adjustments turned on
- Add this script to a symbol. e.g. NASDAQ:BND
- Click the chart to define the entry time and the exit time. i.e. the time interval
- Define the second asset to be included in the portfolio. e.g. AMEX:VOO
- The strategy comes pre-populated with 6 portfolios with the most common stock/bond weightings (100% stocks/0% bonds, 80% stocks/20% bonds, 60% stocks/40% bonds, et cetera)
- The 6 lines show the weighted % return of each portfolio over the time period defined by the user
- All asset weights are adjustable via the settings
- Each plot can be turned on and turned off via a tick box in the settings
- There are 6 plots that show the risk adjusted returns of each portfolio (setting turned off by default)
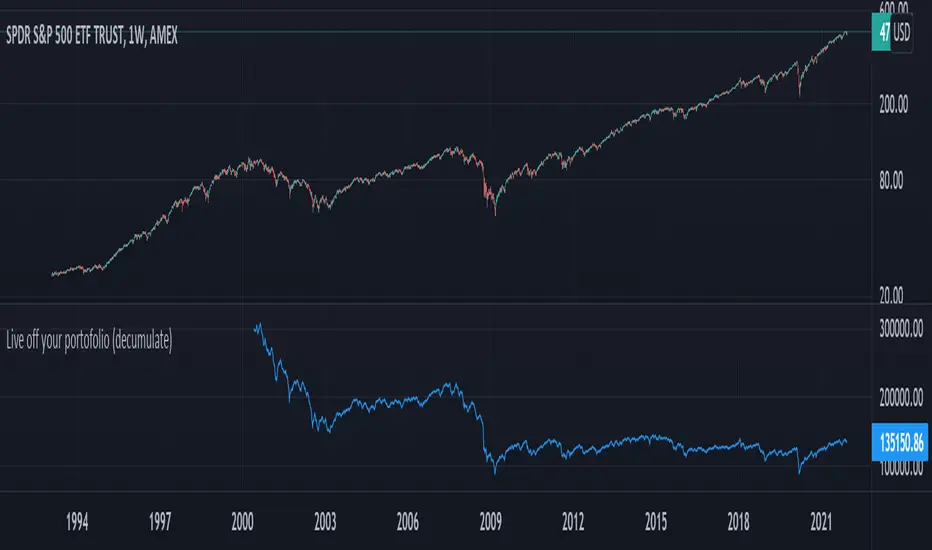
Live off your portofolio (decumulate)This indicator simulates living off your portofolio consisting of a single security or stock such as the SPY etf or even Bitcoin. The simulation starts at a certain point on the chart (which you input as year and month).
Withrawals from the portofolio are made each month according to the yearly withdrawal rate you enter, such as the 4% SWR. The monthly withdrawal income is calculated in USD at the beginning of the retirement period and then adjusted according to the US inflation (CPI) on 01/01 of each year.
The blue graph represents the USD value of the remaining portofolio.
This indicator is meant to be used on daily, weekly or monthly time frame. It may not work properly (and makes little sense to use) on intraday timeframe or larger time frames such as quarterly (3M).
When withdrawing, the indicator considers that fractional stock values can be used (the portofolio value is kept as a float). This may not be true, as most stock brokers currently don't allow this.
It does not explicitly take into account dividends. In order to do this you will have to enable "Adjust for dividends" by clicking on "adj" in the lower right corner of the screen, or by using the indicator on a Total Return (TR) index such as DAX. Unfortunately SPX does not have dividend data, you will have to use the SPY etf (which doesn't have a long history)
Price Action [Morty]This price action indicator uses the higher timeframe SSL channel to identify trends.
The long entry signal is a bullish candlestick pattern when the price retraces to EMA20 in an uptrend.
The short entry signal is a bearish candlestick pattern when the price retraces to the EMA20 in a downrend.
Currently, this indicator shows engulfing patterns, pin bar patterns, 2 bar reversal patterns and harami patterns.
It also shows a volatility squeeze signal when the Bollinger bands is within the Kelter channels.
The buy and sell signal can also be filter by the ADX indicator greater than a threshold.
You can set your stoploss to the previous low/high when you go long/short.
The risk/reward ratio could be 1 to 1.5.
This indicator can be used in any market.

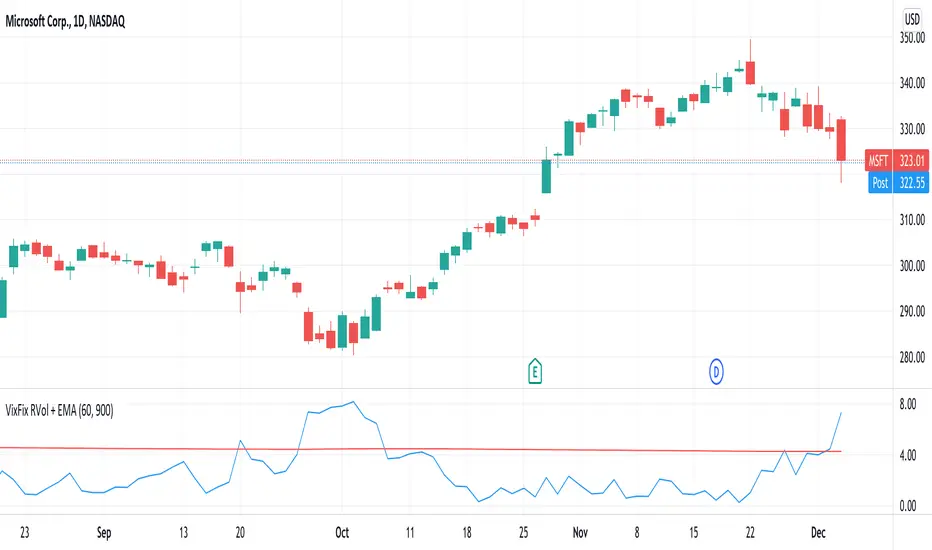
VixFix RVol + EMAThis indicator plots Realised Volatility (measured using VixFix method) against its long-term exponential moving average.
RVol breaking above its EMA = Sell signal
RVol breaking below its EMA = Buy signal
60-day VixFix look back period and 900 day EMA work well for lower volatility tickers (equity ETFs, megacap stocks). Higher volatility tickers could benefit from shorter look back period and EMA.
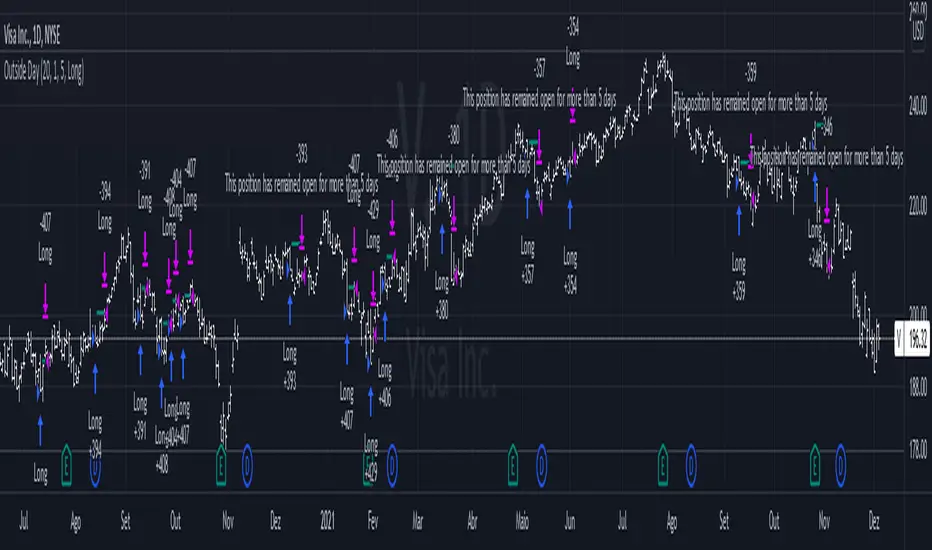
Outside DayThis strategy is taken from Perry Kaufman's book "Trading System and Methods".
You can enter on the direction of the candle, or opposite to it. I find that the opposite tends to yield better results in volatile assets, allowing a better reward to risk ratio. There is no stop loss in this strategy, only a fixed take profit and a time limitation.
GreatBlueTradingTeam FibDev SignalsScript Purpose:
This script was designed to look for trend reversals and be used with other TA tools to help build confluence for day traders.
TA Used:
Without diverging too much information, this script relies on Highs, Lows, Opens, EMAs, Standard Deviations, Fib Numbers, and Fib Levels.
Script Overview:
First we look at the price action found on the Daily chart to create a set of zones using Fibs and Standard Deviations thats serves as our gauge on how far the price will move on any given day. Then, we create another set of zones ("intraday" zones if you will) that are built on much faster price action and relevant to the chart time period that is selected. These zones are also created using a combination of Fibs and Standard Deviations. From here, we compare the intraday price action with these two zones and look for areas where we feel overbought or oversold conditions are forming to create the bullish or bearish signals provided by the indicator.
Script Shortcomings:
Due to the fact this script is looking for breaks in trends, or trend reversals, it is subject to high risk especially in times of strong market trends where it could experience repeated failed signals. We recommend using this script in combination with other forms of TA for additional confluence as well as general market awareness that may influence trends and market behavior.
Script Access:
Please PM us to obtain information about accessing this script, or view our profile for contact information.

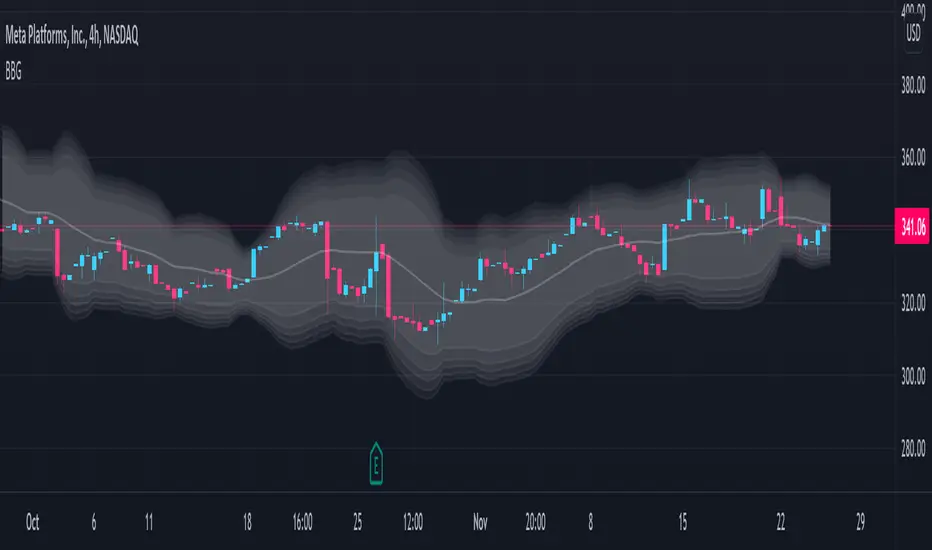
Bollinger Band Gradient (BBG)The Bollinger Band Gradient Indicator uses plenty of Bollinger Bands to create a gradient-looking indicator to help with layered entries . It is similar to a Ribbon but better. This indicator is best used with any volume-related indicator so you can recede from entering into any position with too much momentum to rebound off of any line. Note that this indicator is best used with another strategy like pair trading. It is not recommended to trade based on this indicator only . Please stay aware of any news about the stock you are trading because some events may have a big impact and force the market to go bullish/bearish by a lot. This indicator can be used with all chart types and works well with many other indicators. It allows for complete customization and offers easy-to-understand settings which can be designated to a certain individual. You can modify all settings for the BBs which allows for an even more personalized and adapted Indicator that reflects your trading/ investing needs. You also have the option to choose which type of MAs will be used to create the Bollinger Bands , a few of which include: SMA, EMA, WMA, HMA, RMA, DMA, LSMA, VAMA, TMA, MF.
Bollinger Bands are a way to measure and visualize volatility . As volatility increases, the wider the bands become, and the more they deviate from the basis. Likewise, when volatility decreases, the gap between the bands and basis decreases. Yet a big advantage for not only this but many other indicators is created due to the ample count of different settings that are widely used, it is difficult to view the market through the eyes of all types of investors/traders . This indicator manages to counter exactly this issue, you will be able to see all of these settings on one chart and at one time and enter/exit positions accordingly.
Using this indicator will allow you to visualize entry and exit points with ease and make order layering (buying/selling in layers) much more simple. You can choose a certain amount of Bollinger Bands you would like displayed and customize all technical and style-related settings related to the BBs .
A few of the technical settings you can change for the Bollinger Bands are:
Bollinger Band count (Select how many BBs you want to be displayed.)
MA type used to make the Bollinger Bands ( EMA, SMA, WMA, etc.)
Source (close, open, high, low.)
BB length separately (The length of each Bollinger Band, its lookback. How many previous candles should it be based on? Choose each Bollinger Band's lookback length.)
BB deviator separately(The standard Deviator applied for the BB for both the upper and lower line.)
A few of the style settings you can change for each Bollinger Band are:
Fill (the color used to fill from the upper to the lower band)
Fill opacity % (the opacity used when filling the upper line to the lower line)
This indicator is unique because it can be used for all strategies and all trading styles , for example, day trading or long-term investing, really anything if used correctly. The reason it can be used in so many instances is a result of the detailed and in-depth settings tab that allows for complete customization. This allows the indicator to be used and to be useful in various situations and allows you to dominate the market. Integrated alerts also enhance your efficiency while using this indicator because you can choose to be notified at the crossing of any of the Bollinger Bands.
The technical part of this indicator plots the selected amount of Bollinger Bands using custom-built specified Bollinger Bands accordingly. Then it uses the style settings and styles it as you selected.