Volatilità storica

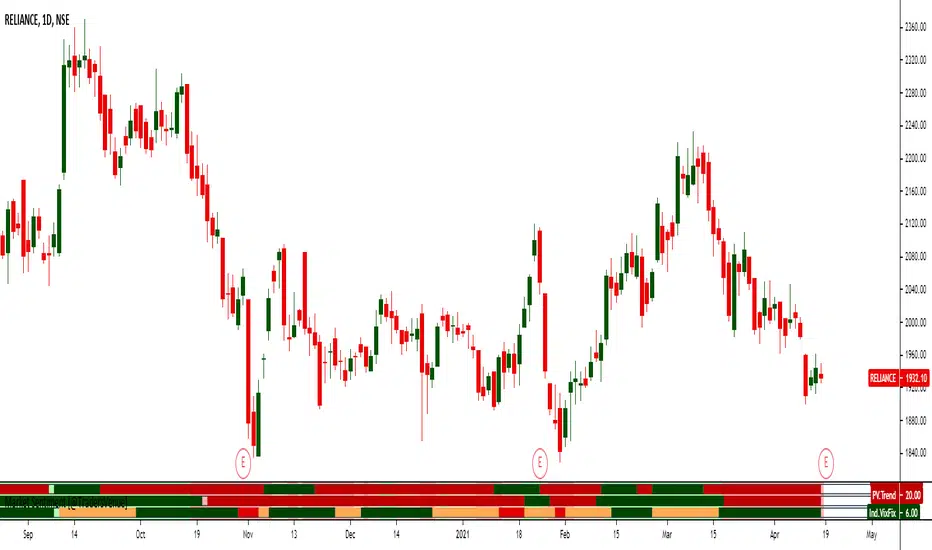
Market Sentiment [@TradersVenue]This majorly combines 3 indicators. More detailed usage will be taught to the subscribers as part of webinars to understand how to use these along with VSA to improve the trading results.
1)Mean Revert Indicator (M.Revert) - Most useful for intraday. When M.Revert bar turns red its ideally a sell signal. When M.Revert bar turns green its buy signal.
2)PV.Trend is nothing but price volume trend. Green bullish, red bearish.
3) Ind.VIxFix - Its India VIX. When its red it means VIX is shooting up and chances of fall is higher. When VIX turns green VIX is cooling down and market may consolidate or go higher.
When VIXFIX turns green its a good time to sell straddle or strangles and avoid neutral strategies when red. Additionally when VIXFix turns red, simply exit the losing leg holding the other leg of the neutral strategy. It helps.
Tradespot - VolatilityTradespot Volatility
A simple, effective representation of volatility within a given asset.
Works out of the box, no configuration required
Allows a trader, especially on leverage, to identify areas of high/low volatility that might influence their exit and entry strategy
Outlier spikes or dips in volatility
Visual representation of a market that is accumulating or a market going parabolic which can help influence your exit and entry parameters
Want to know more or have questions? Come join the Tradespot community, or send me a message on TradingView.

MOVE/VXTLT CorrelationMany know of the VIX for equity trading. Yet, many are unaware that there is the same kind of volatility measure for trading bonds, called the MOVE Index.
"The Merrill Lynch Option Volatility Estimate (MOVE) Index is a yield curve weighted index of the normalized implied volatility on 1-month Treasury options which are weighted on the 2, 5, 10, and 30 year contracts."
With this script one can see the the correlation and divergences between bonds and its volatility measure to make educated decisions in trading or hedging.
The idea of this script comes from NicTheMajestic.

Relative Historical Volatility MCMRelative Historical Volatility
Historical Volatility is relative to it's doubled lookback period of the historical volatility to calculate relative historical volatility.
Including a standard deviation to calculate the volatility value itself is useless. It filters out 32% of the most volatile movements of the asset that you are observing.
Example of RHV:
Period of Volatility Value (POVV) : 10
Relative Historical Volatility : POVV / POVV*2
Historical Volatility of past 10 Bars is compared to the historical volatility of the bast 20 bars to show real growth/decrease of volatility relative to the time of the performing asset.
Comparing historical volatility to the current bar includes much more noise, the relative historical volatility can be perceived as a smoothed historical volatility ind.
Marginal notes:
Added standard deviations adjusted to the relative volatility value to predict probable future volatility of the stock.


[co.n.g] - Simple CVD over MAThis Single Volume Delta (SVD), respectively Cumulative Volume Delta (CVD) is a really simple script computing the difference of the volume of the actual in comparison the the volume of the "Calculation Bars Threshold", calculated by smoothing through a simple moving average - the "CVD MA Smoothing".
Therefore, if the "Calculation Bars Threshold" and the "CVD MA Smoothing" are set to 1, the script will display the difference of the actual compared to the previous candle;
furthermore, if the "Calculation Bars Threshold" is set to 3 and the "CVD MA Smoothing" is set to 14, then the indicator will display the the summed difference of the past 3 values, smoothed over a period of 14 candles.
This indicator may also be set to a different time frame, allowing multi time frame analysis; f.e. if you're going to set a lower time frame than the actual, the deltas of the lower time frame will be displayed and will be showing the volume trend of the lower time frame; if you're going to set a higher time frame, this is respectively working as described.
To understand volume and price action, it is - imho - especially helpful to display the volume of higher time frames to visualize the "Where the heck am I and what are the big players doing?"
This indicator is coloring the histogram in green as positive, red as negative and gray as indecisive CVD.
Hopefully, this will be helpful in your VSA and your trading decisions.
Cheers,
Constantine
p.s.: I am also working on a far more sophisticated version of SVD/CVD, so stay tuned!

Annualised Price Volatility %Annualised Price Volatility in percent, also called Instrument Risk, as outlined by Rob Carver in his excellent books, 'Systematic Trading' and 'Leveraged Trading'.
This is written for those who have read one of his books and want to use this tool on TradingView.
Trend strength, oscillators, and volume indicators are all the rage. Finding a great setup is, of course, key. You've decided to go long. Great!
But how much is your capital at risk?
How does that compare with your level of risk tolerance?
When trading, it's key to understand just how risky a certain instrument is. An uptrend is an uptrend, but is it at an annualised volatility of 2% per year or 500% per year? If it's the former, I know I can put a good chunk of capital into trading it. But if its the latter, I don't want to put so much money at risk. Volatility is rarely in a straight line. It's usually up and down.
I won't give the whole game away. To find out more about how to use this concept of risk, I'd highly recommend the books 'Leveraged Trading' and 'Systematic Trading' by Rob Carver.
Do you have any thoughts, ideas, or questions? Let me know in the comments or send me a message! I'd be glad to help you out.

All-time high and percentage dropsThis script calculates the ATH of whichever chart you use and plots it in blue
There is also an option to display the following ATH percentages: 90, 80, 70, 60, 50, 40 and 30 in white

Statistical and Financial MetricsGood morning traders!
This time I want to share with you a little script that, thanks to the use of arrays, allows you to have interesting statistical and financial insights taken from the symbol on chart and compared to those of another symbol you desire (in this case the metrics taken from the perpetual future ETHUSDT are compared to those taken from the perpetual future BTCUSDT, used as a proxy for the direction of cryptocurrency market)
By enabling "prevent repainting", the data retrieved from the compared symbol won't be on real time but they will static since they will belong to the previous closed candle
Here are the metrics you can have by storing data from a variable period of candles (by default 51):
✓ Variance (of the symbol on chart in GREEN; of the compared symbol in WHITE)
✓ Standard Deviation (of the symbol on chart in OLIVE; of the compared symbol in SILVER)
✓ Yelds (of the symbol on chart in LIME; of the compared symbol in GRAY) → yelds are referred to the previous close, so they would be calculated as the the difference between the current close and the previous one all divided by the previous close
✓ Covariance of the two datasets (in BLUE)
✓ Correlation coefficient of the two datasets (in AQUA)
✓ β (in RED) → this insight is calculated in three alternative ways for educational purpose (don't worry, the output would be the same).
WHAT IS BETA (β)?
The BETA of an asset can be interpretated as the representation (in relative terms) of the systematic risk of an asset: in other terms, it allows you to understand how big is the risk (not eliminable with portfolio diversification) of an asset based on the volatilty of its yelds.
We say that this representation is made in relative terms since it is expressed according to the market portfolio: this portfolio is hypothetically the portfolio which maximizes the diversification effects in order to kill all the specific risk of that portfolio; in this way the standard deviation calculated from the yelds of this portfolio will represent just the not-eliminable risk (the systematic risk), without including the eliminable risk (the specific risk).
The BETA of an asset is calculated as the volatilty of this asset around the volatilty of the market portfolio: being more precise, it is the covariance between the yelds of the current asset and those of the market portfolio all divided by the variance of the yelds of market portfolio.
Covariance is calculated as the product between correlation coefficient, standard deviation of the first dataset and standard deviation of the second asset.
So, as the correlation coefficient and the standard deviation of the yelds of our asset increase (it means that the yelds of our asset are very similiar to those of th market portfolio in terms of sign and intensity and that the volatility of these yelds is quite high), the value of BETA increases as well
According to the Capital Asset Pricing Model (CAPM) promoted by William Sharpe (the guy of the "Sharpe Ratio") and Harry Markowitz, in efficient markets the yeld of an asset can be calculated as the sum between the risk-free interest rate and the risk premium. The risk premium of the specific asset would be the risk premium of the market portfolio multiplied with the value of beta. It is simple: if the volatility of the yelds of an asset around the yelds of market protfolio are particularly high, investors would ask for a higher risk premium that would be translated in a higher yeld.
In this way the expected yeld of an asset would be calculated from the linear expression of the "Security Market Line": r_i = r_f + β*(r_m-r_f)
where:
r_i = expected yeld of the asset
r_f = risk free interest rate
β = beta
r_m = yeld of market portfolio
I know that considering Bitcoin as a proxy of the market portfolio involved in the calculation of Beta would be an inaccuracy since it doesn't have the property of maximum diversification (since it is a single asset), but there's no doubt that it's tying the prices of altcoins (upward and downward) thanks to the relevance of its dominance in the capitalization of cryptocurrency market. So, in the lack of a good index of cryptocurrencies (as the FTSE MIB for the italian stock market), and as long the dominance of Bitcoin will persist with this intensity, we can use Bitcoin as a proxy of the market portfolio

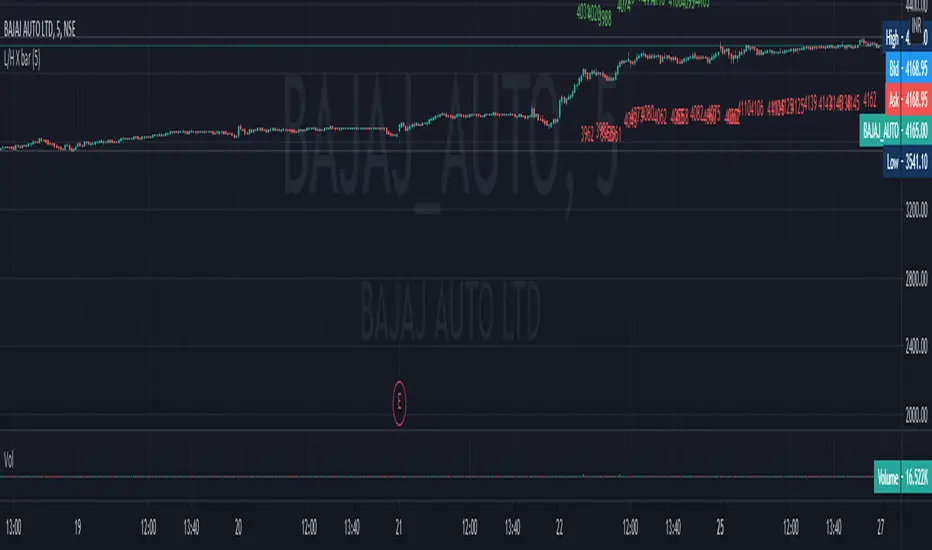
low and high X Bars//This script finds High and Low X bars back. Simple pine script, can customize lookback period.
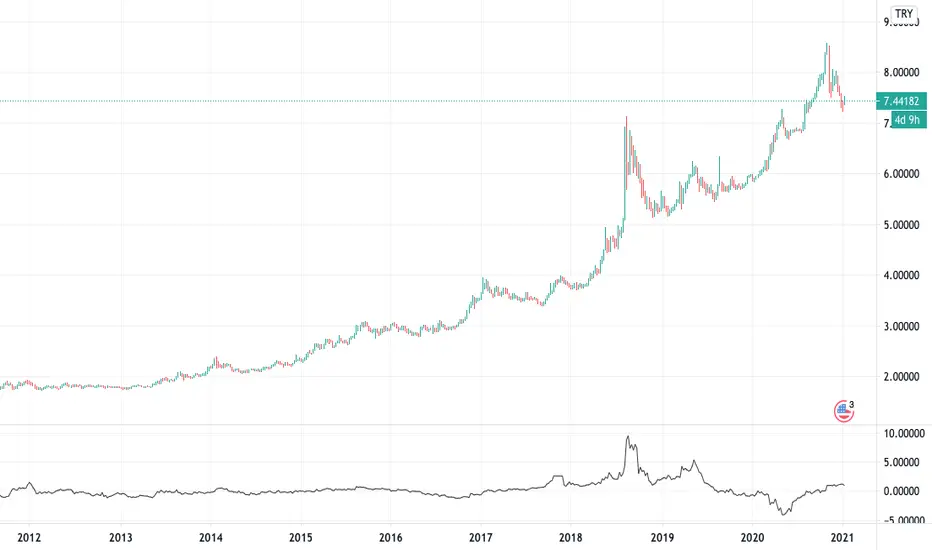
Turkey Yield Curve SpreadYield spreads are used to see investors' perception of future risk and predict a recession. The spread is the value obtained by subtracting the near term bond from the distant one. This indicator plots this value historically. I used 3-year and 10-year Turkey treasury bond yields instead of 2-year and 10-year Turkey treasury bond yields due to lack of historical data on Tradingview.
Realized Volatility (annualized for any time frame)Plots standard deviation of returns (realized volatility), and annualizes it for the selected timeframe. Suitable for forex/cryptocurrencies which trade 24/7.

Indices Sector SigmaSpikes█ OVERVIEW
“The benchmark Dow Jones Industrial Average is off nearly 300 points as of midday today...”
“So what? Is that a lot or a little? Should we care?”
-Adam H Grimes-
This screener aims to provide Bird-Eye view across sector indices, to find which sector is having significant or 'out-of-norm' move in either direction.
The significance of the move is measured based on Sigma Spikes, a method proposed by Adam H. Grimes, where Standard Deviation of returns used as a baseline.
*You can google his blog or read his book, got some gold in there, especially on how he use indicators for trading
█ Understanding Sigma Spikes
As described by Grimes, moves in markets are only meaningful when we consider what “normal” is for that market.
Without that baseline, the daily change number, and even the percent change on the day doesn’t really mean much.
To overcome that problem, Sigma Spikes, as a measure of volatility, attempt to put todays change in price (aka return) in context of the standard deviation of 20 days daily's return.
Refer chart below:
1. The blue bars refer to each days return
2. The orange line is 1 time standard deviation of past 20days daily's return (today not included)
3. The red line is 2 time standard deviation of past 20days daily's return (today not included)
Using the ratio of today's return over the Std Deviation, determining your threshold (1,2,3,etc) will be the key that tells if today's move is significant or not.
*Threshold referring to times standard deviation, and different market may require different threshold.
*20 Days period are based on the Lookback Period, adjustable from user input window.
█ Features
- Scan up to 13 symbols at a time (Bursa (MYX) indices are defaulted, but you may change to any symbols/index from the user input setting)
█ Limitation
- Due to multiple use of security() function required to call other symbols, expect the screener to be slow at certain times
- Custom Timeframe currently accept only Daily and Weekly. I'll try to include lower timeframe in the next update
█ Disclaimer
Past performance is not an indicator of future results.
My opinions and research are my own and do not constitute financial advice in any way whatsoever.
Nothing published by me constitutes an investment recommendation, nor should any data or Content published by me be relied upon for any investment/trading activities.
I strongly recommends that you perform your own independent research and/or speak with a qualified investment professional before making any financial decisions.
Any ideas to further improve this indicator are welcome :)

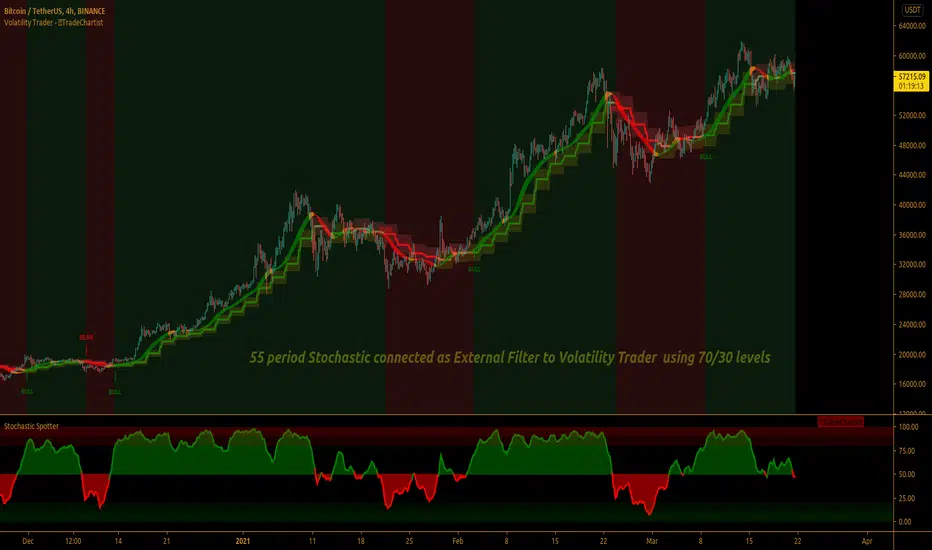
TradeChartist Volatility Trader ™TradeChartist Volatility Trader is a Price Volatility based Trend indicator that uses simple to visualize Volatility steps and a Volatility Ribbon to trade volatility breakouts and price action based on lookback length.
===================================================================================================================
Features of ™TradeChartist Volatility Trader
======================================
The Volatility steps consists of an Upper band, a Lower band and a Mean price line that are used for detecting the breakouts and also used in plotting the Volatility Ribbon based on the price action. The Mean Line is colour coded based on Bull/Bear Volatility and exhaustion based on Price action trend.
In addition to the system of Volatility Steps and Volatility Ribbon, ™TradeChartist Volatility Trader also plots Bull and Bear zones based on high probability volatility breakouts and divides the chart into Bull and Bear trade zones.
Use of External Filter is also possible by connecting an Oscillatory (like RSI, MACD, Stoch or any Oscillator) or a non-Oscillatory (Moving Average, Supertrend, any price scale based plots) Signal to confirm the Bull and Bear Trade zones. When the indicator detects the Volatility breakouts, it also checks if the connected external signal agrees with the trend before generating the Bull/Bear entries and plotting the trade zones.
Alerts can be created for Long and Short entries using Once per bar close .
===================================================================================================================
Note:
Higher the lookback length, higher the Risk/Reward from the trade zones.
This indicator does not repaint , but on the alert creation, a potential repaint warning would appear as the script uses security function. Users need not worry as this is normal on scripts that employs security functions. For trust and confidence using the indicator, users can do bar replay to check the plots/trade entries time stamps to make sure the plots and entries stay in the same place.
™TradeChartist Volatility Trader can be connected to ™TradeChartist Plug and Trade to generate Trade Entries, Targets etc by connecting Volatility Trader's Trend Identifier as Oscillatory Signal to Plug and Trade.
===================================================================================================================
Best Practice: Test with different settings first using Paper Trades before trading with real money
===================================================================================================================
This is not a free to use indicator. Get in touch with me (PM me directly if you would like trial access to test the indicator)
Premium Scripts - Trial access and Information
Trial access offered on all Premium scripts.
PM me directly to request trial access to the scripts or for more information.
===================================================================================================================
Candle Height in Percentage - ColumnsThis indicator calculates the difference in percentage between lows and highs of a candle. The orange bars show the height of the candle body (open/close) and the red/green on top show the percentage of the wicks (high/low). This assists in understanding the volatility of an asset. Showing this in percentages is more helpful in crypto. It also shows the Simple Moving Average of this data with the blue line.
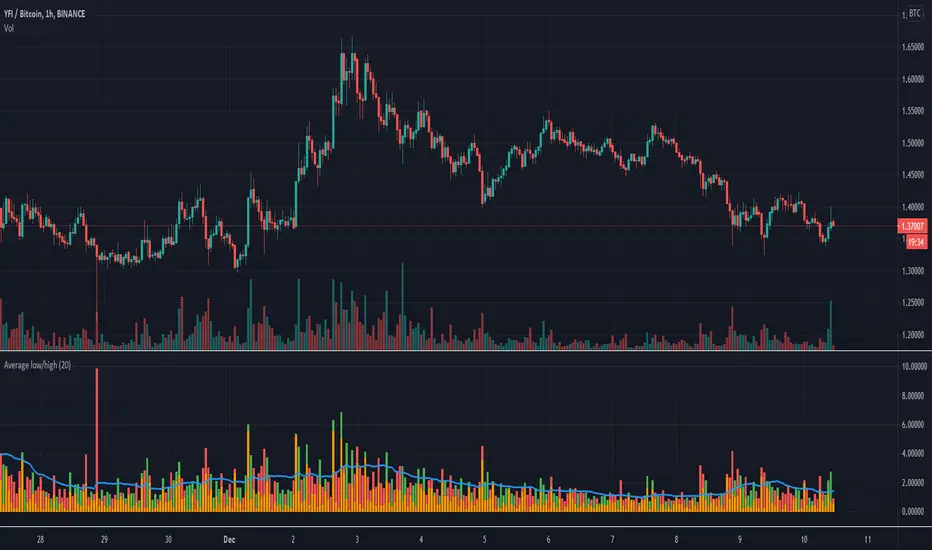
Average Low/High Percentage DifferenceThis indicator calculates the Simple Moving Average of the difference in percentage between lows and highs of a candle. This assists in understanding the volatility of an asset. Showing this in percentages is more helpful in crypto.

Predictive Period Risk RangeThis script produces a band range that uses a stochastic volatility process to come up with maximum and minimum price ranges over the specified period (using the length variable).
The sample used to predict volatility can be modified using the VolLength parameter, and the extremes can be modified using the VolInflator parameter.
For example, a VolLength of 30 uses the prior thirty days to predict volatility , but that volatility prediction is then adjusted to the period of Length and still only applied to that range
Please PM me for a free trial and for pricing

ADR% - Average Daily Range % by MikeC (AKA TheScrutiniser)This applies a 'corrected' formula to the version created by alpine_trader (which is slightly off). It calculates the Average Daily Range (in percent) over the previous 20 periods and plots it in a chart.
I am grateful to GlinckEastwoot for the 'corrected' formula.

Volatility Price TargetsPrints lines on the chart marking the price points for the standard deviation move using historical volatility. This script was born out of a need to easily spot target points for the wings of my Iron Condor Options trades. The study only shows on the Daily chart. Volatility is calculated based on the standard deviation of the daily returns of price. Price targets are calculated off yesterday's closing price and will not reprint.
Inputs
Days to Expiration - allow you to enter the number of days to expiration for the option, default is 30 for those monthly options traders but can be adjusted to your desire.
Standard Deviation - you can enter the number of deviations for which to calculate the price points 1,2, or 3.
Days in Year - you can adjust the number of days in the year used to calculate the daily volatility multiplier.

OnTheMoveWith this plot one is able to compare the different % change in the given time frame. It calculates the sma of a given period (defval = 7) for the close/open.
Strategy would be to choose (trade) from one to other asset in order to get higher rates when pumping or lower when dumping.
The Symbol & exchange has to be specified.
defSymbols = BTC, ETH and LINK
defExchange = BINANCE

GBTC Fomo Panic PremiumIt is rumored that GBTC price action leads the Bitcoin market. This indicator compares GBTC fomo/panic levels to the (Binance) BTC spot market. Fomo is measured as large percentage moves of the high price from the min over a look-back period. Panic is measured as large percentage moves of the low price from the max over a look-back period. A prime example of this indicator's usage would be as a sell signal confirmation during the 2020 pre-Thanksgiving panic exhibited on the 1-hour chart while the 20 EMA was still above the 99 SMA.
You can customize the leading and lagging markets and the length of the lookback period. I would love to hear what parameters, markets and timeframes work for you. Maybe there is a way to leave comments, or hit me up on Twitter: @thirdreplicator
May you profit and enjoy.

Volatility Prism [Nic]What is this
The volatility rainbow tracks divergences in a security and its volatility index. This can be used to identify periods of heightened implied (future) risk.
About Volatility
The volatility is calculated by looking at put / call ratios. When VIX goes up it means that puts are outpacing calls. This is a bearish signal.
About Correlation
When the security goes up while the VIX goes up, the divergence on the plot will increase and turn a color. This should be a warning.
Volatility Rainbow
This is a similar indicator, but this one merges all signals into a single line.
