KD-10-20 Cross No Chop ChopThis strategy avoids 80% of the choppy trades. Take entry when it gives a buy signal and put TP and SL as per your convenience. Happy Trading!
Medie mobili

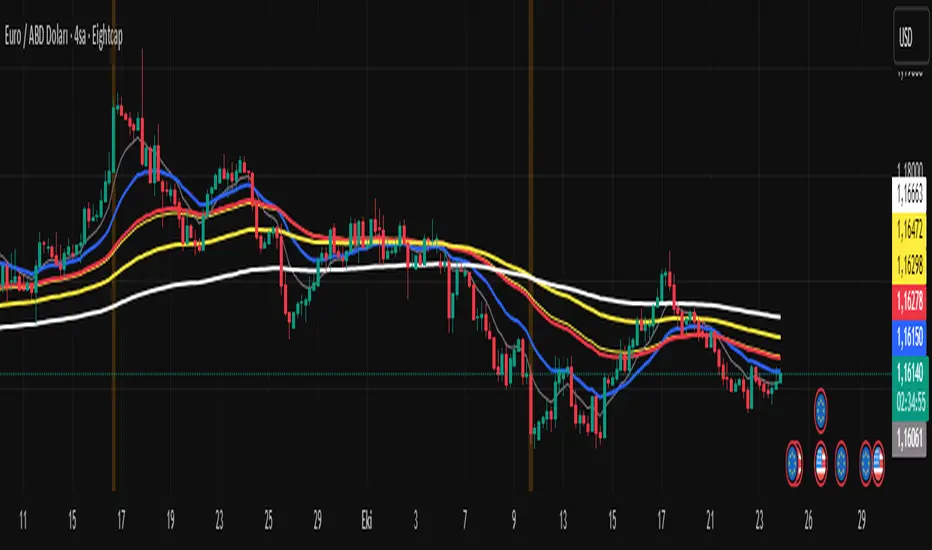
MarketMonkey-Indicator-Set-1 - GMMA open 🧠 MarketMonkey-Indicator-Set-1 — GMMA Open
GMMA (Guppy Multiple Moving Average) Toolkit for Trend Clarity & Timing
The MarketMonkey GMMA Open indicators brings a clean, high-performance visual of trend strength and direction using multiple exponential moving averages (EMAs) across short- and long-term time frames.
Designed for traders who want to see momentum shifts and market transitions as they happen, this version overlays directly on the price chart for quick and confident reads.
🔍 How It Works
* Short-term EMAs (3–15) track trader sentiment and momentum.
* Long-term EMAs (30–60) show investor trend commitment.
* The indicator dynamically colors the long-term EMAs:
* 🔵 Blue : Upward momentum
* 🔴 Red : Downward momentum
When the short-term group expands above the long-term group, it signals strength and potential continuation. Tightening or compression may warn of pauses or reversals.
💡 Features
* 12 adjustable EMA periods (customize your GMMA spacing)
* Automatic color shifts for trend clarity
* Live price flag for easy reference
* Compact ticker/date display in the top-right corner
* Minimalist, overlay-based design — no clutter, just clarity
📈 Best Used For
* Spotting early trend changes
* Confirming continuation or breakout setups
* Identifying compression zones before reversals
* Overlaying on ASX, S&P, FX, Gold, or Crypto charts
🔔 Part of the MarketMonkey Indicator Set series — tools built for real-world trend recognition and momentum trading.

Average True Range Stop Loss Finder with KAMAATR SL finder with bands
Kaufmann adaptive moving average
ATR SL finder with bands
Kaufmann adaptive moving average

ΔΔ Holy Grail Chart Logic - Δ1 //─────────────────────────────────────────────
// 📖 HOW TO READ ΔΔ-HG-Δ1
//─────────────────────────────────────────────
//
// • The white line (MA1) is “Present Breath.”
// It moves fastest and reveals the living rhythm of price.
//
// • The blue line (MA3) is “The Scout.”
// Together, white and blue form the breathing void—the heartbeat zone.
//
// The fill color between them (the “void”) tells you the tone of the market:
// 🔵 Blue = Calm alignment, balanced breath
// 🟠 Orange = BYTE phase – testing emotion
// 🟢 Green = Cross phase – spiral turning
// 🟤 Brown = Full Cross – ancestral confirmation
// ⚙️ Grey = Mimicry – legacy echo
// ❌ Red = Tilting – distortion or interference
//
// HUD (right side of chart) shows current phase and full sequence.
//
//─────────────────────────────────────────────
// 🌀 SEQUENCE LOGIC
//─────────────────────────────────────────────
// Touch → BYTE → Cross → Full → Mimicry
//
// Touch – White greets Blue; first awareness of shift.
// BYTE – Brief cross; emotional test of conviction.
// Cross – Intentional movement; spiral begins turning.
// Full – Deep alignment; momentum confirmed.
// Mimicry– Other MAs echo the white line; trend resonance.
//
// Each complete cycle is one “breath” of the market.
// Δ1 calibrates. Δ2 observes. Ahoeaaa ⚡
//
//─────────────────────────────────────────────

EMA Cloud + AlertsThe only EMA indicator you'll ever need.
- Flexible EMAs: Customize EMA lengths (e.g., 9, 21) to match your trading style.
- Dynamic Cloud: Auto-shades bullish (green) or bearish (red) clouds between EMAs for clear trend signals.
- Trend Change Alerts: Auto-alerts that signal when a trend change (EMA crossover) happens on the timeframe you're currently viewing.
- Timeframe Lock: Lock EMAs to a specific timeframe (e.g., 5m on a 1m chart) for consistent analysis.
- Personalized Design: Adjust EMA colors, thickness, and cloud transparency for optimal visibility.
A friendly reminder that no tool or indicator guarantees success. Integrate this into a robust trading plan.

Glork-SMA20D
50D
200D
200W
50W
Works on all time frames. Prints to the current candle
Colors are adjustable

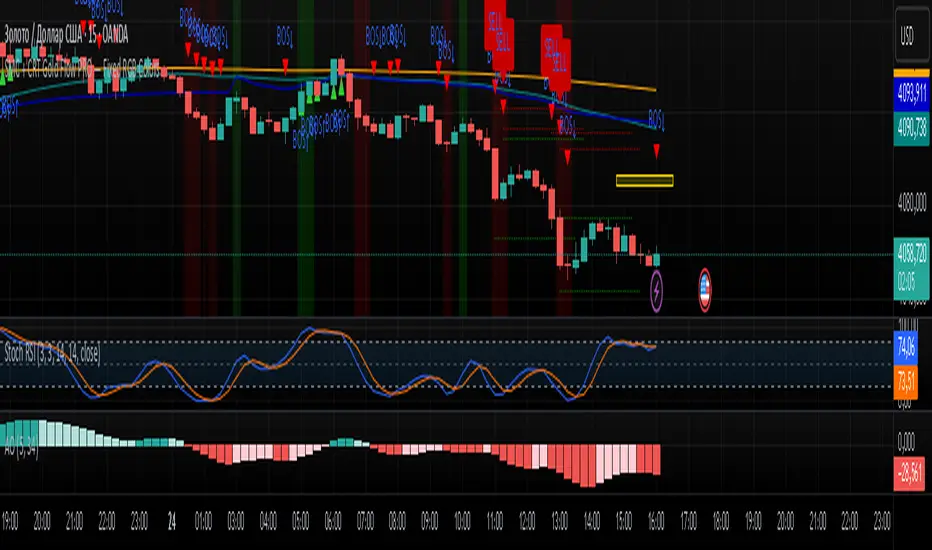
SMC + CRT Gold Flow PRO — Fixed RGB ColorsSCRIPT FOR GOLD. I used SMC + CRT strategies. I analyze in H4 timeframe and enter in m15 time frame.
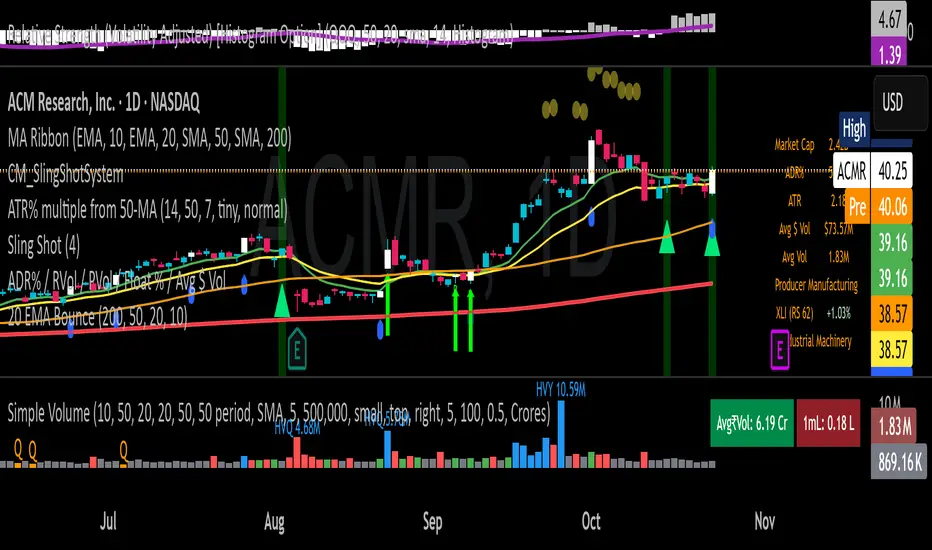
20 EMA Undercut Bounce - M4v3r1ck💎 The "EMA Undercut Bounce" Bullish Scanner
This indicator is designed to identify high-conviction continuation patterns where price makes a temporary dip for liquidity before resuming a powerful, established uptrend. It specifically looks for a bullish rejection off the 20-period Exponential Moving Average (EMA).
🎯 Strategy Logic
The signal is generated only on the Daily (1D) timeframe when the following five precise conditions are met on the most recent completed bar:
1. Price Action (The Undercut Bounce)
• Undercut: The bar's low price must have touched or temporarily traded below the 20-Day EMA.
• Rejection: The bar's close price must have fully recovered and closed above the 20-Day EMA. This is the classic sign of strong buying pressure defending a key support level.
2. Strong Trend Hierarchy (The Bullish Stack)
The moving averages must be perfectly stacked, confirming a robust multi-timeframe uptrend structure:
• 10-Day EMA > 20-Day EMA
• 20-Day EMA > 50-Day SMA
• 50-Day SMA > 200-Day SMA
3. Momentum Confirmation (The Upward Slope)
Both the 10-Day EMA and the 20-Day EMA must be rising from the previous day. This ensures that the short-term trend momentum is positive, ruling out signals during flat or turning markets.
💡 How to Use This Indicator
1. Timeframe: Ensure your chart is set to the Daily (1D) timeframe for accurate results.
2. Signal: A Green Background highlight and an Up-Arrow below the bar mark a confirmed signal.
3. Alerts: Use the built-in alert condition to set up notifications for stocks on your watchlist, allowing you to catch these high-quality setups without constantly monitoring charts.
This script is ideal for trend-following traders looking to enter a position after a healthy shakeout and confirmation of continued bullish commitment.
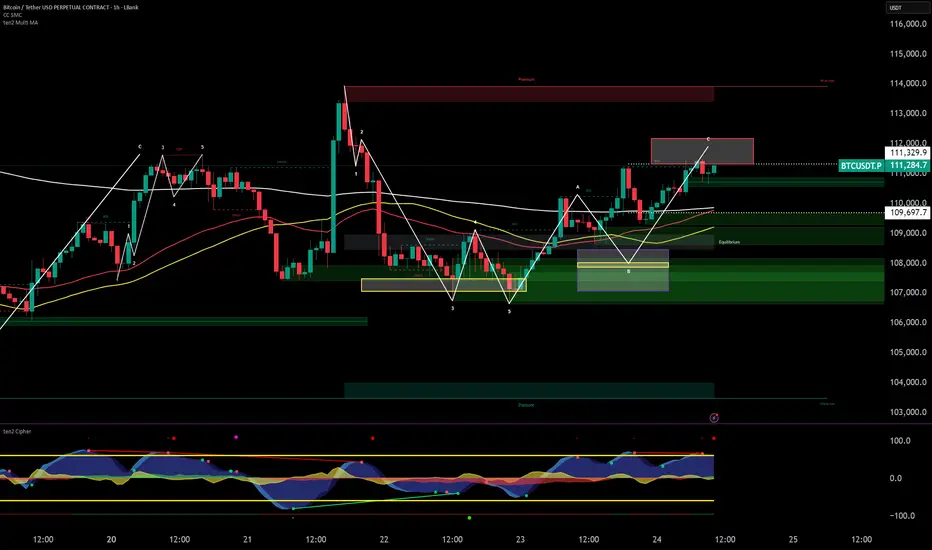
ten2 Multi MAThis powerful all-in-one indicator allows you to display three Exponential Moving Averages (EMAs) and three Simple Moving Averages (SMAs) on your chart from a single script. Save indicator slots and get a comprehensive view of market trends across different timeframes. Every moving average is fully customizable in length, colour, and source, giving you complete control over your technical analysis setup.
UTS CORE + BOS + CHOCH – RR/TP/SL 📊 Indicator Working Principle
### 🔹 1. BOS (Break of Structure)
* **Definition:** Occurs when the price breaks the previous swing high or swing low level.
* **Interpretation:**
* If the last high is broken upwards → **Bullish BOS** (confirmation of uptrend).
* If the last low is broken downwards → **Bearish BOS** (confirmation of downtrend).
---
### 🔹 2. CHOCH (Change of Character)
* **Definition:** Indicates a trend reversal.
* **Interpretation:**
* In an uptrend, if the last low is broken downwards → **CHOCH↓** (start of downtrend).
* In a downtrend, if the last high is broken upwards → **CHOCH↑** (start of uptrend).
* **Chart:** Blue “CHOCH↑” labels on the chart mark trend reversals.
---
### 🔹 3. FVG (Fair Value Gap)
* **Definition:** A price gap formed between 3 candles.
* **Logic:**
* If the low of one candle stays above the high of the candle two bars back, a gap is created.
* Price tends to return to these gaps to “fill” them.
* **Chart:** The indicator highlights these gaps automatically (green/purple lines).
---
### 🔹 4. Signal Generation (BUY / SELL)
* A valid BOS or CHOCH confirmation + presence of FVG → **signal is triggered.**
* **Rules:**
* Upward break → **BUY signal**
* Downward break → **SELL signal**
* **Chart:** Red “SELL” and green “BUY” labels represent these trade signals.
---
### 🔹 5. RR – TP/SL Management
* When a trade is opened, the indicator automatically calculates **Entry, Stop Loss (SL), and Take Profits (TP1, TP2, TP3).**
* **Risk/Reward ratios:**
* TP1 = 1R
* TP2 = 2R
* TP3 = 3R
* If TP1 is hit and “Breakeven” option is enabled → SL moves to entry (risk-free trade).
---
👉 In short: this indicator tracks **market structure (BOS/CHOCH)**, detects **imbalances (FVG)**, and combines them with **risk/reward management (TP/SL)** to give you a ready-made trade

30-Week SMA (Fixed)This indicator plots a true 30-week Simple Moving Average (SMA) on any chart, regardless of the selected timeframe.
It uses weekly candle data (via the request.security() function) to calculate the 30-week average and keeps it fixed — meaning the line remains accurate even when you switch to daily, 4-hour, or other timeframes.
The 30-week SMA is a cornerstone of Stan Weinstein’s Stage Analysis strategy, commonly used to identify major trend phases:
Above a rising SMA → bullish (Stage 2 uptrend)
Below a falling SMA → bearish (Stage 4 downtrend)
Use this indicator to maintain a consistent long-term trend filter on all timeframes

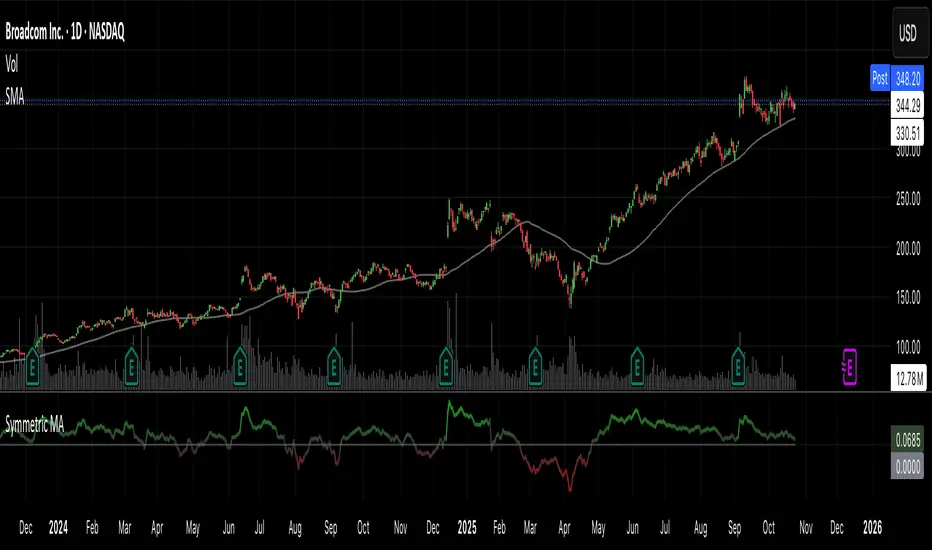
Symmetric MA DeviationThis script used the 50 simple moving average and calculates how far the price is from it.
It can be used for looking at extremes in price and bullish / bearish divergence.
[LTS] Marubozu Candle StrategyOVERVIEW
The Marubozu Candle Strategy identifies and trades wickless candles (Marubozu patterns) with dynamic take-profit and stop-loss levels based on market volatility. This indicator combines traditional Japanese candlestick pattern recognition with modern volatility-adjusted risk management and includes a comprehensive performance tracking dashboard.
A Marubozu candle is a powerful continuation pattern characterized by the complete absence of wicks on one side, indicating strong directional momentum. This strategy specifically detects:
- Bullish Marubozu: Close > Open AND Low = Open (no lower wick)
- Bearish Marubozu: Close < Open AND High = Open (no upper wick)
When price returns to test these levels, the indicator generates trading signals with predefined risk-reward parameters.
CORE METHODOLOGY
Detection Logic:
The script scans each bar for Marubozu formations using precise price comparisons. When a wickless candle appears, a horizontal line extends from the opening price, marking it as a potential support (bullish) or resistance (bearish) level. These levels remain active until price touches them or until the maximum line limit is reached.
EMA Filter (Optional):
An exponential moving average filter enhances signal quality by requiring proper trend alignment. For bullish signals, price must be above the EMA when touching the level. For bearish signals, price must be below the EMA. This filter reduces counter-trend trades and improves win rates in trending markets. Users can disable this filter for range-bound conditions.
Dynamic Risk Management:
The strategy employs ATR-based (Average True Range) position sizing rather than fixed point values. This approach adapts to market volatility automatically:
- In low volatility: Tighter stops and targets
- In high volatility: Wider stops and targets proportional to market movement
Default settings use a 2:1 reward-to-risk ratio (1x ATR for take-profit, 0.5x ATR for stop-loss), but users can adjust these multipliers to match their trading style.
HOW IT WORKS
Step 1 - Pattern Detection:
On each bar, the indicator evaluates whether the candle qualifies as a Marubozu by comparing the high, low, open, and close prices. When detected, the opening price becomes the key level.
Step 2 - Level Management:
Horizontal lines extend from each Marubozu's opening price. The indicator maintains two separate arrays: one for unbroken levels (actively extending) and one for broken levels (historical reference). Users can configure how many of each type to display, preventing chart clutter while maintaining relevant context.
Step 3 - Signal Generation:
When price returns to touch a Marubozu level, the indicator evaluates the EMA filter condition. If the filter passes (or is disabled), the script draws TP/SL boxes showing the expected profit and loss zones based on current ATR values.
Step 4 - Trade Tracking:
Each valid signal enters the tracking system, which monitors subsequent price action to determine outcomes. The script identifies whether the take-profit or stop-loss was hit first (discarding trades where both trigger on the same candle to avoid ambiguous results).
PERFORMANCE DASHBOARD
The integrated dashboard provides real-time strategy analytics to automatically convert results to dollar values for any instrument:
Tracked Metrics:
- Total Trades: Complete count of closed positions
- Wins/Losses: Individual counts with color coding
- Win Rate: Success percentage with dynamic color (green >= 50%, red < 50%)
- Total P&L: Cumulative profit/loss in dollars
- Avg Win: Mean dollar amount per winning trade
- Avg Loss: Mean dollar amount per losing trade
NOTE: The dollar values shown in the dashboard are for trading only a single share/contract/etc. You will need to manually multiply those numbers by the amount of shares/contracts you are trading to get a true value.
The dollar conversion works automatically across all markets:
- Futures contracts (ES, NQ, CL, etc.) use their contract specifications
- Forex pairs use standard lot calculations
- Stocks and crypto use their respective point values
This eliminates manual calculation and provides immediate performance feedback in meaningful currency terms.
CUSTOMIZATION OPTIONS
ATR Settings:
- ATR Period: Lookback length for volatility calculation (default: 14)
- TP Multiplier: Take-profit distance as multiple of ATR (default: 3.0)
- SL Multiplier: Stop-loss distance as multiple of ATR (default: 1.5)
EMA Settings:
- EMA Length: Period for trend filter calculation (default: 9)
- Use EMA Filter: Toggle trend confirmation requirement (default: enabled)
Visual Settings:
- Bullish Color: Color for long signals and wins (default: green)
- Bearish Color: Color for short signals and losses (default: red)
- EMA Color: Color for trend filter line (default: orange)
- Line Width: Thickness of Marubozu level lines (1-5, default: 2)
- EMA Width: Thickness of EMA line (1-5, default: 2)
Line Management:
- Max Unbroken Lines: Limit for active extending lines (default: 10)
- Max Broken Lines: Limit for historical touched lines (default: 5)
Dashboard Settings:
- Show Dashboard: Toggle performance display on/off
- Dashboard Position: Corner placement (4 options)
- Dashboard Size: Text size selection (Tiny/Small/Normal/Large)
HOW TO USE
1. Add the indicator to your chart
2. Adjust ATR multipliers based on your risk tolerance (higher values = more conservative)
3. Configure the EMA filter based on market conditions (enable for trending, disable for ranging)
4. Set line limits to match your visual preference and chart timeframe
5. Monitor the dashboard to track strategy performance in real-time
6. Use the TP/SL boxes as reference levels for manual trades or automation
Best Practices:
- Enable EMA filter in strongly trending markets
- Disable EMA filter if you want more trade signals but at lower quality
- Increase ATR multipliers in highly volatile markets
- Decrease ATR multipliers for tighter, more frequent trades
- Review avg win/loss ratio to ensure positive expectancy
UNIQUE FEATURES
Unlike basic Marubozu detectors, this strategy provides:
1. Automatic level tracking with memory management
2. Volatility-adjusted risk parameters instead of fixed values
3. Optional trend confirmation via EMA filter
4. Real-time performance analytics with automatic dollar conversion
5. Separate tracking of wins/losses with individual averages
6. Configurable visual display to prevent chart clutter
7. Complete transparency with all logic visible in open-source code

Distance % from sma/ema + Percentile BandsThis script is breadth indicator for long term bull and bear markets.
Default settings:
AU:
- 200m SMA
- Percentile Lookback: 99%
- Lookback Period: 240 M
AG: TBD
SPX: TBD

Fiyat - 55 EMA Uzaklık SinyaliThis indicator generates a signal when the price moves a certain percentage away from the 55-period Exponential Moving Average (EMA).
It helps traders identify when the market is stretched too far from its mean level, which can indicate potential reversal or continuation zones.
⚙️ How It Works
Calculates the 55 EMA on the selected chart.
Measures the percentage distance between the current price and the 55 EMA.
When the price distance exceeds the user-defined threshold (default: 0.50%), a visual signal (orange triangle) appears on the chart.
The background also highlights the signal candle.
🧩 Inputs
EMA Length: Default = 55 (can be changed).
Distance Threshold (%): Default = 0.50 → Change to detect stronger or weaker price deviations.
Bobs Gold and Red LinesThis indicator plots a normal 9 EMA corresponding to the current time frame, ie Bob's 1 min 9 ema Gold Line.
It also plots a 5 min 21 SMA (Bob's Red Line) on the 1 min chart. It actually plots the 5 min redline on timeframes other than the 1 min chart as well.
In other words, this will plot the actual 5 min 21 SMA whether you are on the 1 min, 5 min, or other time frames. I created this instead of having to use the workaround of a 105 SMA on the 1 min chart or having a separate 5 min chart open when trading Bob's 1 min strategies.
On the 1 min chart you will notice the red line typically makes a stairstep effect, that is because it is a 5 min SMA being plotted on the 1 min chart. The right hand end point should still perfectly match the current 5 min SMA price. I have been testing / using this script for several months.
I have noticed that the ema and sma on my tradovate charts do not perfectly match my tradingview charts, even just using the normal tradingview moving averages, however from what I can see on Bob's charts Tradingview seems to be close to the same as on Bob's Ninja charts. I have not started using Ninja yet, but plan to soon then I can compare apples to apples.
I made a few changes in names, etc before I published this script today, so hopefully I didn't inadvertently break anything. So let me know if you find anything off or not working as expected.

Trend Alignment TableThe Trend Alignment Table is a clean, visual tool designed to quickly assess trend direction and alignment across multiple moving averages — without cluttering your chart.
Instead of plotting moving average lines, this indicator displays a compact on-chart table showing each selected MA and its corresponding trend status using color-coded circles.
🧩 How It Works
Each circle represents the relationship between price and its corresponding moving average (MA):
Price vs. MA MA Direction Circle Color Meaning
Above Rising 🟢 Green Bullish continuation
Above Falling 🟡 Yellow Weakening bullishness
Below Falling 🔴 Red Bearish continuation
Below Rising 🟡 Yellow Weakening bearishness
⚙️ Features
Up to 4 customizable moving averages
Type: SMA, EMA, SMMA (RMA), WMA, VWMA
Source: Any price source (close, open, etc.)
Length: Fully adjustable
Dynamic color-coded circles (green, yellow, red by default — fully customizable)
User-selectable table position (top-left, top-right, bottom-left, bottom-right)
Clean visual layout for quick multi-timeframe trend confirmation
📊 Use Cases
Instantly identify trend alignment across short-, medium-, and long-term averages
Confirm trend strength or weakening momentum
Combine with other indicators or strategies for confirmation signals
🧠 Default Settings
MA Type Length Color
MA #1 SMA 5 Green
MA #2 SMA 20 Gold
MA #3 SMA 50 Orange
MA #4 SMA 150 Red
🧰 Created for traders who value clarity.
Whether you trade trends, reversals, or momentum shifts, the Trend Alignment Table gives you a concise, at-a-glance view of the market’s directional structure.

Moving Averages: 09-21-55-200 - Multiple Times Frames v2This is a multi-timeframe 9ema, 21ema, 55ema and the 200 SMA for the 1 minute, 2minute, 5 minute and 15 minute timeframes. SO when you are on any of these time-frames it will show the EMAs and SMAs for the other levels.

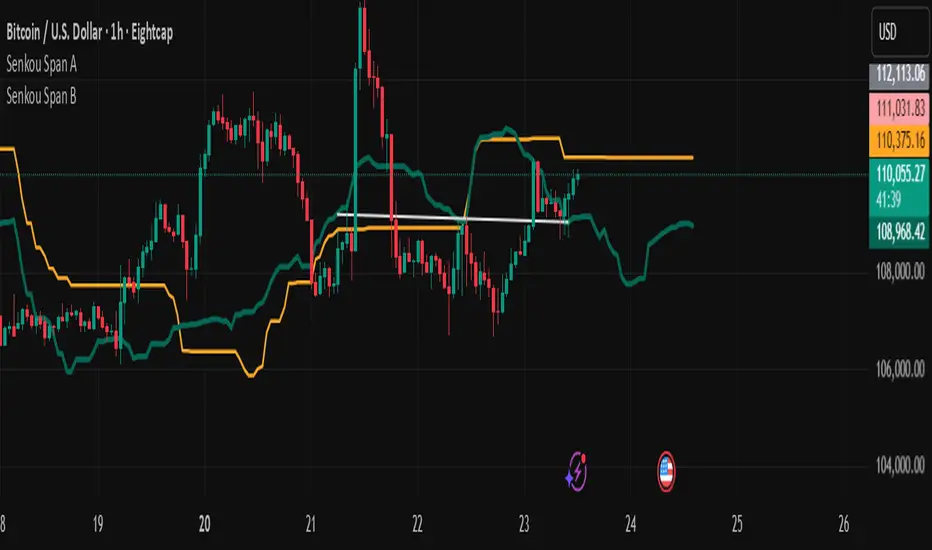
Senkou Span AUse it in conjunction with Senkou Span B to create effective kumo alert signals when kumo changes direction: bullish or bearish.
Traffic Light MA — Trend IndicatorThis script displays a simple “traffic light” circle that reflects the market trend based on two moving averages (MA).
-Green: Price > Fast MA > Slow MA → Uptrend confirmation
-Yellow: Mixed conditions (transition zone)
-Red: Slow MA > Fast MA > Price → Downtrend confirmation
You can customize:
-MA type (SMA or EMA)
-Lengths of both MAs
-Timeframe used for evaluation (e.g. Daily, 4H, Weekly)
This tool is designed for traders who prefer a minimalistic chart, showing only a clean color signal instead of multiple lines.
Recommendation:
For small MAs (8,15,21) use EMA, for big MAs (50,100,200) use SMA

Multi-Timeframe EMA Trend Dashboard with Volume and RSI Filters═══════════════════════════════════════════════════════════
MULTI-TIMEFRAME EMA TREND DASHBOARD
═══════════════════════════════════════════════════════════
OVERVIEW
This indicator provides a comprehensive view of trend direction across multiple timeframes using the classic EMA 20/50 crossover methodology, enhanced with volume confirmation and RSI filtering. It aggregates trend information from six timeframes into a single dashboard for efficient market analysis.
The indicator is designed for educational purposes and to assist traders in identifying potential trend alignments across different time horizons.
═══════════════════════════════════════════════════════════
FEATURES
═══════════════════════════════════════════════════════════
MULTI-TIMEFRAME ANALYSIS
• Monitors 6 timeframes simultaneously: 1m, 5m, 15m, 1H, 4H, 1D
• Each timeframe analyzed independently using request.security()
• Non-repainting implementation with proper lookahead settings
• Calculates overall trend strength as percentage of bullish timeframes
EMA CROSSOVER SYSTEM
• Fast EMA (default: 20) and Slow EMA (default: 50)
• Bullish: Fast EMA > Slow EMA
• Bearish: Fast EMA < Slow EMA
• Neutral: Fast EMA = Slow EMA (rare condition)
• Visual EMA plots with optional fill area
VOLUME CONFIRMATION
• Optional volume filter for crossover signals
• Compares current volume against moving average (default: 20-period SMA)
• Categorizes volume as: High (>1.5x average), Normal (>average), Low (70), oversold (<30), and neutral zones
• Used in quality score calculation
• Optional display toggle
SUPPORT & RESISTANCE DETECTION
• Automatic detection using highest/lowest over lookback period (default: 50 bars)
• Plots resistance (red), support (green), and mid-level (gray)
• Step-line style for clear visualization
• Optional display toggle
QUALITY SCORING SYSTEM
• Rates trade setups from 1-5 stars
• Considers: MTF alignment, volume confirmation, RSI positioning
• 5 stars: 4+ timeframes aligned + volume confirmed + RSI 50-70
• 4 stars: 4+ timeframes aligned + volume confirmed
• 3 stars: 3+ timeframes aligned
• 2 stars: Exactly 3 timeframes aligned
• 1 star: Other conditions
VISUAL DASHBOARD
• Clean table display (position customizable)
• Color-coded trend indicators (green/red/yellow)
• Extended statistics panel (toggleable)
• Shows: Trends, Strength, Quality, RSI, Volume, Price Distance
═══════════════════════════════════════════════════════════
TECHNICAL SPECIFICATIONS
═══════════════════════════════════════════════════════════
CALCULATIONS
Trend Determination per Timeframe:
• request.security() fetches EMA values with gaps=off, lookahead=off
• Compares Fast EMA vs Slow EMA
• Returns: 1 (bullish), -1 (bearish), 0 (neutral)
Trend Strength:
• Counts number of bullish timeframes
• Formula: (bullish_count / 6) × 100
• Range: 0% (all bearish) to 100% (all bullish)
Price Distance from EMA:
• Formula: ((close - EMA) / EMA) × 100
• Positive: Price above EMA
• Negative: Price below EMA
• Warning when absolute distance > 5%
ANTI-REPAINTING MEASURES
• All request.security() calls use lookahead=barmerge.lookahead_off
• Dashboard updates only on barstate.islast
• Historical bars remain unchanged
• Crossover signals finalize on bar close
═══════════════════════════════════════════════════════════
USAGE GUIDE
═══════════════════════════════════════════════════════════
INTERPRETING THE DASHBOARD
Timeframe Rows:
• Each row shows individual timeframe trend status
• Look for alignment (multiple timeframes same direction)
• Higher timeframes generally more significant
Strength Indicator:
• >66.67%: Strong bullish (4+ timeframes bullish)
• 33.33-66.67%: Mixed/choppy conditions
• <33.33%: Strong bearish (4+ timeframes bearish)
Quality Score:
• Higher stars = better confluence of factors
• 5-star setups have strongest multi-factor confirmation
• Lower scores may indicate weaker or conflicting signals
SUGGESTED APPLICATIONS
Trend Confirmation:
• Check if multiple timeframes confirm current chart trend
• Higher agreement = stronger trend confidence
• Use for position sizing decisions
Entry Timing:
• Wait for EMA crossover on chart timeframe
• Confirm with higher timeframe alignment
• Volume above average preferred
• RSI not in extreme zones
Divergence Detection:
• When lower timeframes diverge from higher
• May indicate trend exhaustion or reversal
• Requires additional confirmation
CUSTOMIZATION
EMA Settings:
• Adjust Fast/Slow lengths for different sensitivities
• Shorter periods = more responsive, more signals
• Longer periods = smoother, fewer signals
• Common alternatives: 10/30, 12/26, 50/200
Volume Filter:
• Enable for higher-quality signals (fewer false positives)
• Disable in always-liquid markets or for more signals
• Adjust MA length based on typical volume patterns
Display Options:
• Toggle EMAs, S/R levels, extended stats as needed
• Choose dashboard position to avoid chart overlap
• Adjust colors for visibility preferences
═══════════════════════════════════════════════════════════
ALERTS
═══════════════════════════════════════════════════════════
AVAILABLE ALERT CONDITIONS
1. Bullish EMA Cross (Volume Confirmed)
2. Bearish EMA Cross (Volume Confirmed)
3. Strong Bullish Alignment (4+ timeframes)
4. Strong Bearish Alignment (4+ timeframes)
5. Trend Strength Increasing (>16.67% jump)
6. Trend Strength Decreasing (>16.67% drop)
7. Excellent Trade Setup (5-star rating)
Alert messages use standard placeholders:
• {{ticker}} - Symbol name
• {{close}} - Current close price
• {{time}} - Bar timestamp
═══════════════════════════════════════════════════════════
LIMITATIONS & CONSIDERATIONS
═══════════════════════════════════════════════════════════
KNOWN LIMITATIONS
• Lower timeframe data may not be available on all symbols
• 1-minute data typically limited to recent history
• request.security() subject to TradingView data limits
• Dashboard requires screen space (may overlap on small screens)
• More complex calculations may affect load time on slower devices
NOT SUITABLE FOR
• Highly volatile/illiquid instruments (many false signals)
• News-driven markets during announcements
• Automated trading without additional filters
• Markets where EMA strategies don't perform well
DOES NOT PROVIDE
• Exact entry/exit prices
• Stop-loss or take-profit levels
• Position sizing recommendations
• Guaranteed profit signals
• Market predictions
═══════════════════════════════════════════════════════════
BEST PRACTICES
═══════════════════════════════════════════════════════════
RECOMMENDED USAGE
✓ Combine with price action analysis
✓ Use appropriate risk management
✓ Backtest on historical data before live use
✓ Adjust settings for specific market characteristics
✓ Wait for higher-quality setups in important trades
✓ Consider overall market context and fundamentals
NOT RECOMMENDED
✗ Using as standalone trading system without confirmation
✗ Trading every signal without discretion
✗ Ignoring risk management principles
✗ Trading without understanding the methodology
✗ Applying to unsuitable markets/timeframes
═══════════════════════════════════════════════════════════
EDUCATIONAL BACKGROUND
═══════════════════════════════════════════════════════════
EMA CROSSOVER STRATEGY
The Exponential Moving Average crossover is a classical trend-following technique:
• Golden Cross: Fast EMA crosses above Slow EMA (bullish signal)
• Death Cross: Fast EMA crosses below Slow EMA (bearish signal)
• Widely used since the 1970s in various markets
• More responsive than SMA due to exponential weighting
MULTI-TIMEFRAME ANALYSIS
Analyzing multiple timeframes helps traders:
• Identify alignment between short and long-term trends
• Reduce false signals from single-timeframe noise
• Understand market context across different horizons
• Make informed decisions about trade duration
VOLUME ANALYSIS
Volume confirmation adds reliability:
• High volume suggests institutional participation
• Low volume signals may indicate false breakouts
• Volume precedes price in many market theories
• Helps distinguish genuine moves from noise
═══════════════════════════════════════════════════════════
TECHNICAL IMPLEMENTATION
═══════════════════════════════════════════════════════════
CODE STRUCTURE
• Organized in clear sections with proper commenting
• Uses explicit type declarations (int, float, bool, color, string)
• Constants defined at top (BULLISH=1, BEARISH=-1, etc.)
• Functions documented with @function, @param, @returns
• Follows PineCoders naming conventions (camelCase variables)
PERFORMANCE OPTIMIZATION
• var keyword for table (created once, not every bar)
• Calculations cached where possible
• Dashboard updates only on last bar
• Minimal redundant security() calls
SECURITY IMPLEMENTATION
• Proper gaps and lookahead parameters
• No future data leakage
• Signals finalize on bar close
• Historical bars remain static
═══════════════════════════════════════════════════════════
VERSION INFORMATION
═══════════════════════════════════════════════════════════
Current Version: 2.0
Pine Script Version: 5
Last Updated: 2024
Developed by: Zakaria Safri
═══════════════════════════════════════════════════════════
SETTINGS REFERENCE
═══════════════════════════════════════════════════════════
EMA SETTINGS
• Fast EMA Length: 1-500 (default: 20)
• Slow EMA Length: 1-500 (default: 50)
VOLUME & MOMENTUM
• Use Volume Confirmation: true/false (default: true)
• Volume MA Length: 1-500 (default: 20)
• Show RSI Levels: true/false (default: true)
• RSI Length: 1-500 (default: 14)
PRICE ACTION FEATURES
• Show Price Distance: true/false (default: true)
• Show Key Levels: true/false (default: true)
• S/R Lookback Period: 10-500 (default: 50)
DISPLAY SETTINGS
• Show EMAs on Chart: true/false (default: true)
• Fast EMA Color: customizable (default: cyan)
• Slow EMA Color: customizable (default: orange)
• EMA Line Width: 1-5 (default: 2)
• Show Fill Between EMAs: true/false (default: true)
• Show Crossover Signals: true/false (default: true)
DASHBOARD SETTINGS
• Position: Top Left/Right, Bottom Left/Right
• Show Extended Statistics: true/false (default: true)
ALERT SETTINGS
• Alert on Multi-TF Alignment: true/false (default: true)
• Alert on Trend Strength Change: true/false (default: true)
═══════════════════════════════════════════════════════════
RISK DISCLAIMER
═══════════════════════════════════════════════════════════
This indicator is provided for educational and informational purposes only. It should not be considered financial advice or a recommendation to buy or sell any security.
IMPORTANT NOTICES:
• Past performance does not indicate future results
• All trading involves risk of capital loss
• No indicator guarantees profitable trades
• Always conduct independent research and analysis
• Use proper risk management and position sizing
• Consult a qualified financial advisor before trading
• The developer assumes no liability for trading losses
By using this indicator, you acknowledge that you understand these risks and accept full responsibility for your trading decisions.
═══════════════════════════════════════════════════════════
SUPPORT & CONTRIBUTIONS
═══════════════════════════════════════════════════════════
FEEDBACK WELCOME
• Constructive comments appreciated
• Bug reports help improve the indicator
• Feature suggestions considered for future versions
• Share your experience to help other users
OPEN SOURCE
This code is published as open source for the TradingView community to:
• Learn from the implementation
• Modify for personal use
• Understand multi-timeframe analysis techniques
If you find this indicator useful, please consider:
• Leaving a thoughtful review
• Sharing with other traders who might benefit
• Following for future updates and releases
═══════════════════════════════════════════════════════════
ADDITIONAL RESOURCES
═══════════════════════════════════════════════════════════
RECOMMENDED READING
• TradingView Pine Script documentation
• PineCoders community resources
• Technical analysis textbooks on moving averages
• Multi-timeframe trading strategy guides
• Risk management principles
RELATED CONCEPTS
• Trend following strategies
• Moving average convergence/divergence
• Multiple timeframe analysis
• Volume-price relationships
• Momentum indicators
═══════════════════════════════════════════════════════════
Thank you for using this indicator. Trade responsibly and continue learning!
═══════════════════════════════════════════════════════════

IIR One-Pole Price Filter [BackQuant]IIR One-Pole Price Filter
A lightweight, mathematically grounded smoothing filter derived from signal processing theory, designed to denoise price data while maintaining minimal lag. It provides a refined alternative to the classic Exponential Moving Average (EMA) by directly controlling the filter’s responsiveness through three interchangeable alpha modes: EMA-Length , Half-Life , and Cutoff-Period .
Concept overview
An IIR (Infinite Impulse Response) filter is a type of recursive filter that blends current and past input values to produce a smooth, continuous output. The "one-pole" version is its simplest form, consisting of a single recursive feedback loop that exponentially decays older price information. This makes it both memory-efficient and responsive , ideal for traders seeking a precise balance between noise reduction and reaction speed.
Unlike standard moving averages, the IIR filter can be tuned in physically meaningful terms (such as half-life or cutoff frequency) rather than just arbitrary periods. This allows the trader to think about responsiveness in the same way an engineer or physicist would interpret signal smoothing.
Why use it
Filters out market noise without introducing heavy lag like higher-order smoothers.
Adapts to various trading speeds and time horizons by changing how alpha (responsiveness) is parameterized.
Provides consistent and mathematically interpretable control of smoothing, suitable for both discretionary and algorithmic systems.
Can serve as the core component in adaptive strategies, volatility normalization, or trend extraction pipelines.
Alpha Modes Explained
EMA-Length : Classic exponential decay with alpha = 2 / (L + 1). Equivalent to a standard EMA but exposed directly for fine control.
Half-Life : Defines the number of bars it takes for the influence of a price input to decay by half. More intuitive for time-domain analysis.
Cutoff-Period : Inspired by analog filter theory, defines the cutoff frequency (in bars) beyond which price oscillations are heavily attenuated. Lower periods = faster response.
Formula in plain terms
Each bar updates as:
yₜ = yₜ₋₁ + alpha × (priceₜ − yₜ₋₁)
Where alpha is the smoothing coefficient derived from your chosen mode.
Smaller alpha → smoother but slower response.
Larger alpha → faster but noisier response.
Practical application
Trend detection : When the filter line rises, momentum is positive; when it falls, momentum is negative.
Signal timing : Use the crossover of the filter vs its previous value (or price) as an entry/exit condition.
Noise suppression : Apply on volatile assets or lower timeframes to remove flicker from raw price data.
Foundation for advanced filters : The one-pole IIR serves as a building block for multi-pole cascades, adaptive smoothers, and spectral filters.
Customization options
Alpha Scale : Multiplies the final alpha to fine-tune aggressiveness without changing the mode’s core math.
Color Painting : Candles can be painted green/red by trend direction for visual clarity.
Line Width & Transparency : Adjust the visual intensity to integrate cleanly with your charting style.
Interpretation tips
A smooth yet reactive line implies optimal tuning — minimal delay with reduced false flips.
A sluggish line suggests alpha is too small (increase responsiveness).
A noisy, twitchy line means alpha is too large (increase smoothing).
Half-life tuning often feels more natural for aligning filter speed with price cycles or bar duration.
Summary
The IIR One-Pole Price Filter is a signal smoother that merges simplicity with mathematical rigor. Whether you’re filtering for entry signals, generating trend overlays, or constructing larger multi-stage systems, this filter delivers stability, clarity, and precision control over noise versus lag, an essential tool for any quantitative or systematic trading approach.

MESA Adaptive Ehlers Flow | AlphaNattMESA Adaptive Ehlers Flow | AlphaNatt
An advanced adaptive indicator based on John Ehlers' MESA (Maximum Entropy Spectrum Analysis) algorithm that automatically adjusts to market cycles in real-time, providing superior trend identification with minimal lag across all market conditions.
🎯 What Makes This Indicator Revolutionary?
Unlike traditional moving averages with fixed parameters, this indicator uses Hilbert Transform mathematics to detect the dominant market cycle and adapts its responsiveness accordingly:
Automatically detects market cycles using advanced signal processing
MAMA (MESA Adaptive Moving Average) adapts from fast to slow based on cycle phase
FAMA (Following Adaptive Moving Average) provides confirmation signals
Dynamic volatility bands that expand and contract with cycle detection
Zero manual optimization required - the indicator tunes itself
📊 Core Components
1. MESA Adaptive Moving Average (MAMA)
The MAMA is the crown jewel of adaptive indicators. It uses the Hilbert Transform to measure the market's dominant cycle and adjusts its smoothing factor in real-time:
During trending phases: Responds quickly to capture moves
During choppy phases: Smooths heavily to filter noise
Transition is automatic and seamless based on price action
Parameters:
Fast Limit: Maximum responsiveness (default: 0.5) - how fast the indicator can adapt
Slow Limit: Minimum responsiveness (default: 0.05) - maximum smoothing during consolidation
2. Following Adaptive Moving Average (FAMA)
The FAMA is a slower version of MAMA that follows the primary signal. The relationship between MAMA and FAMA provides powerful trend confirmation:
MAMA > FAMA: Bullish trend in progress
MAMA < FAMA: Bearish trend in progress
Crossovers signal potential trend changes
3. Hilbert Transform Cycle Detection
The indicator employs sophisticated DSP (Digital Signal Processing) techniques:
Detects the dominant cycle period (1.5 to 50 bars)
Measures phase relationships in the price data
Calculates adaptive alpha values based on cycle dynamics
Continuously updates as market character changes
⚡ Key Features
Adaptive Alpha Calculation
The indicator's "intelligence" comes from its adaptive alpha:
Alpha dynamically adjusts between Fast Limit and Slow Limit based on the rate of phase change in the market cycle. Rapid phase changes trigger faster adaptation, while stable cycles maintain smoother response.
Dynamic Volatility Bands
Unlike static bands, these adapt to both ATR volatility AND the current cycle state:
Bands widen when the indicator detects fast adaptation (trending)
Bands narrow during slow adaptation (consolidation)
Band Multiplier controls overall width (default: 1.5)
Provides context-aware support and resistance
Intelligent Color Coding
Cyan: Bullish regime (MAMA > FAMA and price > MAMA)
Magenta: Bearish regime (MAMA < FAMA and price < MAMA)
Gray: Neutral/transitional state
📈 Trading Strategies
Trend Following Strategy
The MESA indicator excels at identifying and riding strong trends while automatically reducing sensitivity during choppy periods.
Entry Signals:
Long: MAMA crosses above FAMA with price closing above MAMA
Short: MAMA crosses below FAMA with price closing below MAMA
Exit/Management:
Exit longs when MAMA crosses below FAMA
Exit shorts when MAMA crosses above FAMA
Use dynamic bands as trailing stop references
Mean Reversion Strategy
When price extends beyond the dynamic bands during established trends, look for bounces back toward the MAMA line.
Setup Conditions:
Strong trend confirmed by MAMA/FAMA alignment
Price touches or exceeds outer band
Enter on first sign of reversal toward MAMA
Target: Return to MAMA line or opposite band
Cycle-Based Swing Trading
The indicator's cycle detection makes it ideal for swing trading:
Enter on MAMA/FAMA crossovers
Hold through the detected cycle period
Exit on counter-crossover or band extremes
Works exceptionally well on 4H to Daily timeframes
🔬 Technical Background
The Hilbert Transform
The Hilbert Transform is a mathematical operation used in signal processing to extract instantaneous phase and frequency information from a signal. In trading applications:
Separates trend from cycle components
Identifies the dominant market cycle without curve-fitting
Provides leading indicators of trend changes
MESA Algorithm Components
Smoothing: 4-bar weighted moving average for noise reduction
Detrending: Removes linear price trend to isolate cycles
InPhase & Quadrature: Orthogonal components for phase measurement
Homodyne Discriminator: Calculates instantaneous period
Adaptive Alpha: Converts period to smoothing factor
MAMA/FAMA: Final adaptive moving averages
⚙️ Optimization Guide
Fast Limit (0.1 - 0.9)
Higher values (0.5-0.9): More responsive, better for volatile markets and lower timeframes
Lower values (0.1-0.3): Smoother response, better for stable markets and higher timeframes
Default 0.5: Balanced for most applications
Slow Limit (0.01 - 0.1)
Higher values (0.05-0.1): Less smoothing during consolidation, more signals
Lower values (0.01-0.03): Heavy smoothing during chop, fewer but cleaner signals
Default 0.05: Good noise filtering while maintaining responsiveness
Band Multiplier (0.5 - 3.0)
Adjust based on instrument volatility
Backtest to find optimal value for your specific market
1.5 works well for most forex and equity indices
Consider higher values (2.0-2.5) for cryptocurrencies
🎨 Visual Interpretation
The gradient visualization shows probability zones around the MESA line:
MESA line: The adaptive trend center
Band expansion: Indicates strong cycle detection and trending
Band contraction: Indicates consolidation or ranging market
Color intensity: Shows confidence in trend direction
💡 Best Practices
Let it adapt: Give the indicator 50+ bars to properly calibrate to the market
Combine timeframes: Use higher timeframe MESA for trend bias, lower for entries
Respect the bands: Price rarely stays outside bands for extended periods
Watch for compression: Narrow bands often precede explosive moves
Volume confirmation: Combine with volume for higher probability setups
📊 Optimal Timeframes
15m - 1H: Day trading with Fast Limit 0.6-0.8
4H - Daily: Swing trading with Fast Limit 0.4-0.6 (recommended)
Weekly: Position trading with Fast Limit 0.2-0.4
⚠️ Important Considerations
The indicator needs time to "learn" the market - avoid trading the first 50 bars after applying
Extreme gap events can temporarily disrupt cycle calculations
Works best in markets with detectable cyclical behavior
Less effective during news events or extreme volatility spikes
Consider the detected cycle period for position holding times
🔍 What Makes MESA Superior?
Compared to traditional indicators:
vs. Fixed MAs: Automatically adjusts to market conditions instead of using one-size-fits-all parameters
vs. Other Adaptive MAs: Uses true DSP mathematics rather than simple volatility adjustments
vs. Manual Optimization: Continuously re-optimizes itself in real-time
vs. Lagging Indicators: Hilbert Transform provides earlier trend change detection
🎓 Understanding Adaptation
The magic of MESA is that it solves the eternal dilemma of technical analysis: be fast and get whipsawed in chop, or be smooth and miss the early move. MESA does both by detecting when to be fast and when to be smooth.
Adaptation in Action:
Strong trend starts → MESA quickly detects phase change → Fast Limit kicks in → Early entry
Trend continues → Phase stabilizes → MESA maintains moderate speed → Smooth ride
Consolidation begins → Phase changes slow → Slow Limit engages → Whipsaw avoidance
🚀 Advanced Applications
Multi-timeframe confluence: Use MESA on 3 timeframes for high-probability setups
Divergence detection: Watch for MAMA/price divergences at band extremes
Cycle period analysis: The internal period calculation can guide position duration
Band squeeze trading: Narrow bands + MAMA/FAMA cross = high-probability breakout
Created by AlphaNatt - Based on John Ehlers' MESA research. For educational purposes. Always practice proper risk management. Not financial advice. Always DYOR.
