Adaptive ATR% Grid + SuperTrend + OrderFlipDescription:
This indicator combines multiple technical analysis tools to identify key price levels and trading signals:
ATR% Grid – automatic plotting of support and resistance levels based on current price and volatility (ATR). Useful for identifying potential targets and entry/exit zones.
SuperTrend – a classic trend indicator with an adaptive ATR multiplier that adjusts based on average volatility.
OrderFlip – identifies price reversal points relative to a moving average with ATR-based sensitivity, optionally filtered by OBV and DMI.
MTF Confirmation – multi-timeframe trend verification using EMA to reduce false signals.
Signal Labels – "LONG" and "SHORT" labels appear on the chart with an offset from the price for better visibility.
JSON Alerts – ready-to-use format for automated alerts, including price, SuperTrend direction, Fair Zone, and ATR%.
Features:
Fully compatible with Pine Script v6
Lines and signals are fixed on the chart, do not shift with new bars
Configurable grid, ATR, SuperTrend, and filter parameters
Works with MTF analysis and classic indicators (OBV/DMI)
Usage:
Best used with additional indicators and risk management strategies. ATR% Grid is ideal for both positional trading and intraday setups.
перевод на русский
Описание:
Этот индикатор объединяет несколько методов технического анализа для выявления ключевых уровней цены и сигналов на покупку/продажу:
Сетка ATR% (ATR% Grid) – автоматическое построение уровней поддержки и сопротивления на основе текущей цены и волатильности (ATR). Позволяет видеть потенциальные цели и зоны входа/выхода.
SuperTrend – классический трендовый индикатор с адаптивным множителем ATR, который корректируется на основе средней волатильности.
OrderFlip – определение моментов разворота цены относительно скользящей средней с учетом ATR, с возможностью фильтрации по OBV и DMI.
MTF-подтверждение – проверка направления тренда на нескольких таймфреймах с помощью EMA, чтобы снизить ложные сигналы.
Сигнальные метки – на графике появляются "LONG" и "SHORT" с отступом от цены для наглядности.
JSON Alerts – готовый формат для автоматических уведомлений, включающий цену, направление SuperTrend, Fair Zone и ATR%.
Особенности:
Поддержка Pine Script v6
Линии и сигналы закреплены на графике, не двигаются при обновлении свечей
Настраиваемые параметры сетки, ATR, SuperTrend и фильтров
Совместимость с MTF-анализом и классическими индикаторами OBV/DMI
Рекомендации:
Используйте в сочетании с другими индикаторами и стратегиями управления риском. Сетка ATR% отлично подходит для позиционной торговли и интрадей.
ATR% Grid – automatic plotting of support and resistance levels based on current price and volatility (ATR). Useful for identifying potential targets and entry/exit zones.
SuperTrend – a classic trend indicator with an adaptive ATR multiplier that adjusts based on average volatility.
Medie mobili

ORB indicatorthis indicator marks out the first 15 min high and low on the candle that opens in each session, very easy to read and minimalist

Fibonacci Retrace + 50 EMA Hariss 369This indicator combines 3 concepts:
Fibonacci retracement zones
50 EMA trend filter
Price interaction with specific Fib zones to generate Buy/Sell signals
Let’s break everything down in simple language.
1. Fibonacci Retracement Logic
The script finds:
Most recent swing high
Most recent swing low
Using these two points, it draws Fibonacci levels:
Fibonacci Levels Used
Level Meaning Calculation
0% Swing Low recentLow
38.2% Light retracement high - (range × 0.382)
50% Mid retracement high - (range × 0.50)
61.8% Deep retracement high - (range × 0.618)
100% Swing High recentHigh
🔍 Why only these levels?
Because trading signals are generated based ONLY on:38.2%, 50%,61.8%
These 3 levels define the golden retracement zones.
2. Trend Filter — 50 EMA
A powerful rule:
Trend Up (bullish)
➡️ Price > 50 EMA
Trend Down (bearish)
➡️ Price < 50 EMA
This prevents signals against the main trend.
3. BUY Conditions (Retracement + EMA)
A BUY signal appears when:
Price is above the 50 EMA (trend is up)
Price retraces into the BUY ZONE:
🔵 BUY ZONE = between 50% and 38.2% Fibonacci i.e.,close >= Fib50 AND close <= Fib38.2
This means:
Market is trending up
Price corrected to a healthy retracement level
Buyers are stepping back in
📘 Why this zone?
This is a moderate retracement (not too shallow, not too deep).
Smart money often enters at 38.2%–50% in a strong trend.
📘 BUY Signal Appears With:
Green “BUY” label
Green arrow below the candle
4. SELL Conditions (Retracement + EMA)
A SELL signal appears when:
Price is below the 50 EMA (trend is down)
Price retraces upward into the SELL ZONE:
🔴 SELL ZONE = between 50% and 61.8% Fibonacci i.e.,close <= Fib50 AND close >= Fib61.8
This means:
Market is trending down
Price made a pullback
Sellers regain control in the golden zone
📘 Why this zone?
50–61.8 retracement is the ideal bearish pullback level.
📘 SELL Signal Appears With:
Red “SELL” label
Red arrow above the candle
5. STOP-LOSS (SL) RULES
For BUY trades,
Place SL below 61.8% level.SL = Fib 61.8%
OR
more safe:SL = swing low (Fib 0%)
For SELL trades
Place SL above 38.2% level.SL = Fib 38.2%
OR conservative:
SL = swing high (Fib 100%)
6. TAKE-PROFIT (TP) RULES
Based on common Fibonacci extensions.
BUY Trade TP Options
TP Level Meaning
TP1 Return to 38.2% Quick scalping target
TP2 Return to swing high Full trend target
TP3 Breakout above swing high Trend continuation
Practical suggestion:
TP1 = 1× risk
TP2 = 2× risk
TP3 = trailing stop
SELL Trade TP Options
TP Level Meaning
TP1 Return to 61.8% Moderate bounce
TP2 Return to swing low Trend target
TP3 Break below swing low Trend continuation
7. Recommended Trading Plan (Simple)
BUY PLAN
Price > 50 EMA (uptrend)
Enter at BUY signal in 38.2–50% zone
SL at 61.8%
TP at swing high or structure break
SELL PLAN
Price < 50 EMA (downtrend)
Enter at SELL signal in 50–61.8% zone
SL above 38.2%
TP at swing low
🟩 Summary (Very Easy to Remember)
🔵 BUY
Trend: above 50 EMA
Zone: between 50% and 38.2%
SL: below 61.8%
TP: swing high
🔴 SELL
Trend: below 50 EMA
Zone: between 50% and 61.8%
SL: above 38.2%
TP: swing low

Multi MAThis TradingView indicator displays four customizable moving averages on your price chart: two Exponential Moving Averages (EMAs) and two Simple Moving Averages (SMAs).
The default settings show a 10-period EMA (aqua), 21-period EMA (orange), 50-period SMA (green), and 200-period SMA (red), which are commonly used timeframes for trend analysis.
Each moving average can be individually toggled on or off, and their lengths and colors are fully adjustable through the indicator settings.
The EMAs react more quickly to price changes while the SMAs provide smoother, more gradual trend indicators, making this useful for identifying support/resistance levels and trend direction.
Traders often watch for crossovers between these moving averages as potential entry or exit signals, with the 50/200 SMA cross being particularly significant as the "golden cross" or "death cross."

ema_sw_alligatorA powerful and visually intuitive trading indicator that plots four exponential moving averages (EMA 8, 13, 48, 200) with customizable offsets and dynamic gradient visualization between the fast EMAs.
key features:
- four ema periods: displays ema 8, 13, 48, and 200 with customizable lengths
- customizable offsets: each ema can be shifted forward or backward in time (default: ema 200 offset 20, ema 48 offset 5, ema 13 offset 10, ema 8 offset 0)
- dynamic gradient system: visual color gradient between ema 8 and ema 13 that changes based on momentum:
-- green gradient when ema 8 crosses above ema 13 (bullish momentum)
-- red gradient when ema 8 crosses below ema 13 (bearish momentum)
- full customization:
- toggle individual ema visibility on/off
- customize colors for each ema line
- adjust gradient colors and transparency
- modify offset values for each ema
trading strategy:
ENTRY (Long)
- DAILY Chart
- 8 EMA crosses above 200 and 13 EMA
- Price remains above 200 EMA
- Break of Structure
Stay in:
- IF price stays above 8/13 and 48EMA after Entry
EXIT / STOP:
- Stop under recent swing low
- Exit when price crosses below 13 EMA IF under Entry
- Exit when price crosses below 48 EMA IF under Entry
trading applications:
- identify trend direction using the ema alignment
- spot potential entry points when ema 8 crosses ema 13 with gradient color confirmation
- use ema 48 and ema 200 as longer-term trend filters
- the offset feature helps anticipate potential support/resistance levels
- clear entry and exit rules based on EMA crossovers and price structure
settings overview:
- adjust ema lengths according to your trading style
- modify offsets to fine-tune the indicator's responsiveness
- customize colors for better visual clarity
- control gradient transparency to balance visibility and chart readability
perfect for swing traders, day traders, and anyone who uses moving average crossovers in their trading strategy. the visual gradient makes it easy to identify momentum shifts at a glance, while the clear trading rules provide a systematic approach to entries and exits.

5 MA Length Custom [wjdtks255]Indicator Title: 5 MA Length Custom
This indicator is a minimalist tool designed for pure trend visualization across five user-defined periods using Simple Moving Averages (SMAs). It contains no built-in signals or dynamic features—it serves strictly as a trend filter and confirmation layer.
Key Features and Customization
The indicator plots five fixed-color, fixed-thickness moving average lines. Only the Length (period) of each MA can be changed in the settings, offering clean, focused market analysis.
MA 1 (Default 5): Immediate price action.
MA 2 (Default 20): Short-term momentum.
MA 3 (Default 60): Key Mid-term Trend Line.
MA 4 (Default 40): Proxy for the standard Bollinger Band Center Line.
MA 5 (Default 120): Major Long-term Trend.
🧭 Trading Strategy: MA Filtered Reversion
This strategy uses the MA hierarchy for trend filtering and bias confirmation when executing trades based on an external signal indicator (e.g., a volatility/reversal signal like BB OPT EN).
🟢 Long Bias Confirmation (Buy)
The short-term trend must support the mid-term trend. This is confirmed when MA 2 (20) is positioned above MA 3 (60). When this alignment occurs, you should only take external Buy signals (reversal signals) for higher probability trades.
🔴 Short Bias Confirmation (Sell)
The short-term trend must align with the bearish direction. This is confirmed when MA 2 (20) is positioned below MA 3 (60). When this alignment occurs, you should only take external Sell signals (reversal signals) for higher probability trades.

able MACD Overview
Purpose: The indicator combines the traditional MACD (Moving Average Convergence Divergence) with a short-term “forecast” (projection) of MACD/histogram values to give early warning of momentum changes.
Typical outputs:
MACD line (fastEMA − slowEMA)
Signal line (EMA of MACD)
Histogram (MACD − signal)
Forecasted MACD or histogram projected N bars ahead
Optional buy/sell markers and alert conditions
Add the indicator to TradingView (Installation)
Open TradingView and the chart you want to apply the indicator to.
Click “Pine Editor” at the bottom of the chart.
Copy the contents of able_macd_forecast.pine into the Pine Editor window.
Click “Add to chart” (or Save then Add to chart). If it’s a study, it will appear on the chart below price.
If you plan to re-use the script, click Save and give it a meaningful name.
Inputs / Parameters (typical) Note: exact input names may differ in your script. Replace the names below with the script’s input labels when you inspect it.
Source: price source for calculations (close, hl2, etc.).
Fast Length: length for the fast EMA (commonly 12).
Slow Length: length for the slow EMA (commonly 26).
Signal Length: length for the MACD signal EMA (commonly 9).
Forecast Length / Horizon: how many bars ahead the script projects the MACD/histogram (e.g., 1–5).
Forecast Method / Smoothing: choice of projection method (linear regression, EMA extrapolation, simple slope * N, etc.) if available.
Histogram Thresholds: numeric thresholds to emphasize significant momentum (optional).
Show Forecast: toggle on/off the forecast plot.
Alerts On/Off toggles: enable or disable alert conditions baked into the indicator.
Visual / Style settings: colors, plot thickness, histogram style (columns/areas), show labels, show buy/sell arrows.
How the indicator is typically calculated (summary)
MACD line = EMA(source, fast) − EMA(source, slow)
Signal line = EMA(MACD line, signal length)
Histogram = MACD − Signal
Forecast = method-specific short-term projection of MACD or histogram (for example: extend the last slope forward, apply linear regression to MACD values and extrapolate N bars, or apply an additional smoothing and extend that value) Note: For exact math, I need to inspect the script; this is the typical approach.
How to read the indicator (signals & interpretation)
Bullish signal:
MACD line crossing above the signal line (MACD cross up).
Histogram turns positive (cross above zero).
Forecast shows MACD/histogram moving higher in the next N bars (if forecast is positive or trending up).
Bearish signal:
MACD line crossing below the signal line (MACD cross down).
Histogram turns negative (cross below zero).
Forecast shows MACD/histogram moving lower ahead.
Confirmations:
Use price action (higher highs/lows for bullish, lower highs/lows for bearish).
Volume or other momentum/confluence indicators (RSI, ADX).
Divergences:
Bullish divergence: price makes lower low while MACD histogram makes higher low.
Bearish divergence: price makes higher high while MACD histogram makes lower high.
Forecast behavior:
If the forecast leads the MACD cross (forecast crosses before the current MACD does), it’s an early warning.
Use caution: forecasts are prone to false signals; always confirm.
Common trading setups using this indicator
Conservative:
Wait for MACD to cross signal + histogram above zero + forecast already trending same direction.
Use stop below recent swing low (for long) or above recent swing high (for short).
Aggressive (early entry):
Enter when forecast turns positive while MACD still below signal (anticipating cross).
Use tighter stops and smaller position sizes.
Exit rules:
Opposite MACD cross, histogram flipping sign, or a target based on risk-reward.
Use trailing stop based on ATR or structure.
Example settings for different timeframes (starting points)
Scalping / 5–15 min:
Fast 8, Slow 21, Signal 5, Forecast 1–2
Intraday / 1H:
Fast 12, Slow 26, Signal 9, Forecast 2–3
Swing / 4H–Daily:
Fast 12, Slow 26, Signal 9, Forecast 3–5 Adjust based on the asset volatility and backtests.
Adding alerts (TradingView)
Click the “Alerts” button (clock icon) or press Alt + A.
In the Condition dropdown, select the indicator name (able_macd_forecast) and choose a plotted series or built-in alert condition (if the script uses alertcondition).
Common alert types:
MACD crosses Signal (Crossing)
Histogram crosses 0 (Crossing)
Forecast crosses 0 or Forecast trend change (if provided)
Message templates:
“{{ticker}}: MACD crossed above signal on {{interval}}”
“{{ticker}} Forecast positive: MACD forecast shows upward momentum”
Customize the message for your trade automation or notifications.
Configure frequency (Only once, Once per bar, or Once per bar close) — for signals like crossovers, “Once per bar close” is usually safer to avoid repainting issues. Note: If the script includes alertcondition() calls with explicit IDs/messages, use those directly — they are the most reliable for automation.
Backtesting / Strategy conversion
If this script is a study (indicator), you can:
Convert it to a strategy by adding strategy.* order calls (strategy.entry, strategy.close) using the entry/exit logic you prefer, or
Use TradingView’s “Bar Replay” to manually test signals across different markets/timeframes.
If you want, I can help convert or write a strategy wrapper that uses the indicator’s signals to place backtest trades (I’ll need the code).
Practical tips & best practices
Use higher timeframe confirmation for lower-timeframe entries (e.g., check daily MACD momentum before trading 15m signals).
Beware of choppy markets; MACD / forecast may produce whipsaws. Combine with trend filters (moving average direction, ADX).
If you rely on forecasted values, prefer alerts “on bar close” when possible to reduce false alerts from intra-bar noise.
Tune parameters for the specific asset (FX, crypto, stocks have different behavior).
Record each signal and outcome for a sample period (20–100 trades) to evaluate performance.
Troubleshooting
Indicator won’t add: verify Pine version in script header (//@version=4 or //@version=5). TradingView may reject scripts with unsupported version syntax.
Plots missing: check script inputs (Some scripts hide plots if toggles are off).
Alerts firing too often: change alert frequency to “Once per bar close” or adjust threshold values.
Forecast seems to repaint: some forecast methods can repaint (use “bar_index” or store values only on closed bars, or use non-repainting forecast methods). Ask me to inspect the script for repainting logic.
What I can do next (recommended)
If you paste the content of able_macd_forecast.pine here, I will:
Produce a precise, line-by-line usage guide mapping to the exact input names and default values.
Show the exact plotted series names and how to reference them for alerts.
Point out any repainting risks and suggest fixes.
Provide example alert messages that match the script’s alertcondition IDs (if any).
Optionally convert it into a strategy for backtesting, or add non-repainting forecast logic if needed.

ArithmaReg Candles [NeuraAlgo]ArithmaReg Candles
ArimaReg Candles provide a quantitative approach toward the visualization of price by rebuilding each candle using an adaptive regression model. This indicator eliminates much of the noise and micro-spikes and consolidates irregular volatility of raw OHLC data, which typically characterizes candles, into a much cleaner and more stable representation that better reflects the true directional intent of the market.
The algorithm applies a dynamic state-space filter to track the equilibrium price, truePrice, while suppressing high-frequency fluctuations. Noise in the price is extracted by comparing the raw close to the filtered state and removed from the candle body and wick structure through controlled adjustment logic. Finally, a volatility-based spread model rebuilds the candle's range to maintain realistic price geometry.
The direction of trends is given by comparing the truePrice against a smoothing baseline, permitting ArithmaReg Candles to underline the bullish and bearish phases with more clarity and much-reduced distortion. This yields a chart where transitions within trends, pullbacks, and momentum shifts are much easier to comprehend than their representation via traditional candles.
ArithmaReg Candles are designed for traders who require consistent, noise-filtered price structure-ideal for trend analysis, breakout validation, and precision entries. The indicator itself does not generate any signals; it only refines the visual environment so that your existing tools and decision models become more reliable.
How It Works
Micro-Price Extraction
A weighted micro-price is calculated to represent the bar's internal structure and reduce intrabar irregularities.
Adaptive Regression Filter
The state-based regression engine continuously updates price equilibrium, adjusting its confidence level. This gives the filter the ability to remain responsive during strong movements yet be stable during noisy periods.
Noise Removal & Candle Reconstruction
The difference between raw price and truePrice is considered noise. This noise is subtracted from OHLC values, and a volatility-scaled spread restores realistic wick and body proportions. What results is a candle that depicts true directional flow.
Trend Classification
A smoothed trend baseline is computed from the filtered price, and candle color is determined by whether the market is positioned above or below this equilibrium trend.
How to Use It
Identify True Trend Direction
Candles follow the cleaned price path so that you can differentiate valid trend shifts from temporary spikes or wick-driven traps.
Improve Existing Strategies
These candles will complement your existing indicators, be they Supertrend, moving averages, volume tools, or momentum oscillators, by giving you a more sound price basis.
Spot Clean Breakouts & Pullbacks
Reduced noise makes breakout structure, swing highs/lows, and retracements significantly clearer. This is particularly useful in fast markets like crypto and Forex.
Improve Entry & Exit Timing
By highlighting the underlying flow of price, ArithmaReg Candles help traders avoid false signals and pinpoint spots where the price momentum is actually changing.
Adaptable to All Timeframes & Assets
The filter is self-adjusting, so it performs consistently on scalping timeframes, intraday charts, swing setups, and all asset classes. Summary ArithmaReg Candles create a mathematically refined view of market structure by removing noise and reconstructing candles through adaptive regression. The result is a more refined, stable price representation that improves trend recognition and decision-making and enables professional-grade technical analysis.

Gap & Go Day Trading Tool - Key Levels, Alerts & Setup GradingVisualizes Gap & Go setups with automatic gap detection, pre-market levels, and breakout signals. Shows: ✅ Gap % with quality rating (5%/10%/20%+) ✅ Pre-market high/low ✅ First candle range ✅ 50% gap fill target ✅ VWAP ✅ Relative volume. Includes setup grading system (A+ to C), entry signals on PM high breakouts, and 6 customizable alerts. Perfect for momentum day traders focusing on gapping stocks.
Full Description
█ OVERVIEW
The Gap & Go indicator automatically identifies and visualizes gap trading setups - one of the most popular momentum day trading strategies. When a stock gaps up significantly from the prior close, it often signals strong buying interest and potential for continuation moves.
This indicator displays all the key levels you need to trade gaps effectively, grades setup quality, and alerts you to breakout opportunities.
█ HOW IT WORKS
The indicator calculates the gap percentage between yesterday's close and today's open, then displays critical support/resistance levels that gap traders watch:
Gap Zone → The price range between prior close and gap open
Pre-Market High/Low → Key breakout and support levels from extended hours
First Candle Range → Opening range that often defines intraday direction
50% Gap Fill → Common retracement target and support level
VWAP → Institutional reference point
█ GAP CLASSIFICATION
Gaps are automatically classified by magnitude:
🔥 Qualifying Gap (5%+) → Meets minimum threshold for gap trading
🔥🔥 Strong Gap (10%+) → Ideal gap size for momentum plays
🔥🔥🔥 Monster Gap (20%+) → Exceptional move requiring extra attention
Background color changes based on gap quality for instant visual identification.
█ SETUP GRADING SYSTEM
The indicator grades each setup from A+ to C based on multiple factors:
- Gap magnitude (qualifying vs strong)
- Relative volume (2x+ vs 5x+ average)
- Price position relative to VWAP
A+ Setup (4-5 points) → High probability
A Setup (3 points) → Good setup
B Setup (2 points) → Moderate
C Setup (0-1 points) → Weak/avoid
█ ENTRY SIGNALS
Triangle signals appear when price breaks above key levels:
▲ Lime Triangle → Breaking above Pre-Market High
▲ Aqua Triangle → Breaking above First Candle High
Signals require volume confirmation by default (configurable).
█ KEY LEVELS DISPLAYED
- Prior Close (Orange) → Gap reference point
- Pre-Market High (Lime) → Primary breakout level
- Pre-Market Low (Red) → Support if gap fails
- First Candle Range (Aqua box) → Opening range breakout levels
- 50% Gap Fill (Yellow dotted) → Common support/target
- VWAP (Purple) → Institutional pivot
█ INFO TABLE
Real-time dashboard showing:
- Gap % with quality emoji
- Relative Volume with status
- All key price levels
- Breakout status (✓ if broken)
- Distance from PM High
- Setup Grade
█ ALERTS INCLUDED
6 customizable alerts:
1. Qualifying Gap Detected (5%+)
2. Strong Gap Detected (10%+)
3. Monster Gap Detected (20%+)
4. Pre-Market High Breakout
5. First Candle High Breakout
6. 50% Gap Fill Test
7. Full Gap Fill (setup invalidated)
█ SETTINGS
Gap Settings
- Minimum gap % threshold
- Strong gap % threshold
- Monster gap % threshold
Volume Settings
- Enable/disable relative volume filter
- Minimum RVol requirement
- Strong RVol threshold
- RVol calculation period
Level Settings
- Toggle each level type on/off
- Show/hide gap zone
- Show/hide VWAP
Signal Settings
- Breakout signal type (PM High, First Candle, Both)
- Volume confirmation requirement
Visual Settings
- Info table position
- Color customization for all levels
█ HOW TO USE
1. Scan for gapping stocks pre-market (use a scanner or watchlist)
2. Apply this indicator to candidates
3. Check the Setup Grade in the info table
4. Wait for price to consolidate near pre-market high
5. Enter on breakout above PM High with volume confirmation
6. Use 50% gap fill or PM Low as stop loss reference
7. Monitor VWAP - staying above is bullish
█ BEST PRACTICES
✓ Focus on A and A+ setups
✓ Require strong relative volume (5x+)
✓ Trade in the direction of the gap (long for gap ups)
✓ Watch for gap fill as potential support
✓ Be cautious if price falls below VWAP
✓ First 30-60 minutes typically have best momentum
█ TIMEFRAME RECOMMENDATIONS
- 1-minute: Scalping, precise entries
- 5-minute: Most common for gap trading (recommended)
- 15-minute: Swing entries, less noise
█ NOTES
- Pre-market levels require extended hours data enabled
- First candle range is based on the first regular market candle
- Works on stocks, ETFs, and futures
- Gaps down are detected but focus is on gap-up setups
█ DISCLAIMER
This indicator is for educational purposes only. Gap trading involves significant risk. Past performance does not guarantee future results. Always use proper risk management and never risk more than you can afford to lose.

Mambo MA & HAMambo MA & HA is a combined trend-view indicator that overlays Heikin Ashi direction markers and up to eight customizable moving averages on any chart.
The goal is to give a clear, uncluttered visual summary of short-term and long-term trend direction using both regular chart data and Heikin Ashi structure.
This indicator displays:
Heikin Ashi (HA) directional markers on the chart timeframe
Optional Heikin Ashi markers from a second, higher timeframe
Up to eight different moving averages (SMA, EMA, SMMA/RMA, WMA, VWMA)
Adjustable colors and transparency for visual layering
Offset controls for HA markers to prevent overlap with price candles
It is designed for visual clarity without altering the underlying price candles.
Heikin Ashi Direction Markers (Chart Timeframe)
The indicator generates HA OHLC values internally and compares the HA open and close:
Green (bullish) HA candle → triangle-up marker plotted above the bar
Red (bearish) HA candle → triangle-down marker plotted above the bar
The triangles use soft pastel colors for minimal obstruction:
Up marker: light green (rgb 204, 232, 204)
Down marker: light red (rgb 255, 204, 204)
The “HA Offset (chart TF ticks)” input lets users shift the triangle vertically in price terms to avoid overlapping the real candles or MAs.
Heikin Ashi Markers from a Second Timeframe
An optional second timeframe (default: 60m) shows additional HA direction:
Green HA (higher timeframe) → tiny triangle-up below the bar
Red HA (higher timeframe) → tiny triangle-down below the bar
This allows a trader to see higher-timeframe HA structure without switching charts.
The offset for the second timeframe is independent (“HA Offset (extra TF ticks)”).
Custom Moving Averages (Up to Eight)
The indicator includes eight individually configurable MAs, each with:
On/off visibility toggle
MA type
SMA
EMA
SMMA / RMA
WMA
VWMA
Source
Length
Color (with preset 70% transparency for visual stacking)
The default MA lengths are: 10, 20, 50, 100, 150, 200, 250, 300.
All MA colors are slightly transparent by design to avoid obscuring price bars and HA markers.
Purpose of the Indicator
This tool provides a simple combined view of:
Immediate trend direction (chart-TF HA markers)
Higher-timeframe HA trend bias (extra-TF markers)
Overall moving-average structure from short to very long periods
It is particularly useful for:
Monitoring trend continuation vs. reversal
Confirming entries with multi-TF Heikin Ashi direction
Identifying pullbacks relative to layered moving averages
Viewing trend context without switching timeframes
There are no signals, alerts, or strategy components.
It is strictly a visual trend-context tool.
Key Features Summary
Two-timeframe Heikin Ashi direction
Separate offsets for HA markers
Eight fully configurable MAs
Clean color scheme with low opacity
Non-intrusive overlays
Compatible with all markets and chart types

Moving VWAP-KAMA CloudMoving VWAP-KAMA Cloud
Overview
The Moving VWAP-KAMA Cloud is a high-conviction trend filter designed to solve a major problem with standard indicators: Noise. By combining a smoothed Volume Weighted Average Price (MVWAP) with Kaufman’s Adaptive Moving Average (KAMA), this indicator creates a "Value Zone" that identifies the true structural trend while ignoring choppy price action.
Unlike brittle lines that break constantly, this cloud is "slow" by design—making it exceptionally powerful for spotting genuine trend reversals and filtering out fakeouts.
How It Works
This script uses a unique "Double Smoothing" architecture:
The Anchor (MVWAP): We take the standard VWAP and smooth it with a 30-period EMA. This represents the "Fair Value" baseline where volume has supported price over time.
The Filter (KAMA): We apply Kaufman's Adaptive Moving Average to the already smoothed MVWAP. KAMA is unique because it flattens out during low-volatility (choppy) periods and speeds up during high-momentum trends.
The Cloud:
Green/Teal Cloud: Bullish Structure (MVWAP > KAMA)
Purple Cloud: Bearish Structure (MVWAP < KAMA)
🔥 The "Reversal Slingshot" Strategy
Backtests reveal a powerful behavior during major trend changes, particularly after long bear markets:
The Resistance Phase: During a long-term downtrend, price will repeatedly rally into the Purple Cloud and get rejected. The flattened KAMA line acts as a "concrete ceiling," keeping the bearish trend intact.
The Breakout & Flip: When price finally breaks above the cloud with conviction, and the cloud flips Green, it signals a structural regime change.
The "Slingshot" Retest: Often, immediately after this flip, price will drop back into the top of the cloud. This is the "Slingshot" moment. The old resistance becomes new, hardened support.
The Rally: From this support bounce, stocks often launch into a sustained, multi-month bull run. This setup has been observed repeatedly at the bottom of major corrections.
How to Use This Indicator
1. Dynamic Support & Resistance
The KAMA Wall: When price retraces into the cloud, the KAMA line often flattens out, acting as a hard "floor" or "wall." A break of this wall usually signals a genuine trend change, not just a stop hunt.
2. Trend Confirmation (Regime Filter)
Bullish Regime: If price is holding above the cloud, only look for Long setups.
Bearish Regime: If price is holding below the cloud, only look for Short setups.
No-Trade Zone: If price is stuck inside the cloud, the market is traversing fair value. Stand aside until a clear winner emerges.
3. Multi-Timeframe Versatility
While designed for trend confirmation on higher timeframes (4H, Daily), this indicator adapts beautifully to lower timeframes (5m, 15m) for intraday scalping.
On Lower Timeframes: The cloud reacts much faster, acting as a dynamic "VWAP Band" that helps intraday traders stay on the right side of momentum during the session.
Settings
Moving VWAP Period (30): The lookback period for the base VWAP smoothing.
KAMA Settings (10, 10, 30): Controls the sensitivity of the adaptive filter.
Cloud Transparency: Adjust to keep your chart clean.
Alerts Included
Price Cross Over/Under MVWAP
Price Cross Over/Under KAMA
Cloud Flip (Bullish/Bearish Trend Change)
Tip for Traders
This is not a signal entry indicator. It is a Trend Conviction tool. Use it to filter your entries from faster indicators (like RSI or MACD). If your fast indicator signals "Buy" but the cloud is Purple, the probability is low. Wait for the Cloud Flip

SwRp - Multi Trapezoidal WMASwRp - Multi TWMA (TF-aware) shows up to five configurable Trapezoidal Weighted Moving Averages (TWMA) across a single pane. Each line supports an independent length, weighted taper percent, source (Close/Open/High/Low/H&L/H&L+HL2), optional band (High & Low) with fill, and a post-calculation smoothing option. The indicator is timeframe-aware: calculations can run on the chart timeframe or on a selected higher/lower timeframe. Designed to visualize dynamic support/resistance and the market’s weighted center across multiple horizons.

Mark Minervini SEPA Swing TradingMark Minervini Complete Technical Strategy with buy signals and full dashboard showing all the parameters.

deKoder | Ultra High Timeframe Moving Average & Log StDev BandsdeKoder | Ultra High Timeframe Moving Average & Log StDev Bands
Identify long-term statistical extremes and map the core trend with the deKoder | uHTF MA indicator. Designed for macro analysis, this tool uses ultra high timeframe moving averages and logarithmic standard deviation bands to frame price action, providing clear signals for when an asset is statistically cheap, fairly priced, or expensive.
KEY FEATURES
• Ultra High Timeframe (uHTF) Moving Average:
• Acts as a dynamic long term fair value equilibrium line. Choose from periods like 1-Year, 2-Year, or 'Long Time'.
• Select your MA type: SMA, EMA, Hull MA, or a Rolling VWAP .
• Automatically fetches optimal data (4H/D) for smoother plotting on lower timeframes.
• Probabilistic Logarithmic Bands:
• The bands are calculated using log-standard deviation , creating a framework that adapts to exponential growth. As such, your chart price scale should be set to log.
• ~68% of price action typically occurs between the ±1σ bands (fair value zone).
• Trading in the ±1σ to ±2σ channel is typical in a strongly trending market. Moves towards the ±3σ bands can indicate that the market is becoming overextended. Expect strong price moves here and pay attention for signs of reversal.
• Bitcoin Halving Timeline:
• Integrated vertical lines and labels for all Bitcoin halvings.
• Correlates technical extremes with fundamental scarcity events.
• 4-Year Cycle Visual Aid:
• The background color cycle highlights yearly changes.
• Red years have historically aligned with bear markets, while the subsequent green zone has marked accumulation phases.
• Note: The bands provide the primary information - the background color is a contextual guide based on historical patterns around the BTC 4 year halving cycle that may not persist in future. It's quite possible that the market will act differently going forward considering the new types participants such as ETFs and government reserve funds.
HOW TO USE & INTERPRET
• Fair Value & Extremes:
• Price between ±1σ Bands: The asset is trading within a statistically fair value range.
• Price at +2σ / +3σ Bands: The asset is statistically expensive. Statistically, the price is overextended in this region, although you do NOT want to fade it based only upon this information.
• Price at -2σ / -3σ Bands: The asset is statistically cheap. These zones have frequently coincided with the end of bear markets and profound long-term buying opportunities.
• Dynamic Support & Resistance:
• The uHTF MA and its bands tend to act as support and resistance areas of interest on daily, weekly and monthly charts.
INPUTS & CUSTOMIZATION
• Toggles : Master switch for the MA, Bands, and Halving markers.
• uHTF Moving Average Filter : Select instrument (default: BITSTAMP:BTCUSD), price source, MA length, and type.
• Colours : Fine-tune the appearance of all elements.
PRO TIPS
• While created for Bitcoin, this principle will work well on other high-growth assets and major indices.
• The most reliable signals occur on the Daily, Weekly and Monthly timeframes.
• This is a lagging, macro-filter indicator. It is not for timing short-term entries but for confirming the long-term trend and cycle phase.
"Be Fearful When Others Are Greedy and Greedy When Others Are Fearful." - The deKoder | uHTF MA is here to help you quantify that greed and fear on a macro scale.


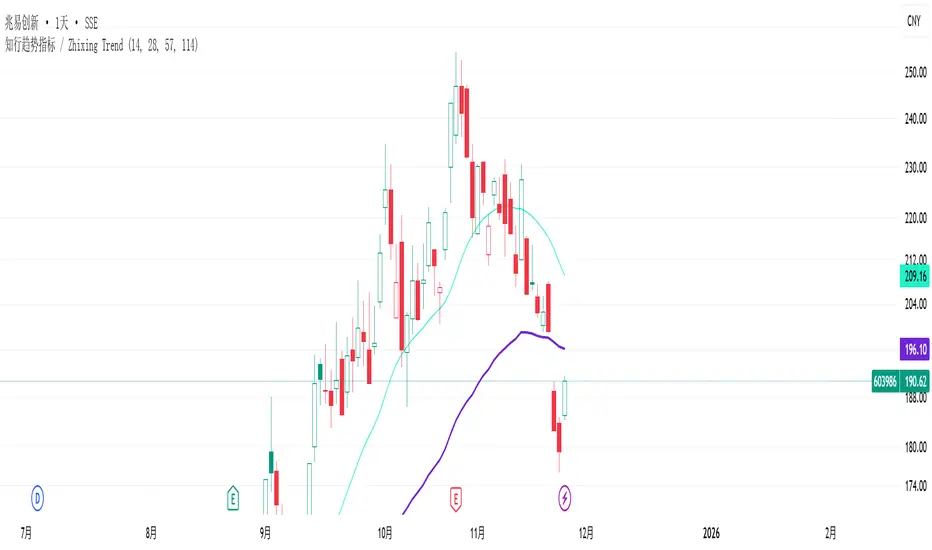
知行趋势指标根据Z哥给的通达信指标翻译为pine script,去掉了TV没有的行业板块概念信息。
知行趋势指标(Zhixing Trend Indicato)
知行趋势指标是一种基于多重均线的趋势跟踪工具,结合短期 EMA 与多周期 SMA,以判断市场的短期和中长期趋势。
指标组成:
知行短期趋势线(zx_short):采用双 EMA(EMA(EMA(Close, 10),10))计算,反应价格的短期波动和趋势。
知行多空线(zx_trend):由四条不同周期的 SMA 平均计算(默认周期 M1=14, M2=28, M3=57, M4=114),用于判断市场的多空方向。
使用说明:
指标只在日线及以上周期显示,分钟和小时级别周期自动隐藏。
短期趋势线可以捕捉快速的价格变化,而多空线用于确认整体趋势方向。
可通过调整四条 SMA 周期,适应不同市场和品种的波动特点。
Zhixing Trend Indicator
The Zhixing Trend Indicator is a trend-following tool based on multiple moving averages. It combines short-term EMA with multi-period SMA to identify both short-term and medium-to-long-term market trends.
Components:
Short-Term Trend Line (zx_short): Calculated using a double EMA (EMA(EMA(Close,10),10)), reflecting short-term price fluctuations and trend.
Bull-Bear Line (zx_trend): Calculated as the average of four SMAs with different periods (default M1=14, M2=28, M3=57, M4=114), used to determine overall market direction.
Usage Notes:
This indicator only displays on daily or higher timeframes; intraday (minute/hour) charts are automatically hidden.
The short-term trend line captures fast price movements, while the bull-bear line confirms the overall trend.
SMA periods can be adjusted to suit different markets or trading instruments.
Hull Trend Filtrado pro improved half hull with power indicator, try it and you will see how well it works

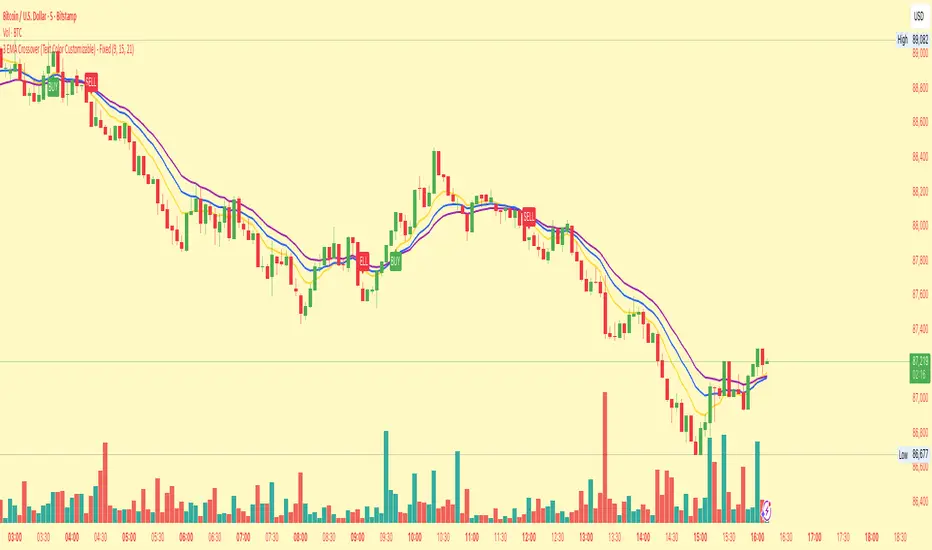
3 EMA Crossover (Text Color Customizable) - Fixed3 Ema crossover 9/15/21
it will generate buy and sell signal on crossover.
Dimagi72 Trend Suite (EMA/SMA + 52W + Cross Signals)Dimagi72 Trend Suite is an advanced trend analysis tool designed to give traders a clear picture of market direction, momentum, and major structural turning points.
It combines the most reliable long-term and short-term signals into one clean, easy-to-read indicator.
Features
• EMA9 & EMA21 for short-term momentum
• SMA50, SMA100, SMA200 for medium & long-term trend structure
• 52-Week High & Low levels for institutional support/resistance
• Golden Cross / Death Cross signals (SMA50 vs SMA200)
• Trend Strength Meter, shown directly on the chart
• Clean labels without clutter
• Designed for crypto, stocks, and forex on all timeframes (best on Daily)
How it works
The indicator measures alignment between EMAs and SMAs, tracks long-term institutional levels, and highlights major trend reversals through cross signals.
The Trend Strength Meter calculates a score from -4 to +4, making trend direction instantly visible.
Why use this indicator
This suite brings together the most widely used trend-following tools into one unified system.
It helps traders quickly determine when the market is bullish, bearish, or neutral — and when major reversals may be forming.
Best for:
Swing traders, long-term trend followers, crypto traders, and anyone who wants a clean visual overview of the trend without using multiple separate indicators.
Tags (use these to show up in search)
trend
ema
sma
trend-following
golden cross
death cross
momentum
trend strength
52 week high
crypto
stocks
market structure

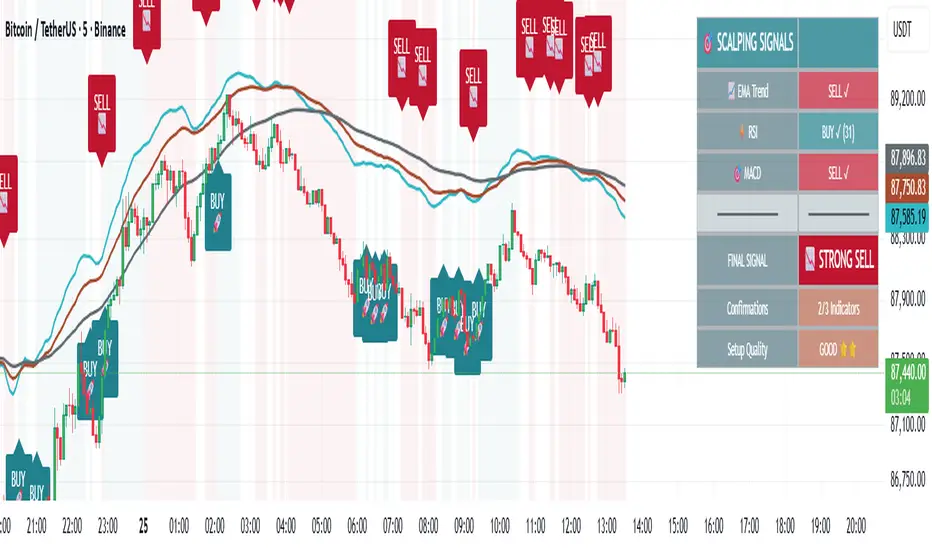
🎯 Advanced Scalping Indicator - Triple ConfirmationThis is the High Probability Scalping Indicator
Risk Reward: 1:2/3/4 or keep trailing SL
Bollinger Band with Clouds, MA, and Selectable Buy/Sell AlertsBollinger Bands + Clouds + Multi-TF Signals — All in One Open-Source Indicator
This open-source indicator combines multiple technical tools into a single, flexible charting solution — giving traders clear context and the ability to customize or build upon the code. Perfect for intraday, swing, or longer-term analysis.
What it includes:
NMA (Normalized Moving Average): Adaptive, multi-length moving average for trend visualization.
VWAP: Volume-weighted average price for intraday anchoring.
Bollinger Bands: Customizable upper/lower bands with baseline and fill, providing dynamic volatility context.
Hull Moving Average + Kalman Filter: Smoothed trend detection with optional buy/sell shapes on crossovers.
Multi-Timeframe EMAs: Short, medium, and long-term EMAs from multiple timeframes, all in one view.
RSI & ATR: Optional visibility to track momentum and volatility.
Customizable Colors & Transparency: Every line, fill, and shape can be adjusted independently.
Selectable Buy/Sell Alerts: Configurable shapes and TradingView alert conditions for strategy observation.
Why you’ll love it:
Fully open-source: inspect, modify, and adapt the code for your own analysis.
Clean, informative visualizations that consolidate multiple indicators without cluttering your chart.
Flexible for intraday, swing, or longer-term timeframes.
Team Player Friendly:
This script is intentionally published as open-source to support the TradingView community. All code is fully visible — no proprietary sections — so anyone can learn from, modify, and contribute to the indicator.
Disclaimer:
This indicator is for informational purposes only. It does not constitute financial, trading, or investment advice. Users should conduct their own analysis before making trading decisions.

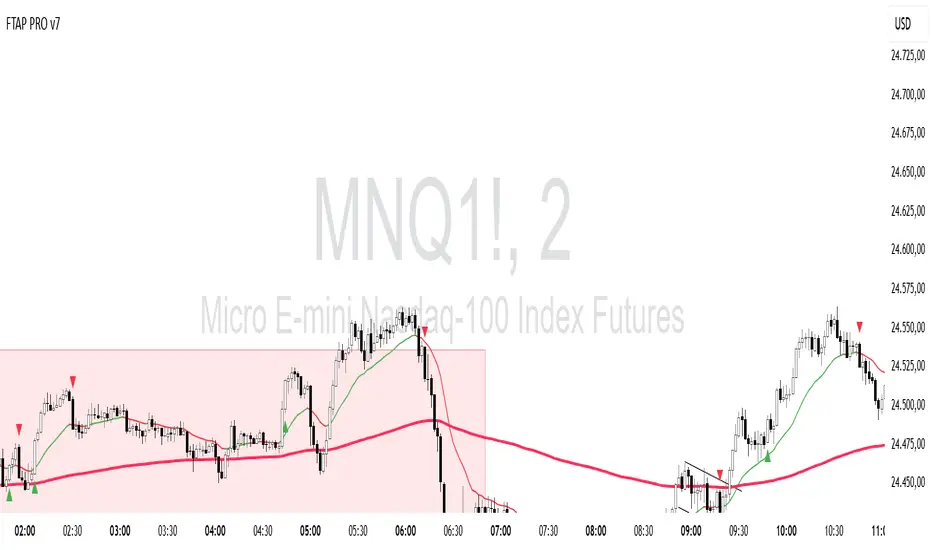
FTAP PRO TREND This indicator plots the 20- and 200-period exponential moving averages on the chart with a coloring rule and an entry signal based on the start bar of the FTAP method
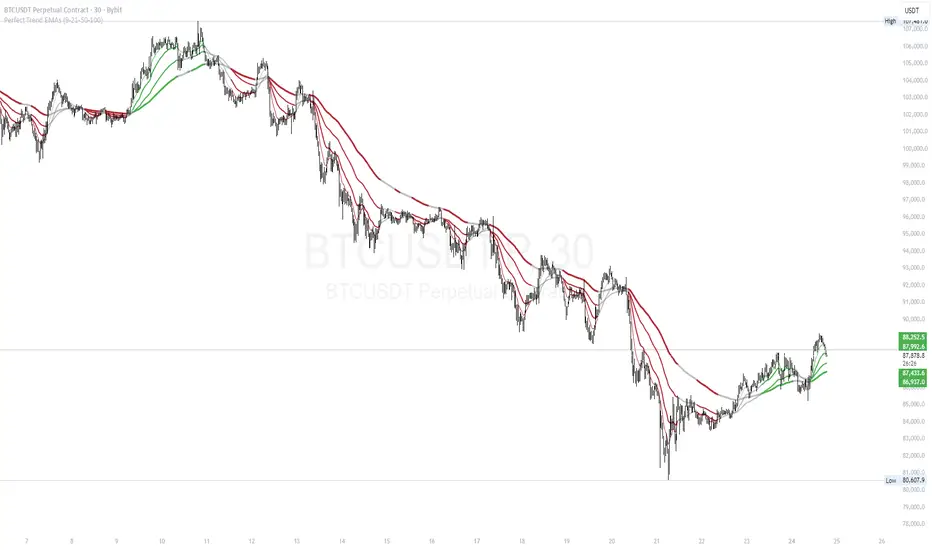
Perfect Trend EMAs (9-21-50-100)This indicator provides a clear, color-coded visual representation of trend strength based on the alignment of four Exponential Moving Averages (EMAs). It is designed to help traders identify "Perfect Trend" setups, where momentum is fully aligned across multiple timeframes, and filter out choppy or ranging markets.
How it Works (The Logic) The indicator plots four distinct EMAs (default lengths: 9, 21, 50, and 100). Instead of simply looking for crossovers, this script analyzes the hierarchical stacking of these averages to determine the market state.
The color coding follows these specific rules:
🟢 Bullish Alignment (Green): This occurs only when there is a "Perfect Bullish" stack.
Logic: EMA 9 > EMA 21 > EMA 50 > EMA 100
Interpretation: Short-term momentum is stronger than long-term momentum, indicating a strong uptrend.
🔴 Bearish Alignment (Red): This occurs only when there is a "Perfect Bearish" stack.
Logic: EMA 9 < EMA 21 < EMA 50 < EMA 100
Interpretation: Short-term momentum is weaker than long-term momentum, indicating a strong downtrend.
⚪ Consolidation / Transition (Gray):
Logic: Any other combination.
Interpretation: The moving averages are intertwined or not perfectly aligned. This usually signals a ranging market, a consolidation phase, or the early stages of a trend reversal before the alignment is confirmed.
Features
Dynamic Coloring: All EMA lines change color simultaneously to provide an instant visual signal of the market state.
Visual Fill: A soft background fill is applied between the fastest (9) and slowest (100) EMA to create a "Trend Cloud," making it easier to spot the expansion and contraction of the trend.
Customization: Users can adjust the lengths of all four EMAs in the settings menu to fit different trading styles (e.g., changing to 20/50/100/200).
How to Use
Trend Following: Traders can look for the lines to turn Green or Red to confirm a trend entry.
Filtering Noise: The Gray zones serve as a filter. If the lines are Gray, the trend is not fully established, suggesting caution or a "wait and see" approach.
Exits: A change from Green/Red back to Gray can act as an early warning sign that the trend momentum is fading.