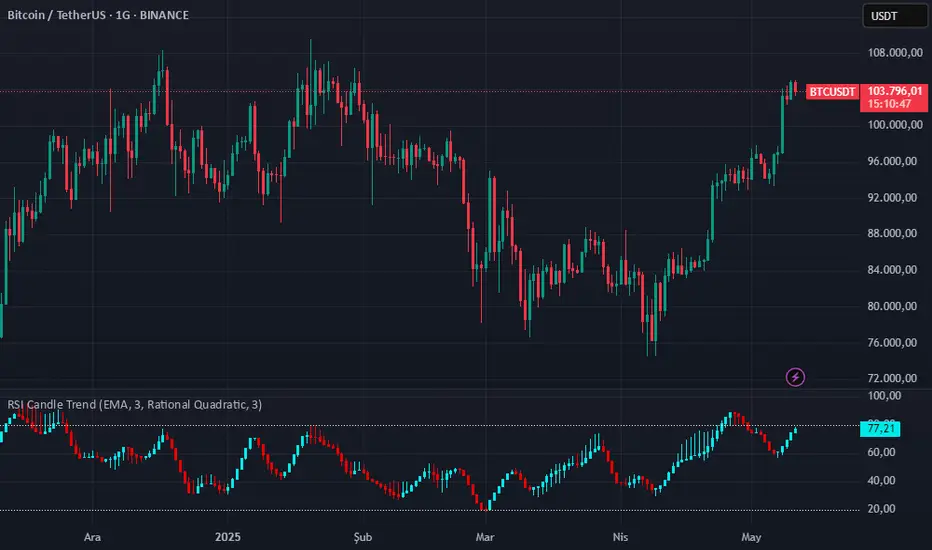
RSI Candle Trend🎯 Purpose:
This TradingView script is designed to visualize trend strength using RSI values as candle data, instead of traditional price candles. It transforms RSI data into custom candles using various smoothing and filtering methods (like Heikin-Ashi, Linear Regression, Rational Quadratic Filter, or McGinley Dynamic). It allows traders to:
📌Track RSI-based momentum using visual candle representation
📌Apply advanced smoothing/filters to the RSI to reduce noise
📌Highlight candle trend strength using dynamic coloring
📌Identify overbought/oversold zones using reference lines (RSI 80 and 20)
🧩 How It Works:
It calculates RSI values for open, high, low, close prices.
These RSI values are then optionally smoothed with user-selected moving averages (EMA, SMA, etc.).
Depending on the selected mode (Normal, Heikin-Ashi, Linear, Rational Quadratic), the RSI values are transformed into synthetic candles.
Candles are colored cyan (uptrend) or red (downtrend) based on RSI movement.
⚙️ Key Inputs:
Method: Type of moving average to smooth the RSI (e.g. EMA, SMA, VWMA, etc.)
Length: Length for RSI and smoothing filters
Candle: Type of candle transformation (Normal, Heikin-Ashi, Linear, Rational Quadratic)
Rational Quadratic: Parameter for the Rational Quadratic smoothing method
📊 Outputs:
Custom candles plotted using RSI-transformed values
Candle colors based on RSI strength:
Cyan for strong bullish RSI movement
Red for strong bearish RSI movement
Horizontal lines at RSI levels 80 and 20 (overbought/oversold)
🧠 Why Use This Indicator?
Unlike traditional RSI indicators that show a line, this tool:
Converts RSI into candle-style visualization
Helps traders visually interpret trend strength, reversals, or continuation patterns
Offers more refined control over RSI behavior and filtering
Provides a unique blend of momentum and candle analysis
❗Important Note:
This script is provided for educational purposes and does not constitute financial advice. Traders and investors should conduct their research and analysis before making any trading decisions.
Oscillatori
Bitcoin Relative Strength IndexThis script leverages on the original RSI indicator to create a naive strategy based on weekly RSI in order to trade bitcoin cycles.
Users can configure the thresholds at which buy low and sell high to backtest it against a pure buy and hold strategy.
Performance is better than buy and hold for several scenarios.

RSI-WMA + EMA Trend Filter | Signal OnlyThis is the specialized Indicator to create the internal Strategy for the class of Rio & Friend base on RSI-WMA with the EMA Trend Filter.
Enjoy and have fun with it!

Pivot Reversal StrategyPIVOT REVERSAL STRATAGY has a little bit of noise but i use HEIKEN ASHI 1 HOUR CANDLES for best results

AP IFTCCIv2/IFTStoch/IFTRSI Multi-TimeframeMulti-Timeframe IFT-CCI/Stoch/RSI Composite
This enhanced indicator combines three powerful oscillators—Inverse Fisher Transform (IFT) versions of the Commodity Channel Index (CCI), Stochastic, and Relative Strength Index (RSI)—into a unified multi-timeframe analysis tool. Originally developed by John Ehlers (pioneer of cyclical analysis and signal processing in trading systems) and adapted by KIVANC (@fr3762), this version adds dual-timeframe capability to compare indicator values across different chart resolutions.
Key Features:
Triple Oscillator Composite
IFT-CCI: Smoothed CCI values transformed via Ehlers' Inverse Fisher Transform (blue-gold)
IFT-Stochastic: Classic stochastic oscillator processed through IFT (blue)
IFT-RSI: RSI oscillator converted to IFT format (magenta)
Composite Average Line: Combined average of all three indicators (green)
Multi-Timeframe Analysis
Compare primary and secondary timeframes (e.g., 1H vs. 4H, daily vs. weekly)
Primary timeframe plots use solid lines with 80% opacity
Secondary timeframe (optional) uses dashed/circle markers with 40% opacity
Key Levels
Overbought (+0.75) and oversold (-0.75) reference lines
Zero-centerline for momentum direction bias
Applications:
Trend Confirmation: Align higher timeframe signals with lower timeframe entries
Divergence Detection: Spot inter-timeframe discrepancies in momentum
Regime Filter: Use higher timeframe composite values to filter trades
Technical Basis:
Inverse Fisher Transform: Compresses oscillator values into bounded (-1 to +1) range while emphasizing extreme moves
Dual WMA Smoothing: Combines initial calculation smoothing (WMA1) with final output smoothing (WMA2)
Exponential Scaling: (e^2x - 1)/(e^2x + 1) formula converts Gaussian-like distributions to bounded outputs
Credits:
Original Concept: John Ehlers (IFT methodology, cyclical analysis foundations)
Initial Implementation: KIVANC (@fr3762 on Twitter) for the base IFT-CCI/Stoch/RSI script
Multi-Timeframe Adaptation: for cross-resolution analysis capabilities
This tool is particularly effective for traders seeking to align multiple timeframes while using Ehlers' noise-reduction techniques. The composite average line provides a consensus view, while the individual oscillators help identify component strength/weakness.

RSI-WMA + EMA Trend Filter | Signal OnlyThis is the specialized indicator representing the internal strategy created by RIO for the Trading Career 2025 Class.
Enjoy and have fun by using it if you feel the option being suitable for your trading!

GlitterBomber📈 GlitterBomber Indicator – Overview
The GlitterBomber is a dynamic channel-based indicator that blends trend-following and mean-reversion principles. It utilizes linear regression and standard deviation to create adaptive price bands and generates buy/sell signals, early alerts, and multi-timeframe support/resistance zones.
Whether you're swing trading, scalping, or running intraday setups, GlitterBomber is built to adapt.
⚙️ Settings & Configuration Guide
🔹 Channel Settings
Channel Length: Number of bars used to calculate the regression line and standard deviation.
Higher = smoother trend, less noise.
Lower = faster signals, more sensitivity.
Channel Width Multiplier: Expands the channel based on price volatility (standard deviation).
Higher multiplier = wider bands, fewer signals.
Lower = tighter bands, more signals.
Source: The price data used for calculations (e.g. close, hl2, ohlc4). Default is close.
🔹 Display Options
Show Mid Line?: Toggles the central regression line on/off. Useful for trend visualization and early signal reference.
🔹 Signal Alert Filters
Alert Type:
Buy Only – Triggers only bullish signals.
Sell Only – Triggers only bearish signals.
Both – Triggers all valid signals.
🔹 Early Signal Settings
These provide early warning signals when price moves a defined percentage away from the regression midline:
Early Buy % Below Midline: Fires when price drops below the midline by X%.
Early Sell % Above Midline: Fires when price rises above the midline by X%.
Useful for aggressive entries before outer band touches.
🔹 Support & Resistance Settings
Timeframe: Select the higher timeframe (e.g. Daily, 4H) from which to extract S/R levels.
Lookback Period: Number of bars to scan for highest highs (resistance) and lowest lows (support).
These horizontal S/R lines act as key reference levels for entries, exits, and stop-loss zones.
🧠 How It Works
📏 Linear Regression + Standard Deviation
Midline: A regression line that represents the average trend.
Upper/Lower Bands: Dynamically calculated by adding/subtracting standard deviation from the midline.
These form a statistical envelope — ideal for identifying trend boundaries and mean-reversion zones.
📊 Signal Logic
✅ Buy Signal
Fires when the price crosses above the lower channel — often indicating a bounce or trend reversal.
🚫 Sell Signal
Fires when the price crosses below the upper channel — potential exhaustion or short entry.
⚠️ Early Signals
Fired when price diverges from the midline by a user-defined percentage.
Useful for catching overextended moves before they hit outer bands.
📌 Support/Resistance Lines
Derived from a higher timeframe using lookback-based highs and lows.
Adds multi-timeframe confluence for more robust setups.
💼 3 Use Cases & Ideal Settings
✅ 1. Swing Trading (1H or 4H)
Goal: Capture medium-term reversion moves.
Channel Length: 100
Multiplier: 2.0
Early Buy/Sell %: 1.5%
S/R Timeframe: "D"
S/R Lookback: 50
Strategy:
Buy when price dips below the lower band and reverses.
Confirm confluence with daily support.
Exit at midline or upper resistance.
✅ 2. Intraday Trend Riding (15-Minute Chart)
Goal: Follow short-term momentum with breakout entries.
Channel Length: 50
Multiplier: 1.5
Early Signals: OFF (set both % to 0)
S/R Timeframe: "1H"
S/R Lookback: 24
Strategy:
Enter on breakout above the upper band.
Use S/R to trail or set profit targets.
Ideal in strong trending environments.
✅ 3. Scalping Reversals (5-Minute Chart)
Goal: Fade short-term overbought/oversold conditions.
Channel Length: 30
Multiplier: 1.0
Early Buy %: 0.8%
Early Sell %: 0.8%
S/R Timeframe: "15"
S/R Lookback: 20
Strategy:
Enter on early signal (circle) confirmation.
Exit quickly at midline.
Use higher timeframe S/R to avoid entering into major support or resistance.
🏁 Conclusion
GlitterBomber is more than just a channel indicator — it's a framework for building trades around statistical price behavior, multi-timeframe confluence, and early signal detection.
Whether you're fading, trending, or managing risk through key zones — this tool gives you both structure and flexibility.
Please feel free to comment and offer suggestion always up for hear new idea's!
Happy Trading!

Market Sentiment Index US Top 40 [Pt]▮Overview
Market Sentiment Index US Top 40 [Pt} shows how the largest US stocks behave together. You pick one simple measure—High Low breakouts, Above Below moving average, or RSI overbought/oversold—and see how many of your chosen top 10/20/30/40 NYSE or NASDAQ names are bullish, neutral, or bearish.
This tool gives you a quick view of broad-market strength or weakness so you can time trades, confirm trends, and spot hidden shifts in market sentiment.
▮Key Features
► Three Simple Modes
High Low Index: counts stocks making new highs or lows over your lookback period
Above Below MA: flags stocks trading above or below their moving average
RSI Sentiment: marks overbought or oversold stocks and plots a small histogram
► Universe Selection
Top 10, 20, 30, or 40 symbols from NYSE or NASDAQ
Option to weight by market cap or treat all symbols equally
► Timeframe Choice
Use your chart’s timeframe or any intraday, daily, weekly, or monthly resolution
► Histogram Smoothing
Two optional moving averages on the sentiment bars
Markers show when the faster average crosses above or below the slower one
► Ticker Table
Optional on-chart table showing each ticker’s state in color
Grid or single-row layout with adjustable text size and color settings
▮Inputs
► Mode and Lookback
Pick High Low, Above Below MA, or RSI Sentiment
Set lookback length (for example 10 bars)
If using Above Below MA, choose the moving average type (EMA, SMA, etc.)
► Universe Setup
Market: NYSE or NASDAQ
Number of symbols: 10, 20, 30, or 40
Weights: on or off
Timeframe: blank to match chart or pick any other
► Moving Averages on Histogram
Enable fast and slow averages
Set their lengths and types
Choose colors for averages and markers
► Table Options
Show or hide the symbol table
Select text size: tiny, small, or normal
Choose layout: grid or one-row
Pick colors for bullish, neutral, and bearish cells
Show or hide exchange prefixes
▮How to Read It
► Sentiment Bars
Green means bullish
Red means bearish
Near zero means neutral
► Zero Line
Separates bullish from bearish readings
► High Low Line (High Low mode only)
Smooth ratio of highs versus lows over your lookback
► MA Crosses
Fast MA above slow MA hints rising breadth
Fast MA below slow MA hints falling breadth
► Ticker Table
Each cell colored green, gray, or red for bull, neutral, or bear
▮Use Cases
► Confirm Market Trends
Early warning when price makes highs but breadth is weak
Catch rallies when breadth turns strong while price is flat
► Spot Sector Rotation
Switch between NYSE and NASDAQ to see which group leads
Watch tech versus industrial breadth to track money flow
► Filter Trade Signals
Enter longs only when breadth is bullish
Consider shorts when breadth turns negative
► Combine with Other Indicators
Use RSI Sentiment with trend tools to spot overextended moves
Add volume indicators in High Low mode for breakout confirmation
► Timeframe Analysis
Daily for big-picture bias
Intraday (15-min) for precise entries and exits

Multi-Speed ADX with AlertsADX 5 speed ForexAlien Wave following
You can wait for all the waves to grow and trade in the direction of the price action.
You can trade the three shortest waves for more action.
This will help you catch the longer momentum wave, allowing you to stay invested for days and avoid tying up your cash for an extended period.
15 years of chart pounding - ForexAlien
Best used where you can see that all the ADX speeds are compressed at the bottom, like a Bollinger band squeeze, and then explode out with a vengeance.
Let the force be with you!

Relative Strength IndexHello everyone! 👋
This is the standard RSI indicator with some small visual enhancements. Extra bands and background fills have been added to highlight overbought, oversold, and mid-level zones. There's also an option to enable RSI-based Bollinger Bands and basic divergence markers.
Feel free to use it if you find the extras helpful!

MACD, WT CROSS & HVPThis indicator combines three powerful tools for market analysis:
1️⃣ MACD (Moving Average Convergence Divergence)
The main histogram shows the MACD, which measures the difference between two exponential moving averages.
Red (negative) bars indicate selling pressure.
Green/blue (positive) bars indicate buying pressure.
This indicator is very useful for detecting trend changes and momentum strength.
2️⃣ WT CROSS Signal Dots
The small green and red dots over the histogram show key cross signals detected by the WT CROSS tool.
Green dots indicate a potential bullish cross (buy signal).
Red dots indicate a potential bearish cross (sell signal).
This helps quickly spot moments when the market may be about to reverse direction.
3️⃣ Historical Volatility Percentile (HVP)
The purple vertical flashes in the background highlight moments when historical volatility is extremely low.
When the HVP flashes, it signals a period of compressed volatility, often followed by a strong price move.
It acts as a trader alert, as low volatility phases often precede breakouts or sharp movements.

Multi-Indicator Swing [TIAMATCRYPTO]v6# Strategy Description:
## Multi-Indicator Swing
This strategy is designed for swing trading across various markets by combining multiple technical indicators to identify high-probability trading opportunities. The system focuses on trend strength confirmation and volume analysis to generate precise entry and exit signals.
### Core Components:
- **Supertrend Indicator**: Acts as the primary trend direction filter with optimized settings (Factor: 3.0, ATR Period: 10) to balance responsiveness and reliability.
- **ADX (Average Directional Index)**: Confirms the strength of the prevailing trend, filtering out sideways or choppy market conditions where the strategy avoids taking positions.
- **Liquidity Delta**: A volume-based indicator that analyzes buying and selling pressure imbalances to validate trend direction and potential reversals.
- **PSAR (Optional)**: Can be enabled to add additional confirmation for trend changes, turned off by default to reduce signal filtering.
### Key Features:
- **Flexible Direction Trading**: Choose between long-only, short-only, or bidirectional trading to adapt to market conditions or account restrictions.
- **Conservative Risk Management**: Implements fixed percentage-based stop losses (default 2%) and take profits (default 4%) for a positive risk-reward ratio.
- **Realistic Backtesting Parameters**: Includes commission (0.1%) and slippage (2 points) to reflect real-world trading conditions.
- **Visual Signals**: Clear buy/sell arrows with customizable sizes for easy identification on the chart.
- **Information Panel**: Dynamic display showing active indicators and current risk settings.
### Best Used On:
Daily timeframes for cryptocurrencies, forex, or stock indices. The strategy performs optimally on assets with clear trending behavior and sufficient volatility.
### Default Settings:
Optimized for conservative position sizing (5% of equity per trade) with an initial capital of $10,000. The backtesting period (2021-2023) provides a statistically significant sample of varied market conditions.

Custom RSI Color BandsRSI based indicator which will give you a Buy (Green) or Sell (Red) signal. It will also show you the No Trade Zone (Yellow).

siqbots 10,21,50
A ribbon for the 10 and 21 MA, and another line for the 50 MA.
Got the idea from Christopher Uhl - OVTLYR who uses the 10, 20, 50, but to make it original I made it the 21.

Bullish vs Bearish Strength IndicatorBullish Body Size (Green Line)
The cumulative size of all bullish candles over the selected period.
Bearish Body Size (Red Line)
The cumulative size of all bearish candles over the selected period.
Bull/Bear Ratio (Blue Line)
Real-time ratio of Bullish to Bearish strength.
Zero Line (Gray Line)
Optional visibility to track neutral zones.
Configurable Settings:
Toggle visibility of each plot.
Customize colors directly from the settings panel.

Supertrend + Stochastic RSIThe Supertrend + Stochastic RSI indicator is designed for scalping and short-term trading, combining the trend-following power of the Supertrend with the momentum insights of the Stochastic RSI to generate reliable buy and sell signals. This indicator aims to reduce false signals by requiring confirmation from both trend direction and momentum, making it suitable for traders targeting quick, high-probability trades in fast-moving markets on lower timeframes (e.g., 1-minute to 15-minute charts).
How It Works
The indicator integrates two technical components to produce actionable signals:
Supertrend for Trend Direction:
The Supertrend, calculated with a default length of 10 and a factor of 3.0, identifies the prevailing trend. It plots a line above or below the price, turning green when the trend is bullish (price above Supertrend) and red when bearish (price below Supertrend). This helps traders stay aligned with the market’s direction, reducing trades against the trend.
Stochastic RSI for Momentum Confirmation:
The Stochastic RSI, computed over a 14-period RSI with 3-period smoothing for %K and %D lines, measures momentum. A buy signal is generated when the %K line crosses above the oversold level (default: 20), indicating potential upward momentum, while a sell signal occurs when %K crosses below the overbought level (default: 80), suggesting downward momentum.
Signal Generation
Signals are produced only when both conditions align, using the previous bar’s values to prevent repainting:
Buy Signal: The Stochastic RSI %K crosses above the oversold level, and the Supertrend confirms a bullish trend (price above Supertrend). Displayed as a green upward triangle below the bar.
Sell Signal: The Stochastic RSI %K crosses below the overbought level, and the Supertrend confirms a bearish trend (price below Supertrend). Displayed as a red downward triangle above the bar.

Moving Average ExponentialColor Logic Integrated - The EMA line now changes to green when the price is above it and red when the price is below.
Smoothing MA Options - Added various types of MAs (SMA, EMA, SMMA, WMA, VWMA) that you can switch to dynamically.
Bollinger Bands Integration - If you select "SMA + Bollinger Bands," it will plot the bands around the moving average.
Background Fill - For Bollinger Bands, a light green fill is added when it's enabled.

Adaptive Volume-Weighted RSI (AVW-RSI)Concept Summary
The AVW-RSI is a modified version of the Relative Strength Index (RSI), where each price change is weighted by the relative trading volume for that period. This means periods of high volume (typically driven by institutions or “big money”) have a greater influence on the RSI calculation than periods of low volume.
Why AVW-RSI Helps Traders
Avoids Weak Signals During Low Volume
Standard RSI may show overbought/oversold zones even during low-volume periods (e.g., during lunch hours or after news).
AVW-RSI gives less weight to these periods, avoiding misleading signals.
Amplifies Strong Momentum Moves
If RSI is rising during high volume, it's more likely driven by institutional buying—AVW-RSI reflects that stronger by weighting the RSI component.
Filters Out Retail Noise
By prioritizing high-volume candles, it naturally discounts fakeouts caused by thin markets or retail-heavy moves.
Highlights Institutional Entry/Exit
Useful for spotting hidden accumulation/distribution that classic RSI would miss.
How It Works (Calculation Logic)
Traditional RSI Formula Recap
RSI = 100 - (100 / (1 + RS))
RS = Average Gain / Average Loss (over N periods)
Modified Step – Apply Volume Weight
For each period
Gain_t = max(Close_t - Close_{t-1}, 0)
Loss_t = max(Close_{t-1} - Close_t, 0)
Weight_t = Volume_t / AvgVolume(N)
WeightedGain_t = Gain_t * Weight_t
WeightedLoss_t = Loss_t * Weight_t
Weighted RSI
AvgWeightedGain = SMA(WeightedGain, N)
AvgWeightedLoss = SMA(WeightedLoss, N)
RS = AvgWeightedGain / AvgWeightedLoss
AVW-RSI = 100 - (100 / (1 + RS))
Visual Features on Chart
Line Color Gradient
Color gets darker as volume weight increases, signaling stronger conviction.
Overbought/Oversold Zones
Traditional: 70/30
Suggested AVW-RSI zones: Use dynamic thresholds based on historical volatility (e.g., 80/20 for high-volume coins).
Volume Spike Flags
Mark RSI turning points that occurred during volume spikes with a special dot/symbol.
Trading Strategies with AVW-RSI
1. Weighted RSI Divergence
Regular RSI divergence becomes more powerful when volume is high.
AVW-RSI divergence with volume spike is a strong signal of reversal.
2. Trend Confirmation
RSI crossing above 50 during rising volume is a good entry signal.
RSI crossing below 50 with high volume is a strong exit or short trigger.
3. Breakout Validation
Price breaking resistance + AVW-RSI > 60 with volume = Confirmed breakout.
Price breaking but AVW-RSI < 50 or on low volume = Potential fakeout.
Example Use Case
Stock XYZ is approaching a resistance zone. A trader sees:
Standard RSI: 65 → suggests strength.
Volume is 3x the average.
AVW-RSI: 78 → signals strong momentum with institutional backing.
The trader enters confidently, knowing this isn't just low-volume hype.
Limitations / Tips
Works best on liquid assets (Forex majors, large-cap stocks, BTC/ETH).
Should be used alongside price action and volume analysis—not standalone.
Periods of extremely high volume (news events) might need smoothing to avoid spikes.

stockan – Oscillator Matrixstockan – Oscillator Matrix
A multi-layer RSI-based momentum & trend tool with signal smoothing, short-segment regression lines, fade-style histogram, reversal markers, and a blocky heat-bar.
stockan is designed to give you a crystal-clear view of short-term momentum shifts and trend bias all in one pane. It builds upon the classic 0–100 RSI by:
Smoothing it with a quick SMA to generate a clean crossover signal.
Drawing tiny linear-regression segments on both RSI and its signal line to highlight the slope (i.e. local trend direction) over a handful of bars.
Filling between RSI and signal in green/red so you can instantly see when momentum flips.
Plotting a soft-fade histogram of (RSI – signal), where stronger moves produce more opaque bars, while smaller divergences fade into the background.
Marking local peaks and troughs on the RSI curve with dots—perfect for fine-tuning entries or exits.
Rendering a bottom “heat” strip as blocky columns that switch from red to green once RSI crosses your chosen threshold, giving you a persistent bias indicator.
🔧Inputs & Settings
You can customize every aspect of stockan in the Indicator Settings:
Price Source (default = Close)
Choose which price series (Open, High, Low, Close, or a custom series) you want the RSI to use.
Oscillator Length (RSI) (default = 14)
The look-back period for the RSI calculation. Shorter values make the oscillator more sensitive.
Signal Smoothing (default = 3)
The length of the simple moving average applied to the RSI. Higher values produce slower, cleaner signals.
Trend-LR Length (default = 20)
Number of bars used in each linear-regression segment. Longer lengths smooth trends but react more slowly.
Heat Threshold (default = 50)
The cutoff level (on the 0–100 RSI scale) above which the bottom heat-blocks turn green.
Histogram Max for Fade (default = 20)
The absolute difference (RSI – signal) that maps to 100% opacity in the histogram. Smaller differences fade out; larger ones stand out.
🚀 How to Use stockan
Identify Momentum Shifts
Watch for the green/red fill to flip—when the RSI line crosses above its signal, green fill indicates building bullish momentum; red indicates bearish pressure.
Sense Short-Term Trend with Mini-Regression Lines
The tiny sloping segments on both RSI and signal lines give an immediate visual cue: upward-tilted segments = short-term uptrend, downward = downtrend.
Gauge Strength with the Fade-Style Histogram
Opaque bars mean strong momentum divergence; faint bars mean weak or consolidating moves. Use these to avoid low-conviction signals.
Fine-Tune Entries & Exits Using Reversal Dots
Gray dots mark local RSI highs (possible short setups), green dots mark local lows (possible long entries).
Confirm Bias with the Heat-Bar
A steady green row at the bottom tells you RSI has been above your threshold consistently—ideal for trend-following. A red row suggests caution or counter-trend trades.
🎯 Benefits
All-in-One Pane: No need to juggle RSI, MA, histogram and custom script separately.
Clean Visuals: Soft fades and blocky heat bars reduce clutter and highlight what matters.
Non-Repainting: Uses only closed-bar data; once a bar is closed, nothing moves or disappears.
Highly Customizable: Every length, threshold, color and transparency can be adjusted in Settings.
Lightweight & Self-Contained: Pure Pine v5—no external libraries, no proprietary code—fully compliant with TradingView’s policies.

Stockan Momentum MeterStockan Momentum Meter (SMM)
Advanced Momentum Acceleration Oscillator
Version: 1.0 | Category: Momentum Oscillator | Type: Open Source
Detailed Technical Specification
Key Features
Dual-Layer Momentum Calculation
Calculates momentum using double derivative of price (ROC of ROC)
First Layer: Standard Rate of Change (ROC)
Second Layer: Momentum of Momentum (ROC applied to first ROC)
Signal Smoothing System
EMA filtering of raw momentum values
Adaptive smoothing based on user-defined length
4-State Color Coding
Quadrant-based visualization system:
Strong Bullish (Green): Histogram > Threshold
Moderate Bullish (Blue): 0 < Histogram ≤ Threshold
Moderate Bearish (Orange): -Threshold ≤ Histogram < 0
Strong Bearish (Red): Histogram < -Threshold
Dynamic Threshold System
Adjustable baseline levels for sensitivity control
Symmetrical upper/lower boundaries
Detailed Working Mechanism
Calculation Pipeline
Raw Momentum (momo):
momo = ROC(ROC(close, length), length)
Measures acceleration/deceleration in price movements
Double derivation filters out noise while capturing momentum shifts
Smoothed Signal (ema_momo):
ema_momo = EMA(momo, length)
Creates reference line for momentum comparison
Reduces whipsaws in volatile markets
Histogram Value:
histogram = momo - ema_momo
Visualizes difference between raw and smoothed momentum
Positive values = accelerating momentum
Negative values = decelerating momentum
PARAMETER CONFIGURATION
Momentum Length (Default: 14)
Range: 1-100 | Controls historical window for momentum calculations
Base Line Threshold (Default: 0.0)
Range: 0-100 | Determines sensitivity for color changes
COLOR CODING SYSTEM
GREEN Signals:
Histogram value ABOVE threshold level = Strong bullish momentum
BLUE Signals:
Positive values BETWEEN 0 and threshold = Moderate bullish pressure
ORANGE Signals:
Negative values BETWEEN 0 and -threshold = Moderate bearish pressure
RED Signals:
Histogram value BELOW -threshold = Strong bearish momentum
Key Benefits for Traders
Early Reversal Detection
Identifies momentum exhaustion before price reversal occurs
Divergence Spotting
Clear visualization of:
Bullish divergence (Price ↓ + Histogram ↑)
Bearish divergence (Price ↑ + Histogram ↓)
Trend Strength Measurement
Histogram height indicates momentum intensity
Multi-Timeframe Compatibility
Works effectively on:
Scalping (1-15min)
Swing Trading (1H-4H)
Position Trading (Daily-Weekly)
Customizable Sensitivity
Adjust threshold levels for:
Day traders (higher threshold = fewer signals)
Long-term investors (lower threshold = more sensitivity)
Usage Scenarios
Bullish Signal
Green histogram crossing above threshold
Blue → Green color transition
Bearish Signal
Red histogram crossing below negative threshold
Orange → Red color transition
Confirmation Tool
Use with trend indicators (EMA, MACD):
Green histogram + Price above 200 EMA = Strong uptrend
Red histogram + Price below 200 EMA = Strong downtrend
KEY ADVANTAGES OVER POPULAR INDICATORS
Faster Signals vs RSI
Detects momentum shifts earlier through double ROC calculation
Clearer Visuals vs MACD
Four-color system replaces confusing line crossovers with instant visual cues
Better Filtering vs Stochastic
Dual-layer calculation reduces market noise more effectively
Custom Sensitivity
Adjustable threshold outperforms fixed settings in traditional oscillators
How to Use
Add to chart from TradingView Public Library
Default settings work for most timeframes
Adjust parameters based on:
Aggressive trading: Reduce length (10-12)
Conservative trading: Increase length (20-25)
Combine with:
Trendlines for breakout confirmation
Volume indicators for signal validation
Notes
Best Performance: Ranging markets with clear support/resistance
Risk Management: Use with stop-loss (2x ATR recommended)
Limitations: May give false signals during low-volume periods

Parsifal.Swing.TrendScoreThe Parsifal.Swing.TrendScore indicator is a module within the Parsifal Swing Suite, which includes a set of swing indicators such as:
• Parsifal Swing TrendScore
• Parsifal Swing Composite
• Parsifal Swing RSI
• Parsifal Swing Flow
Each module serves as an indicator facilitating judgment of the current swing state in the underlying market.
________________________________________
Background
Market movements typically follow a time-varying trend channel within which prices oscillate. These oscillations—or swings—within the trend are inherently tradable.
They can be approached:
• One-sidedly, aligning with the trend (generally safer), or
• Two-sidedly, aiming to profit from mean reversions as well.
Note: Mean reversions in strong trends often manifest as sideways consolidations, making one-sided trades more stable.
________________________________________
The Parsifal Swing Suite
The modules aim to provide additional insights into the swing state within a trend and offer various trigger points to assist with entry decisions.
All modules in the suite act as weak oscillators, meaning they fluctuate within a range but are not bounded like true oscillators (e.g., RSI, which is constrained between 0% and 100%).
________________________________________
The Parsifal.Swing.TrendScore – Specifics
The Parsifal.Swing.TrendScore module combines short-term trend data with information about the current swing state, derived from raw price data and classical technical indicators. It provides an indication of how well the short-term trend aligns with the prevailing swing, based on recent market behavior.
________________________________________
How Swing.TrendScore Works
The Swing.TrendScore calculates a swing score by collecting data within a bin (i.e., a single candle or time bucket) that signals an upside or downside swing. These signals are then aggregated together with insights from classical swing indicators.
Additionally, it calculates a short-term trend score using core technical signals, including:
• The Z-score of the price's distance from various EMAs
• The slope of EMAs
• Other trend-strength signals from additional technical indicators
These two components—the swing score and the trend score—are then combined to form the Swing.TrendScore indicator, which evaluates the short-term trend in context with swing behavior.
________________________________________
How to Interpret Swing.TrendScore
The trend component enhances Swing.TrendScore’s ability to provide stronger signals when the short-term trend and swing state align.
It can also override the swing score; for example, even if a mean reversion appears to be forming, a dominant short-term trend may still control the market behavior.
This makes Swing.TrendScore particularly valuable for:
• Short-term trend-following strategies
• Medium-term swing trading
Unlike typical swing indicators, Swing.TrendScore is designed to respond more to medium-term swings rather than short-lived fluctuations.
________________________________________
Behavior and Chart Representation
The Swing.TrendScore indicator fluctuates within a range, as most of its components are range-bound (though Z-score components may technically extend beyond).
• Historically high or low values may suggest overbought or oversold conditions
• The chart displays:
o A fast curve (orange)
o A slow curve (white)
o A shaded background representing the market state
• Extreme values followed by curve reversals may signal a developing mean reversion
________________________________________
TrendScore Background Value
The Background Value reflects the combined state of the short-term trend and swing:
• > 0 (shaded green) → Bullish mode: swing and short-term trend both upward
• < 0 (shaded red) → Bearish mode: swing and short-term trend both downward
• The absolute value represents the confidence level in the market mode
Notably, the Background Value can remain positive during short downswings if the short-term trend remains bullish—and vice versa.
________________________________________
How to Use the Parsifal.Swing.TrendScore
Several change points can act as entry triggers or aids:
• Fast Trigger: change in slope of the fast signal curve
• Trigger: fast line crosses slow line or the slope of the slow signal changes
• Slow Trigger: change in sign of the Background Value
Examples of these trigger points are illustrated in the accompanying chart.
Additionally, market highs and lows aligning with the swing indicator values may serve as pivot points in the evolving price process.
________________________________________
As always, this indicator should be used in conjunction with other tools and market context in live trading.
While it provides valuable insight and potential entry points, it does not predict future price action.
Instead, it reflects recent tendencies and should be used judiciously.
________________________________________
Extensions
The aggregation of information—whether derived from bins or technical indicators—is currently performed via simple averaging. However, this can be modified using alternative weighting schemes, based on:
• Historical performance
• Relevance of the data
• Specific market conditions
Smoothing periods used in calculations are also modifiable. In general, the EMAs applied for smoothing can be extended to reflect expectations based on relevance-weighted probability measures.
Since EMAs inherently give more weight to recent data, this allows for adaptive smoothing.
Additionally, EMAs may be further extended to incorporate negative weights, akin to wavelet transform techniques.

Ceres Trader Simple Trend & Momentum SignalsCeres Trader – Simple Trend & Momentum Signals
Description:
Cut through chart noise with a lightweight, two-factor signal system that combines a classic trend filter (200 EMA) with momentum confirmation (smoothed RSI as a QQE proxy). This indicator plots clean entry arrows—no background shading, no clutter—so you can trade only in the high-probability regime:
Trend Filter: 200-period exponential moving average
Momentum Filter: RSI(14) smoothed over N bars, offset by 50 to create a zero-line
Long Entry: Price above the 200 EMA and the smoothed RSI crosses up through zero → green up-arrow below bar
Short Entry: Price below the 200 EMA and the smoothed RSI crosses down through zero → red down-arrow above bar
Key Features:
Minimalist display: only the 200 EMA and entry arrows
Customizable inputs: EMA length, RSI length, RSI smoothing period
Ultra-low CPU load: suitable for lower timeframes (e.g. 1 min gold futures)
Yellow label text: for optimal visibility on dark or light chart backgrounds
How to Use:
Add the script to your TradingView chart.
Choose your timeframe and adjust inputs as needed.
Take only the long signals when price is above the EMA, and only the short signals when price is below.
Place stops just beyond the EMA; targets can be measured swings or fixed R-multiples.
Notes:
Designed as a regime-based entry filter—no exits or background fills included.
Feel free to combine with your own stop-loss, take-profit, and money-management rules.
Trade smarter, not harder—let the market tell you only when both trend and momentum align.

分层 + 手动分位 StochRSI(红蓝点版)用 getPercentile() 手动对数组排序取分位,避免引用不存在的 API。
ATR 数组 atrArr 定期 push/shift,实时分层。
对应波动层分别维护 lowArr/midArr/highArr,计算 osLine/obLine。
用两条 plot(..., style=plot.style_circles),掩码表达式 buySig ? osLine : na 与 sellSig ? obLine : na,只在穿越当根 K 线上画蓝/红圆点,且精准落在阈值线上。
