Ceres Trader Simple Trend & Momentum SignalsCeres Trader – Simple Trend & Momentum Signals
Description:
Cut through chart noise with a lightweight, two-factor signal system that combines a classic trend filter (200 EMA) with momentum confirmation (smoothed RSI as a QQE proxy). This indicator plots clean entry arrows—no background shading, no clutter—so you can trade only in the high-probability regime:
Trend Filter: 200-period exponential moving average
Momentum Filter: RSI(14) smoothed over N bars, offset by 50 to create a zero-line
Long Entry: Price above the 200 EMA and the smoothed RSI crosses up through zero → green up-arrow below bar
Short Entry: Price below the 200 EMA and the smoothed RSI crosses down through zero → red down-arrow above bar
Key Features:
Minimalist display: only the 200 EMA and entry arrows
Customizable inputs: EMA length, RSI length, RSI smoothing period
Ultra-low CPU load: suitable for lower timeframes (e.g. 1 min gold futures)
Yellow label text: for optimal visibility on dark or light chart backgrounds
How to Use:
Add the script to your TradingView chart.
Choose your timeframe and adjust inputs as needed.
Take only the long signals when price is above the EMA, and only the short signals when price is below.
Place stops just beyond the EMA; targets can be measured swings or fixed R-multiples.
Notes:
Designed as a regime-based entry filter—no exits or background fills included.
Feel free to combine with your own stop-loss, take-profit, and money-management rules.
Trade smarter, not harder—let the market tell you only when both trend and momentum align.
Oscillatori

stockan – Oscillator Matrixstockan – Oscillator Matrix
A multi-layer RSI-based momentum & trend tool with signal smoothing, short-segment regression lines, fade-style histogram, reversal markers, and a blocky heat-bar.
stockan is designed to give you a crystal-clear view of short-term momentum shifts and trend bias all in one pane. It builds upon the classic 0–100 RSI by:
Smoothing it with a quick SMA to generate a clean crossover signal.
Drawing tiny linear-regression segments on both RSI and its signal line to highlight the slope (i.e. local trend direction) over a handful of bars.
Filling between RSI and signal in green/red so you can instantly see when momentum flips.
Plotting a soft-fade histogram of (RSI – signal), where stronger moves produce more opaque bars, while smaller divergences fade into the background.
Marking local peaks and troughs on the RSI curve with dots—perfect for fine-tuning entries or exits.
Rendering a bottom “heat” strip as blocky columns that switch from red to green once RSI crosses your chosen threshold, giving you a persistent bias indicator.
🔧Inputs & Settings
You can customize every aspect of stockan in the Indicator Settings:
Price Source (default = Close)
Choose which price series (Open, High, Low, Close, or a custom series) you want the RSI to use.
Oscillator Length (RSI) (default = 14)
The look-back period for the RSI calculation. Shorter values make the oscillator more sensitive.
Signal Smoothing (default = 3)
The length of the simple moving average applied to the RSI. Higher values produce slower, cleaner signals.
Trend-LR Length (default = 20)
Number of bars used in each linear-regression segment. Longer lengths smooth trends but react more slowly.
Heat Threshold (default = 50)
The cutoff level (on the 0–100 RSI scale) above which the bottom heat-blocks turn green.
Histogram Max for Fade (default = 20)
The absolute difference (RSI – signal) that maps to 100% opacity in the histogram. Smaller differences fade out; larger ones stand out.
🚀 How to Use stockan
Identify Momentum Shifts
Watch for the green/red fill to flip—when the RSI line crosses above its signal, green fill indicates building bullish momentum; red indicates bearish pressure.
Sense Short-Term Trend with Mini-Regression Lines
The tiny sloping segments on both RSI and signal lines give an immediate visual cue: upward-tilted segments = short-term uptrend, downward = downtrend.
Gauge Strength with the Fade-Style Histogram
Opaque bars mean strong momentum divergence; faint bars mean weak or consolidating moves. Use these to avoid low-conviction signals.
Fine-Tune Entries & Exits Using Reversal Dots
Gray dots mark local RSI highs (possible short setups), green dots mark local lows (possible long entries).
Confirm Bias with the Heat-Bar
A steady green row at the bottom tells you RSI has been above your threshold consistently—ideal for trend-following. A red row suggests caution or counter-trend trades.
🎯 Benefits
All-in-One Pane: No need to juggle RSI, MA, histogram and custom script separately.
Clean Visuals: Soft fades and blocky heat bars reduce clutter and highlight what matters.
Non-Repainting: Uses only closed-bar data; once a bar is closed, nothing moves or disappears.
Highly Customizable: Every length, threshold, color and transparency can be adjusted in Settings.
Lightweight & Self-Contained: Pure Pine v5—no external libraries, no proprietary code—fully compliant with TradingView’s policies.

Scalping Singals [VM]Scalping Signals
Overview
The Scalping Signals is a Pine Script indicator designed for TradingView to provide precise buy and sell signals for scalping strategies. Created by Vlad_Mind (Telegram: @Dreamer528), this indicator combines multiple technical indicators (RSI, Stochastic, SMI, Bollinger Bands, and a Higher Timeframe Supertrend) with an EMA filter to identify high-probability entry points for short-term trades. It is optimized for fast-paced trading environments and includes a trend filter and trade cooldown to enhance signal reliability.
The indicator is tailored for the 5-minute timeframe, which is the recommended setting for optimal performance. Other settings are best left at their default values to maintain the indicator's intended behavior.
Features
Scalping-Focused Signals: Generates clear "Buy" and "Sell" labels for quick entry decisions on the 5-minute chart.
Multi-Indicator Confirmation:
RSI: Detects overbought (>70) and oversold (<30) conditions.
Stochastic Momentum Index (SMI): Confirms momentum with thresholds at +40 (overbought) and -40 (oversold).
Stochastic Oscillator: Identifies extreme price levels (<20 for buys, >80 for sells).
Bollinger Bands: Ensures price is outside the bands (below lower band for buys, above upper band for sells).
Higher Timeframe (HTF) Trend Filter: Uses a Supertrend indicator on a user-defined HTF (default: 60 minutes) to align trades with the broader trend.
EMA Filter: Optional filter (default: enabled) to ensure trades align with the trend relative to a 1000-period EMA.
Trade Cooldown: Prevents overtrading by enforcing a minimum time gap (default: 360 minutes) between signals.
Visual Elements:
Plots the HTF Supertrend and EMA for trend context.
Displays "Buy" (green) and "Sell" (red) labels directly on the chart.
How It Works
The indicator generates signals based on the following logic:
Buy Signal:
RSI < 30, SMI < -40, Stochastic < 20, and price below the lower Bollinger Band.
HTF Supertrend indicates an uptrend (if trend filter is enabled).
Price is above the EMA (if EMA filter is enabled).
Cooldown period since the last buy signal has expired.
Sell Signal:
RSI > 70, SMI > 40, Stochastic > 80, and price above the upper Bollinger Band.
HTF Supertrend indicates a downtrend (if trend filter is enabled).
Price is below the EMA (if EMA filter is enabled).
Cooldown period since the last sell signal has expired.
Signals are marked with labels ("Buy" or "Sell") at the respective candle's low or high, making them easy to spot.
Settings
Recommended Timeframe: 5 minutes (optimal for scalping).
Other Settings: Keep at default values for best results:
HTF Timeframe: 60 minutes.
HTF ATR Factor: 5.
HTF ATR Length: 10.
Trade Cooldown: 360 minutes.
Enable EMA Filter: True.
EMA Period: 1000.
Usage
Apply the Scalping Signals to a 5-minute chart on TradingView.
Leave all settings at their default values for optimal performance.
Look for "Buy" (green) and "Sell" (red) labels to identify entry points.
Use the plotted EMA and HTF Supertrend to confirm the broader trend context.
Combine with proper risk management and other technical analysis tools to validate trades.
Notes
The indicator is designed specifically for the 5-minute timeframe to capture short-term price movements.
The trade cooldown (default: 360 minutes) ensures signals are spaced out, reducing the risk of overtrading.
The HTF Supertrend and EMA filters enhance signal reliability by aligning trades with the broader market trend.
Contact Vlad_Mind (Telegram: @Dreamer528) for support or feedback.
Disclaimer
This indicator is provided for educational and informational purposes only. It does not constitute financial advice. Always conduct your own research and consult with a professional before making trading decisions.
Happy scalping!

Stockan Momentum MeterStockan Momentum Meter (SMM)
Advanced Momentum Acceleration Oscillator
Version: 1.0 | Category: Momentum Oscillator | Type: Open Source
Detailed Technical Specification
Key Features
Dual-Layer Momentum Calculation
Calculates momentum using double derivative of price (ROC of ROC)
First Layer: Standard Rate of Change (ROC)
Second Layer: Momentum of Momentum (ROC applied to first ROC)
Signal Smoothing System
EMA filtering of raw momentum values
Adaptive smoothing based on user-defined length
4-State Color Coding
Quadrant-based visualization system:
Strong Bullish (Green): Histogram > Threshold
Moderate Bullish (Blue): 0 < Histogram ≤ Threshold
Moderate Bearish (Orange): -Threshold ≤ Histogram < 0
Strong Bearish (Red): Histogram < -Threshold
Dynamic Threshold System
Adjustable baseline levels for sensitivity control
Symmetrical upper/lower boundaries
Detailed Working Mechanism
Calculation Pipeline
Raw Momentum (momo):
momo = ROC(ROC(close, length), length)
Measures acceleration/deceleration in price movements
Double derivation filters out noise while capturing momentum shifts
Smoothed Signal (ema_momo):
ema_momo = EMA(momo, length)
Creates reference line for momentum comparison
Reduces whipsaws in volatile markets
Histogram Value:
histogram = momo - ema_momo
Visualizes difference between raw and smoothed momentum
Positive values = accelerating momentum
Negative values = decelerating momentum
PARAMETER CONFIGURATION
Momentum Length (Default: 14)
Range: 1-100 | Controls historical window for momentum calculations
Base Line Threshold (Default: 0.0)
Range: 0-100 | Determines sensitivity for color changes
COLOR CODING SYSTEM
GREEN Signals:
Histogram value ABOVE threshold level = Strong bullish momentum
BLUE Signals:
Positive values BETWEEN 0 and threshold = Moderate bullish pressure
ORANGE Signals:
Negative values BETWEEN 0 and -threshold = Moderate bearish pressure
RED Signals:
Histogram value BELOW -threshold = Strong bearish momentum
Key Benefits for Traders
Early Reversal Detection
Identifies momentum exhaustion before price reversal occurs
Divergence Spotting
Clear visualization of:
Bullish divergence (Price ↓ + Histogram ↑)
Bearish divergence (Price ↑ + Histogram ↓)
Trend Strength Measurement
Histogram height indicates momentum intensity
Multi-Timeframe Compatibility
Works effectively on:
Scalping (1-15min)
Swing Trading (1H-4H)
Position Trading (Daily-Weekly)
Customizable Sensitivity
Adjust threshold levels for:
Day traders (higher threshold = fewer signals)
Long-term investors (lower threshold = more sensitivity)
Usage Scenarios
Bullish Signal
Green histogram crossing above threshold
Blue → Green color transition
Bearish Signal
Red histogram crossing below negative threshold
Orange → Red color transition
Confirmation Tool
Use with trend indicators (EMA, MACD):
Green histogram + Price above 200 EMA = Strong uptrend
Red histogram + Price below 200 EMA = Strong downtrend
KEY ADVANTAGES OVER POPULAR INDICATORS
Faster Signals vs RSI
Detects momentum shifts earlier through double ROC calculation
Clearer Visuals vs MACD
Four-color system replaces confusing line crossovers with instant visual cues
Better Filtering vs Stochastic
Dual-layer calculation reduces market noise more effectively
Custom Sensitivity
Adjustable threshold outperforms fixed settings in traditional oscillators
How to Use
Add to chart from TradingView Public Library
Default settings work for most timeframes
Adjust parameters based on:
Aggressive trading: Reduce length (10-12)
Conservative trading: Increase length (20-25)
Combine with:
Trendlines for breakout confirmation
Volume indicators for signal validation
Notes
Best Performance: Ranging markets with clear support/resistance
Risk Management: Use with stop-loss (2x ATR recommended)
Limitations: May give false signals during low-volume periods

Parsifal.Swing.TrendScoreThe Parsifal.Swing.TrendScore indicator is a module within the Parsifal Swing Suite, which includes a set of swing indicators such as:
• Parsifal Swing TrendScore
• Parsifal Swing Composite
• Parsifal Swing RSI
• Parsifal Swing Flow
Each module serves as an indicator facilitating judgment of the current swing state in the underlying market.
________________________________________
Background
Market movements typically follow a time-varying trend channel within which prices oscillate. These oscillations—or swings—within the trend are inherently tradable.
They can be approached:
• One-sidedly, aligning with the trend (generally safer), or
• Two-sidedly, aiming to profit from mean reversions as well.
Note: Mean reversions in strong trends often manifest as sideways consolidations, making one-sided trades more stable.
________________________________________
The Parsifal Swing Suite
The modules aim to provide additional insights into the swing state within a trend and offer various trigger points to assist with entry decisions.
All modules in the suite act as weak oscillators, meaning they fluctuate within a range but are not bounded like true oscillators (e.g., RSI, which is constrained between 0% and 100%).
________________________________________
The Parsifal.Swing.TrendScore – Specifics
The Parsifal.Swing.TrendScore module combines short-term trend data with information about the current swing state, derived from raw price data and classical technical indicators. It provides an indication of how well the short-term trend aligns with the prevailing swing, based on recent market behavior.
________________________________________
How Swing.TrendScore Works
The Swing.TrendScore calculates a swing score by collecting data within a bin (i.e., a single candle or time bucket) that signals an upside or downside swing. These signals are then aggregated together with insights from classical swing indicators.
Additionally, it calculates a short-term trend score using core technical signals, including:
• The Z-score of the price's distance from various EMAs
• The slope of EMAs
• Other trend-strength signals from additional technical indicators
These two components—the swing score and the trend score—are then combined to form the Swing.TrendScore indicator, which evaluates the short-term trend in context with swing behavior.
________________________________________
How to Interpret Swing.TrendScore
The trend component enhances Swing.TrendScore’s ability to provide stronger signals when the short-term trend and swing state align.
It can also override the swing score; for example, even if a mean reversion appears to be forming, a dominant short-term trend may still control the market behavior.
This makes Swing.TrendScore particularly valuable for:
• Short-term trend-following strategies
• Medium-term swing trading
Unlike typical swing indicators, Swing.TrendScore is designed to respond more to medium-term swings rather than short-lived fluctuations.
________________________________________
Behavior and Chart Representation
The Swing.TrendScore indicator fluctuates within a range, as most of its components are range-bound (though Z-score components may technically extend beyond).
• Historically high or low values may suggest overbought or oversold conditions
• The chart displays:
o A fast curve (orange)
o A slow curve (white)
o A shaded background representing the market state
• Extreme values followed by curve reversals may signal a developing mean reversion
________________________________________
TrendScore Background Value
The Background Value reflects the combined state of the short-term trend and swing:
• > 0 (shaded green) → Bullish mode: swing and short-term trend both upward
• < 0 (shaded red) → Bearish mode: swing and short-term trend both downward
• The absolute value represents the confidence level in the market mode
Notably, the Background Value can remain positive during short downswings if the short-term trend remains bullish—and vice versa.
________________________________________
How to Use the Parsifal.Swing.TrendScore
Several change points can act as entry triggers or aids:
• Fast Trigger: change in slope of the fast signal curve
• Trigger: fast line crosses slow line or the slope of the slow signal changes
• Slow Trigger: change in sign of the Background Value
Examples of these trigger points are illustrated in the accompanying chart.
Additionally, market highs and lows aligning with the swing indicator values may serve as pivot points in the evolving price process.
________________________________________
As always, this indicator should be used in conjunction with other tools and market context in live trading.
While it provides valuable insight and potential entry points, it does not predict future price action.
Instead, it reflects recent tendencies and should be used judiciously.
________________________________________
Extensions
The aggregation of information—whether derived from bins or technical indicators—is currently performed via simple averaging. However, this can be modified using alternative weighting schemes, based on:
• Historical performance
• Relevance of the data
• Specific market conditions
Smoothing periods used in calculations are also modifiable. In general, the EMAs applied for smoothing can be extended to reflect expectations based on relevance-weighted probability measures.
Since EMAs inherently give more weight to recent data, this allows for adaptive smoothing.
Additionally, EMAs may be further extended to incorporate negative weights, akin to wavelet transform techniques.

分层 + 手动分位 StochRSI(红蓝点版)用 getPercentile() 手动对数组排序取分位,避免引用不存在的 API。
ATR 数组 atrArr 定期 push/shift,实时分层。
对应波动层分别维护 lowArr/midArr/highArr,计算 osLine/obLine。
用两条 plot(..., style=plot.style_circles),掩码表达式 buySig ? osLine : na 与 sellSig ? obLine : na,只在穿越当根 K 线上画蓝/红圆点,且精准落在阈值线上。

Demo GPT - Bullish RSI + Stoch Signals//@version=6
indicator(title="Demo GPT - Bullish RSI + Stoch Signals", shorttitle="Bullish RSI Stoch", overlay=true)
// Select Timeframe (5m or 15m)
tf = input.timeframe("5", title="Select Timeframe (5m/15m)")
// Input parameters
lengthRSI = input.int(14, "RSI Length", minval=1)
lengthStoch = input.int(14, "Stochastic Length", minval=1)
smoothK = input.int(3, "Stoch %K Smoothing", minval=1)
smoothD = input.int(3, "Stoch %D Smoothing", minval=1)
// Calculate RSI & Stochastic in the selected timeframe
rsiValue = request.security(syminfo.tickerid, tf, ta.rsi(close, lengthRSI))
stochK = request.security(syminfo.tickerid, tf, ta.sma(ta.stoch(rsiValue, rsiValue, rsiValue, lengthStoch), smoothK))
stochD = request.security(syminfo.tickerid, tf, ta.sma(stochK, smoothD))
// Bullish Buy Condition
bullishBuy = ta.crossover(stochK, 20) and rsiValue < 50 and stochK > stochD
// Bullish Exit Condition
bullishExit = ta.crossunder(stochK, 80) and stochK < stochD
// Plot Buy Signals
plotshape(series=bullishBuy, title="Bullish Buy", location=location.belowbar, color=color.green, style=shape.labelup, text="BUY", size=size.small)
// Plot Exit Signals
plotshape(series=bullishExit, title="Bullish Exit", location=location.abovebar, color=color.red, style=shape.labeldown, text="EXIT", size=size.small)
// Background Highlighting in Bullish Zones (Fixed Transparency)
bgcolor(bullishBuy ? color.new(color.green, 85) : na)
// Alerts
alertcondition(bullishBuy, title="Bullish Buy Alert", message="Bullish RSI + Stoch Buy Signal")
alertcondition(bullishExit, title="Bullish Exit Alert", message="Bullish RSI + Stoch Exit Signal")

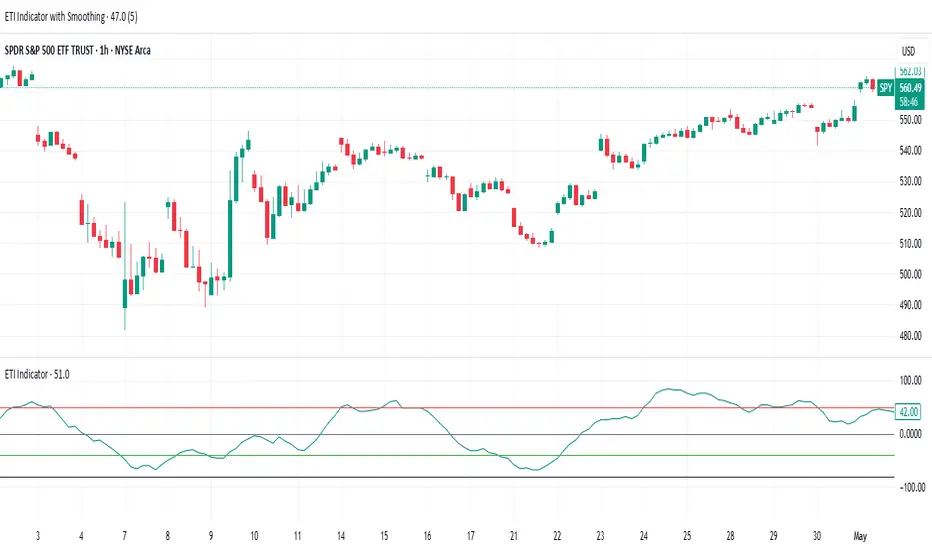
ETI IndicatorThe Ensemble Technical Indicator (ETI) is a script that combines multiple established indicators into one single powerful indicator. Specifically, it takes a number of technical indicators and then converts them into +1 to represent a bullish trend, or a -1 to represent a bearish trend. It then adds these values together and takes the running sum over the past 20 days.
The ETI is composed of the following indicators and converted to +1 or -1 using the following criteria:
Simple Moving Average (10 days) : When the price is above the 10-day simple moving averaging, +1, when below -1
Weighted Moving Average (10 days) : Similar to the SMA 10, when the the price is above the 10-day weighted moving average, +1, when below -1
Stochastic K% : If the current Stochastic K% is greater than the previous value, then +1, else -1.
Stochastic D% : Similar to the Stochastic K%, when the current Stochastic D% is greater than the previous value, +1, else -1.
MACD Difference : First subtract the MACD signal (i.e. the moving average) from the MACD value and if the current value is higher than the previous value, then +1, else -1.
William's R% : If the current William's R% is greater than the previous one, then +1, else -1.
William's Accumulation/Distribution : If the current William's AD value is greater than the previous value, then +1, else -1.
Commodity Channel Index : If the Commodity Channel Index is greater than 200 (overbought), then -1, if it is less than -200 (oversold) then +1. When it is between those values, if the current value is greater than the previous value then +1, else -1.
Relative Strength Index : If the Relative Strength Index is over 70 (overbought) then -1 and if under 30 (oversold) then +1. If the Relative Strength Indicator is between those values then if the current value is higher than the previous value +1, else -1.
Momentum (9 days) : If the momentum value is greater than 0, then +1, else -1.
Again, once these values have been calculated and converted, they are added up to produce a single value. This single value is then summed across the previous 20 candles to produce a running sum.
By coalescing multiple technical indicators into a single value across time, traders can better understand how multiple inter-related indicators are behaving at once; high scores indicate that numerous indicators are showing bullish signals indicating a potential or ongoing uptrend (and vice-versa with low scores).
Additional Features
Numerous smoothing transformations have also been added (e.g. gaussian smoothing) to remove some of the noise might exist.
Suggested Use
It is recommended that stocks are shorted when the cross below 0, and are bought when the ETI crosses above -40. Arrows can be shown on the indicator to show these points. However feel free to use levels that work best for you.
Traditionally, I have treated values above +50 as overbought and below -40 as undersold (with -80 indicating extremely oversold); however these levels could also indicate either upwards and downwards momentum so taking a position based on where the ETI is (rather than crossing levels) should be done with caution.
Multi RSI (3,7,14,21,50)Multi time frame RSI. Helps figure out the overall market on multi time frames.

Fire Sling Shot Stochastic// ============================================================================
// Stochastic Indicator (5,3,3) Explanation
// ============================================================================
//
// The Fire Sling Shot strategy uses a Stochastic oscillator (5,3,3) as a
// confirming indicator to enhance the reliability of EMA crossover signals.
//
// WHAT IS STOCHASTIC?
// The Stochastic oscillator is a momentum indicator that compares a security's
// closing price to its price range over a specific period. The indicator
// oscillates between 0 and 100, with readings above 80 considered overbought
// and readings below 20 considered oversold.
//
// SETTINGS USED:
// - %K Period: 5 (faster sensitivity to price movements)
// - %D Period: 3 (smoothing of %K)
// - Smoothing: 3 (additional smoothing applied to the %K line)
// - Overbought Level: 80
// - Oversold Level: 20
//
// HOW IT'S USED IN THIS STRATEGY:
//
// 1. Bull Signal Enhancement:
// When the 15 EMA crosses above the 50 EMA (primary signal), we check
// if the Stochastic is below 20 or has just crossed above 20. This suggests
// momentum is starting to turn upward from an oversold condition, improving
// the quality of the long entry.
//
// 2. Bear Signal Enhancement:
// When the 15 EMA crosses below the 50 EMA (primary signal), we check
// if the Stochastic is above 80 or has just crossed below 80. This suggests
// momentum is starting to turn downward from an overbought condition,
// improving the quality of the short entry.
//
// 3. Early Warning:
// Stochastic movements below 20 or above 80 can provide early warning of
// potential EMA crossovers, allowing traders to prepare for possible entry
// signals.
//
// The Stochastic filter is optional and can be enabled/disabled through the
// strategy inputs. When disabled, the strategy relies solely on EMA crossovers
// for entry signals.
//
// NOTE: While Stochastic can improve signal quality, no indicator is perfect.
// False signals can occur, especially in ranging or choppy markets. Always
// combine with proper risk management and consider the overall market context.
//
// ============================================================================

Parsifal.Swing.FlowThe Parsifal.Swing.Flow indicator is a module within the Parsifal Swing Suite, which includes a set of swing indicators such as:
• Parsifal Swing TrendScore
• Parsifal Swing Composite
• Parsifal Swing RSI
• Parsifal Swing Flow
Each module serves as an indicator facilitating judgment of the current swing state in the underlying market.
________________________________________
Background
Market movements typically follow a time-varying trend channel within which prices oscillate. These oscillations—or swings—within the trend are inherently tradable.
They can be approached:
• One-sidedly, aligning with the trend (generally safer), or
• Two-sidedly, aiming to profit from mean reversions as well.
Note: Mean reversions in strong trends often manifest as sideways consolidations, making one-sided trades more stable.
________________________________________
The Parsifal Swing Suite
The modules aim to provide additional insights into the swing state within a trend and offer various trigger points to assist with entry decisions.
All modules in the suite act as weak oscillators, meaning they fluctuate within a range but are not bounded like true oscillators (e.g., RSI, which is constrained between 0% and 100%).
________________________________________
The Parsifal.Swing.Flow – Specifics
The Parsifal.Swing.Flow module aggregates price and trading flow data per bin (a "bin" refers to a single candle or time bucket) and smooths this information over recent historical data to reflect ongoing market dynamics.
________________________________________
How Swing.Flow Works
For each bin, individual data points—called "bin-infolets"—are collected. Each infolet reflects the degree and direction of trading flow, offering insight into buying and selling pressure.
The module processes this data in two steps:
1. Aggregation:
All bin-infolet values within a bin are averaged to produce a single bin-flow value.
2. Smoothing:
The resulting bin-flow values are then smoothed across multiple bins, typically using short-term EMAs.
The outcome is a dynamic representation of the current swing state based on recent trading flow activity.
________________________________________
How to Interpret Swing.Flow
• Range-bound but not a true oscillator:
While individual bin-infolets are range-bound, the Swing.Flow indicator itself is not a classical oscillator.
• Overbought/Oversold Signals:
Historically high or low values in Swing.Flow may signal overbought or oversold conditions.
• Chart Representation:
o A fast curve (orange)
o A slow curve (white)
o A shaded background that illustrates overall market state
• Mean Reversion Signals:
Extreme curve values followed by reversals may indicate the onset of a mean reversion in price.
________________________________________
Flow Background Value
The Flow Background Value represents the net state of trading flow:
• > 0 (green shading) → Bullish mode
• < 0 (red shading) → Bearish mode
• The absolute value reflects the confidence level in the current trend direction
________________________________________
How to Use the Parsifal.Swing.Flow
Several change points can act as entry point triggers:
• Fast Trigger:
A change in the slope of the fast signal curve
• Trigger:
The fast line crossing the slow line or a change in the slope of the slow signal
• Slow Trigger:
A change in the sign of the Background Value
These triggers are visualized in the accompanying chart.
Additionally, market highs and lows that align with the swing indicator values can serve as pivot points for the ongoing price process.
________________________________________
As always, this indicator is best used in conjunction with other indicators and market information.
While Parsifal.Swing.Flow offers valuable insight and potential entry points, it does not predict future price action.
Rather, it reflects the most recent market tendencies, and should therefore be applied with discretion.
________________________________________
Extensions
• Aggregation Method:
The current approach—averaging all infolets—can be replaced by alternative weighting schemes, adjusted according to:
o Historical performance
o Relevance of data
o Specific market conditions
• Smoothing Period:
The EMA-based smoothing period can be varied. In general, EMAs can be enhanced to reflect relevance-weighted probability measures, giving greater importance to recent data for a more adaptive and dynamic response.
• Advanced Smoothing:
EMAs can be further extended to include negative weights, similar to wavelet transform techniques, allowing even greater flexibility in smoothing methodologies.

Parsifal.Swing.RSIThe Parsifal.Swing.RSI indicator is a module within the Parsifal Swing Suite, which includes a set of swing indicators:
• Parsifal Swing TrendScore
• Parsifal Swing Composite
• Parsifal Swing RSI
• Parsifal Swing Flow
Each module facilitates judgment of the current swing state in the underlying market.
________________________________________
Background
Market movements typically follow a time-varying trend channel within which prices oscillate. These swings within the trend are inherently tradable.
They can be approached:
• One-sidedly, in alignment with the trend (generally safer), or
• Two-sidedly, aiming to profit from mean reversions.
Note: In strong trends, mean reversions often appear as sideways consolidations, making one-sided trades more robust.
________________________________________
The Parsifal Swing Suite
The suite provides insights into current swing states and offers various entry point triggers.
All modules act as weak oscillators, meaning they fluctuate within a range but are not bounded like true oscillators (e.g., the RSI, which ranges from 0 to 100%).
________________________________________
The Parsifal.Swing.RSI – Specifics
The Parsifal.Swing.RSI is the simplest module in the suite. It uses variations of the classical RSI, explicitly combining:
• RSI: 14-period RSI of the market
• RSIMA: 14-period EMA of the RSI
• RSI21: 14-period RSI of the 21-period EMA of the market
• RSI21MA: 14-period EMA of RSI21
Component Behavior:
• RSI: Measures overbought/oversold levels but reacts very sensitively to price changes.
• RSIMA: Offers smoother directional signals, making it better for assessing swing continuation. Its slope and sign changes are more reliable indicators than pure RSI readings.
• RSI21: Based on smoothed prices. In strong trends, it reaches higher levels and reacts more smoothly than RSI.
• RSI21MA: Further smooths RSI21, serving as a medium-term swing estimator and a signal line for RSI21.
When RSI21 exceeds RSI, it indicates trend strength.
• In uptrends, RSI21 > RSI, with larger exceedance = stronger trend
• In downtrends, the reverse holds
________________________________________
Indicator Construction
The Swing RSI combines:
• RSI and RSIMA → short-term swings
• RSI21 and RSI21MA → medium-term swings
This results in:
• A fast swing curve, derived from RSI and RSI21
• A slow swing curve, derived from RSIMA and RSI21MA
This setup is smoother than RSI/RSIMA alone but more responsive than using RSI21/RSI21MA alone.
________________________________________
Background Value
The Background Value reflects the overall market state, derived from RSI21:
• > 0: shaded green → bullish mode
• < 0: shaded red → bearish mode
• The absolute value reflects confidence in the current mode
________________________________________
How to Use the Parsifal.Swing.RSI
Several change points can act as entry triggers:
• Fast Trigger: change in slope of the fast signal curve
• Trigger: fast line crossing slow line or change in slow signal's slope
• Slow Trigger: change in sign of the Background Value
Examples of these triggers are shown in the chart.
Additionally, market highs and lows aligned with swing values can serve as pivot points in evolving price movements.
________________________________________
As always, this indicator should be used alongside other tools and information in live trading.
While it provides valuable insights and potential entry points, it does not predict future price action.
It reflects the latest tendencies and should be used judiciously.

RSI + RSI MA + Choppiness IndexThe indicator is an extension of the Chopiness & RSI Index but takes it one step further by adding the RSI based MA .
Strong uptrend occurs when the RSI is at least 15% above the RSI based MA and the choppiness index value is below the RSI based MA.
Strong downtrend occurs when the Choppiness index line is at least 15% above the RSI based MA and the RSI is below the RSI based MA.
When both the RSI and Chopiness index are above the RSI based MA, this can mean either an uptrend or approaching downtrend.
When both the RSI and Chopiness index are below the RSI based MA, this can mean either an downtrend or approaching uptrend.
*Use at own risk.

Adaptive RSI | Lyro RSThe Adaptive RSI | 𝓛𝔂𝓻𝓸 𝓡𝓢 indicator enhances the traditional Relative Strength Index (RSI) by integrating adaptive smoothing techniques and dynamic bands. This design aims to provide traders with a nuanced view of market momentum, highlighting potential trend shifts and overbought or oversold conditions.
Key Features
Adaptive RSI Calculation: Combines fast and slow Exponential Moving Averages (EMAs) of the RSI to capture momentum shifts effectively.
Dynamic Bands: Utilizes a smoothed standard deviation approach to create upper and lower bands around the adaptive RSI, aiding in identifying extreme market conditions.
Signal Line: An additional EMA of the adaptive RSI serves as a signal line, assisting in confirming trend directions.
Customizable Color Schemes: Offers multiple predefined color palettes, including "Classic," "Mystic," "Accented," and "Royal," with an option for users to define custom colors for bullish and bearish signals.
How It Works
Adaptive RSI Computation: Calculates the difference between fast and slow EMAs of the RSI, producing a responsive oscillator that adapts to market momentum.
Band Formation: Applies a smoothing factor to the standard deviation of the adaptive RSI, generating dynamic upper and lower bands that adjust to market volatility.
Signal Line Generation: Computes an EMA of the adaptive RSI to act as a signal line, providing additional confirmation for potential entries or exits.
Visualization: Plots the adaptive RSI as color-coded columns, with colors indicating bullish or bearish momentum. The dynamic bands are filled to visually represent overbought and oversold zones.
How to Use
Identify Momentum Shifts: Observe crossovers between the adaptive RSI and the signal line to detect potential changes in trend direction.
Spot Overbought/Oversold Conditions: Monitor when the adaptive RSI approaches or breaches the dynamic bands, signaling possible market extremes.
Customize Visuals: Select from predefined color palettes or define custom colors to align the indicator's appearance with personal preferences or chart themes.
Customization Options
RSI and EMA Lengths: Adjust the lengths of the RSI, fast EMA, slow EMA, and signal EMA to fine-tune the indicator's sensitivity.
Band Settings: Modify the band length, multiplier, and smoothing factor to control the responsiveness and width of the dynamic bands.
Color Schemes: Choose from predefined color modes or enable custom color settings to personalize the indicator's appearance.
⚠️ DISCLAIMER ⚠️: This indicator alone is not reliable and should be combined with other indicator(s) for a stronger signal.
ADX Forecast [Titans_Invest]ADX Forecast
This isn’t just another ADX indicator — it’s the most powerful and complete ADX tool ever created, and without question the best ADX indicator on TradingView, possibly even the best in the world.
ADX Forecast represents a revolutionary leap in trend strength analysis, blending the timeless principles of the classic ADX with cutting-edge predictive modeling. For the first time on TradingView, you can anticipate future ADX movements using scientifically validated linear regression — a true game-changer for traders looking to stay ahead of trend shifts.
1. Real-Time ADX Forecasting
By applying least squares linear regression, ADX Forecast projects the future trajectory of the ADX with exceptional accuracy. This forecasting power enables traders to anticipate changes in trend strength before they fully unfold — a vital edge in fast-moving markets.
2. Unmatched Customization & Precision
With 26 long entry conditions and 26 short entry conditions, this indicator accounts for every possible ADX scenario. Every parameter is fully customizable, making it adaptable to any trading strategy — from scalping to swing trading to long-term investing.
3. Transparency & Advanced Visualization
Visualize internal ADX dynamics in real time with interactive tags, smart flags, and fully adjustable threshold levels. Every signal is transparent, logic-based, and engineered to fit seamlessly into professional-grade trading systems.
4. Scientific Foundation, Elite Execution
Grounded in statistical precision and machine learning principles, ADX Forecast upgrades the classic ADX from a reactive lagging tool into a forward-looking trend prediction engine. This isn’t just an indicator — it’s a scientific evolution in trend analysis.
⯁ SCIENTIFIC BASIS LINEAR REGRESSION
Linear Regression is a fundamental method of statistics and machine learning, used to model the relationship between a dependent variable y and one or more independent variables 𝑥.
The general formula for a simple linear regression is given by:
y = β₀ + β₁x + ε
β₁ = Σ((xᵢ - x̄)(yᵢ - ȳ)) / Σ((xᵢ - x̄)²)
β₀ = ȳ - β₁x̄
Where:
y = is the predicted variable (e.g. future value of RSI)
x = is the explanatory variable (e.g. time or bar index)
β0 = is the intercept (value of 𝑦 when 𝑥 = 0)
𝛽1 = is the slope of the line (rate of change)
ε = is the random error term
The goal is to estimate the coefficients 𝛽0 and 𝛽1 so as to minimize the sum of the squared errors — the so-called Random Error Method Least Squares.
⯁ LEAST SQUARES ESTIMATION
To minimize the error between predicted and observed values, we use the following formulas:
β₁ = /
β₀ = ȳ - β₁x̄
Where:
∑ = sum
x̄ = mean of x
ȳ = mean of y
x_i, y_i = individual values of the variables.
Where:
x_i and y_i are the means of the independent and dependent variables, respectively.
i ranges from 1 to n, the number of observations.
These equations guarantee the best linear unbiased estimator, according to the Gauss-Markov theorem, assuming homoscedasticity and linearity.
⯁ LINEAR REGRESSION IN MACHINE LEARNING
Linear regression is one of the cornerstones of supervised learning. Its simplicity and ability to generate accurate quantitative predictions make it essential in AI systems, predictive algorithms, time series analysis, and automated trading strategies.
By applying this model to the ADX, you are literally putting artificial intelligence at the heart of a classic indicator, bringing a new dimension to technical analysis.
⯁ VISUAL INTERPRETATION
Imagine an ADX time series like this:
Time →
ADX →
The regression line will smooth these values and extend them n periods into the future, creating a predicted trajectory based on the historical moment. This line becomes the predicted ADX, which can be crossed with the actual ADX to generate more intelligent signals.
⯁ SUMMARY OF SCIENTIFIC CONCEPTS USED
Linear Regression Models the relationship between variables using a straight line.
Least Squares Minimizes the sum of squared errors between prediction and reality.
Time Series Forecasting Estimates future values based on historical data.
Supervised Learning Trains models to predict outputs from known inputs.
Statistical Smoothing Reduces noise and reveals underlying trends.
⯁ WHY THIS INDICATOR IS REVOLUTIONARY
Scientifically-based: Based on statistical theory and mathematical inference.
Unprecedented: First public ADX with least squares predictive modeling.
Intelligent: Built with machine learning logic.
Practical: Generates forward-thinking signals.
Customizable: Flexible for any trading strategy.
⯁ CONCLUSION
By combining ADX with linear regression, this indicator allows a trader to predict market momentum, not just follow it.
ADX Forecast is not just an indicator — it is a scientific breakthrough in technical analysis technology.
⯁ Example of simple linear regression, which has one independent variable:
⯁ In linear regression, observations ( red ) are considered to be the result of random deviations ( green ) from an underlying relationship ( blue ) between a dependent variable ( y ) and an independent variable ( x ).
⯁ Visualizing heteroscedasticity in a scatterplot against 100 random fitted values using Matlab:
⯁ The data sets in the Anscombe's quartet are designed to have approximately the same linear regression line (as well as nearly identical means, standard deviations, and correlations) but are graphically very different. This illustrates the pitfalls of relying solely on a fitted model to understand the relationship between variables.
⯁ The result of fitting a set of data points with a quadratic function:
_______________________________________________________________________
🥇 This is the world’s first ADX indicator with: Linear Regression for Forecasting 🥇_______________________________________________________________________
_________________________________________________
🔮 Linear Regression: PineScript Technical Parameters 🔮
_________________________________________________
Forecast Types:
• Flat: Assumes prices will remain the same.
• Linreg: Makes a 'Linear Regression' forecast for n periods.
Technical Information:
ta.linreg (built-in function)
Linear regression curve. A line that best fits the specified prices over a user-defined time period. It is calculated using the least squares method. The result of this function is calculated using the formula: linreg = intercept + slope * (length - 1 - offset), where intercept and slope are the values calculated using the least squares method on the source series.
Syntax:
• Function: ta.linreg()
Parameters:
• source: Source price series.
• length: Number of bars (period).
• offset: Offset.
• return: Linear regression curve.
This function has been cleverly applied to the RSI, making it capable of projecting future values based on past statistical trends.
______________________________________________________
______________________________________________________
⯁ WHAT IS THE ADX❓
The Average Directional Index (ADX) is a technical analysis indicator developed by J. Welles Wilder. It measures the strength of a trend in a market, regardless of whether the trend is up or down.
The ADX is an integral part of the Directional Movement System, which also includes the Plus Directional Indicator (+DI) and the Minus Directional Indicator (-DI). By combining these components, the ADX provides a comprehensive view of market trend strength.
⯁ HOW TO USE THE ADX❓
The ADX is calculated based on the moving average of the price range expansion over a specified period (usually 14 periods). It is plotted on a scale from 0 to 100 and has three main zones:
• Strong Trend: When the ADX is above 25, indicating a strong trend.
• Weak Trend: When the ADX is below 20, indicating a weak or non-existent trend.
• Neutral Zone: Between 20 and 25, where the trend strength is unclear.
______________________________________________________
______________________________________________________
⯁ ENTRY CONDITIONS
The conditions below are fully flexible and allow for complete customization of the signal.
______________________________________________________
______________________________________________________
🔹 CONDITIONS TO BUY 📈
______________________________________________________
• Signal Validity: The signal will remain valid for X bars .
• Signal Sequence: Configurable as AND or OR .
🔹 +DI > -DI
🔹 +DI < -DI
🔹 +DI > ADX
🔹 +DI < ADX
🔹 -DI > ADX
🔹 -DI < ADX
🔹 ADX > Threshold
🔹 ADX < Threshold
🔹 +DI > Threshold
🔹 +DI < Threshold
🔹 -DI > Threshold
🔹 -DI < Threshold
🔹 +DI (Crossover) -DI
🔹 +DI (Crossunder) -DI
🔹 +DI (Crossover) ADX
🔹 +DI (Crossunder) ADX
🔹 +DI (Crossover) Threshold
🔹 +DI (Crossunder) Threshold
🔹 -DI (Crossover) ADX
🔹 -DI (Crossunder) ADX
🔹 -DI (Crossover) Threshold
🔹 -DI (Crossunder) Threshold
🔮 +DI (Crossover) -DI Forecast
🔮 +DI (Crossunder) -DI Forecast
🔮 ADX (Crossover) +DI Forecast
🔮 ADX (Crossunder) +DI Forecast
______________________________________________________
______________________________________________________
🔸 CONDITIONS TO SELL 📉
______________________________________________________
• Signal Validity: The signal will remain valid for X bars .
• Signal Sequence: Configurable as AND or OR .
🔸 +DI > -DI
🔸 +DI < -DI
🔸 +DI > ADX
🔸 +DI < ADX
🔸 -DI > ADX
🔸 -DI < ADX
🔸 ADX > Threshold
🔸 ADX < Threshold
🔸 +DI > Threshold
🔸 +DI < Threshold
🔸 -DI > Threshold
🔸 -DI < Threshold
🔸 +DI (Crossover) -DI
🔸 +DI (Crossunder) -DI
🔸 +DI (Crossover) ADX
🔸 +DI (Crossunder) ADX
🔸 +DI (Crossover) Threshold
🔸 +DI (Crossunder) Threshold
🔸 -DI (Crossover) ADX
🔸 -DI (Crossunder) ADX
🔸 -DI (Crossover) Threshold
🔸 -DI (Crossunder) Threshold
🔮 +DI (Crossover) -DI Forecast
🔮 +DI (Crossunder) -DI Forecast
🔮 ADX (Crossover) +DI Forecast
🔮 ADX (Crossunder) +DI Forecast
______________________________________________________
______________________________________________________
🤖 AUTOMATION 🤖
• You can automate the BUY and SELL signals of this indicator.
______________________________________________________
______________________________________________________
⯁ UNIQUE FEATURES
______________________________________________________
Linear Regression: (Forecast)
Signal Validity: The signal will remain valid for X bars
Signal Sequence: Configurable as AND/OR
Condition Table: BUY/SELL
Condition Labels: BUY/SELL
Plot Labels in the Graph Above: BUY/SELL
Automate and Monitor Signals/Alerts: BUY/SELL
Linear Regression (Forecast)
Signal Validity: The signal will remain valid for X bars
Signal Sequence: Configurable as AND/OR
Table of Conditions: BUY/SELL
Conditions Label: BUY/SELL
Plot Labels in the graph above: BUY/SELL
Automate & Monitor Signals/Alerts: BUY/SELL
______________________________________________________
📜 SCRIPT : ADX Forecast
🎴 Art by : @Titans_Invest & @DiFlip
👨💻 Dev by : @Titans_Invest & @DiFlip
🎑 Titans Invest — The Wizards Without Gloves 🧤
✨ Enjoy!
______________________________________________________
o Mission 🗺
• Inspire Traders to manifest Magic in the Market.
o Vision 𐓏
• To elevate collective Energy 𐓷𐓏

Dskyz (DAFE) GENESIS Dskyz (DAFE) GENESIS: Adaptive Quant, Real Regime Power
Let’s be honest: Most published strategies on TradingView look nearly identical—copy-paste “open-source quant,” generic “adaptive” buzzwords, the same shallow explanations. I’ve even fallen into this trap with my own previously posted strategies. Not this time.
What Makes This Unique
GENESIS is not a black-box mashup or a pre-built template. It’s the culmination of DAFE’s own adaptive, multi-factor, regime-aware quant engine—built to outperform, survive, and visualize live edge in anything from NQ/MNQ to stocks and crypto.
True multi-factor core: Volume/price imbalances, trend shifts, volatility compression/expansion, and RSI all interlock for signal creation.
Adaptive regime logic: Trades only in healthy, actionable conditions—no “one-size-fits-all” signals.
Momentum normalization: Uses rolling, percentile-based fast/slow EMA differentials, ALWAYS normalized, ALWAYS relevant—no “is it working?” ambiguity.
Position sizing that adapts: Not fixed-lot, not naive—not a loophole for revenge trading.
No hidden DCA or pyramiding—what you see is what you trade.
Dashboard and visual system: Directly connected to internal logic. If it’s shown, it’s used—and nothing cosmetic is presented on your chart that isn’t quantifiable.
Inputs and What They Mean (Read Carefully)
📊 Main Signal Inputs
Maximum Raw Score: How many distinct factors can contribute to regime/trade confidence (default 4). If you extend the quant logic, increase this.
RSI Length / Min RSI for Shorts / Max RSI for Longs: Fine-tunes how “overbought/oversold” matters; increase the length for smoother swings, tighten floors/ceilings for more extreme signals.
⚡ Regime & Momentum Gates
Min Normed Momentum/Score (Conf): Raise to demand only the strongest trends—your filter to avoid algorithmic chop.
🕒 Volatility & Session
ATR Lookback, ATR Low/High Percentile: These control your system’s awareness of when the market is dead or ultra-volatile. All sizing and filter logic adapts in real time.
Trading Session (hours): Easy filter for when entries are allowed; default is regular trading hours—no surprise overnight fills.
📊 Sizing & Risk
Max Dollar Risk / Base-Max Contracts: All sizing is adaptive, based on live regime and volatility state—never static or “just 1 contract.” Control your max exposures and real $ risk.
🔄 Exits & Scaling
Stop/Trail/Scale multipliers: You choose how dynamic/flexible risk controls and profit-taking need to be. ATR-based, so everything auto-adjusts to the current market mode.
Visuals That Actually Matter
Dashboard (Top Right): Shows only live, relevant stats: scoring, status, position size, win %, win streak, total wins—all from actual trade engine state (not “simulated”).
Watermark (Bottom Right): Momentum bar visual is always-on, regime-aware, reflecting live regime confidence and momentum normalization. If the bar is empty, you’re truly in no-momentum. If it glows lime, you’re riding the strongest possible edge.
*No cosmetics, no hidden code distractions.
Why It Wins
While others put out “AI-powered” strategies with little logic or soul, GENESIS is ruthlessly practical. It is built around what keeps traders alive:
- Context-aware signals, not just patterns
- Tight, transparent risk
- Inputs that adapt, not confuse
- Visuals that clarify, not distract
- Code that runs clean, efficient, and with minimal overfitting risk (try it on QQQ, AMD, SOL, etc. out of the box)
Disclaimer (for TradingView compliance):
Trading is risky. Futures, stocks, and crypto can result in significant losses. Do not trade with funds you cannot afford to lose. This is for educational and informational purposes only. Use in simulation/backtest mode before live trading. No past performance is indicative of future results. Always understand your risk and ownership of your trades.
Personal Note to Mods and Traders:
Yes, this statement is DIFFERENT, because this script IS different. If you see this taken down for some technicality (charting labels etc.), know I will fix, adapt, and repost until the system and its truth are visible to the community.
This will not be my last—my goal is to keep raising the bar until DAFE is a brand or I’m forced to take this private.
Use with discipline, use with clarity, and always trade smarter.
— Dskyz, powered by DAFE Trading Systems.

WaveFunction MACD (TechnoBlooms)WaveFunction MACD — The Next Generation of Market Momentum
WaveFunction MACD is an advanced hybrid momentum indicator that merges:
• The classical MACD crossover logic (based on moving averages)
• Wave physics (modeled through phase energy and cosine functions)
• Hilbert Transform theory from signal processing
• The concept of a wavefunction from quantum mechanics, where price action is seen as a probabilistic energy wave—not just a trend.
✨ Key Features of WaveFunction MACD
• Wave Energy Logic : Instead of using just price and MA differences, this indicator computes phase-corrected momentum using the cosine of the wave phase angle — revealing the true energy behind market moves.
• Phase-Based Trend Detection : It reads cycle phases using Hilbert Transform-like logic, allowing you to spot momentum before it becomes visible in price.
• Ultra-Smooth Flow : The main line and histogram are built to follow price flow smoothly — eliminating much of the noise found in traditional MACD indicators.
• Signal Amplification via Energy Histogram : The histogram doesn’t just show momentum changes — it shows the intensity of wave energy, allowing you to confirm the strength of the trend.
• Physics-Driven Structure : The algorithm is rooted in real-world wave mechanics, bringing a scientific edge to trading — ideal for traders who believe in natural models like cycles and harmonics.
• Trend Confirmation & Early Reversals : It can confirm strong trends and also catch subtle shifts that often precede big reversals — giving you both reliability and anticipation.
• Ready for Fusion : Designed to work seamlessly with liquidity zones, price action, order blocks, and structure trading — a perfect fit for modern trading systems.
🧪 The Science Behind It
This tool blends:
• Hilbert Transform: Measures the phase of a waveform (price cycle) to detect turning points
• Cosine Phase Energy: Calculates true wave energy using the cosine of the phase angle, revealing the strength behind price movements
• Quantum Modeling: Views price like a wavefunction, offering predictive insight based on phase dynamics

Directional Movement Index (DMI) + AlertsThis is a Study with associated visual indicators and Bullish/Bearish Alerts for Directional Movement (DMI). It consists of an Average Directional Index (ADX), Plus Directional Indicator (+DI) and Minus Directional Indicator (-DI).
Published by J. Welles Wilder in 1978 for use with currencies and commodities which are typically more volatile than stocks and have stronger trends.
Development Notes
---------------------------
This indicator, and most of the descriptions below, were derived largely from the TradingView reference manual. Feedback and suggestions for improvement are more than welcome, as well are recommended Input settings and best practices for use.
tradingview.com/chart/?solution=43000502250
Strategy Description
---------------------------
ADX defines whether or not there is a trend present; +DI and -DI compliment the ADX by taking direction into account. An ADX above 25 indicates a strong trend, and a Bullish alert is subsequently triggered when +DI is above -DI and a Bearish alert when -DI is above +DI.
Note that the Bullish or Bearish crossover alert will only trigger if ADX is simultaneously above 25 during the crossover event. If ADX later rises to 25 and +DI is still greater than -DI, or -DI greater than +DI, then a delayed alert will not trigger by design.
Basic Use
---------------------------
Acceptable DMI values are up to the trader's interpretation and may change depending on the financial instrument being examined. Recommend not changing any default values without being first familiar with their purpose and impact on the indicator at large.
Confidence in price action and trend is higher when two or more indicators are in agreement -- therefore we recommend not using this indicator by itself to determine entry or exit trade opportunities.
Recommend also choosing 'Once Per Bar Close' when creating alerts.
Inputs
---------------------------
ADX Smoothing - the time period to be used in calculating the ADX which has a smoothing component (14 is the Default).
DI Length - the time period to be used in calculating the DI (14 is the Default).
Key Level - any trade with the ADX above the key level is a strong indicator that it is trending (23 to 25 is the suggested setting).
Sensitivity - an incremental variable to test whether the past n candles are in the same bullish or bearish state before triggering a delayed crossover alert (3 is the Default). Filter out some noise and reduces active alerts.
Show ADX Option - two visual styles are provided for user preference, a visible ADX line or a background overlay (green or red when ADX is above the key level, for bullish or bearish, and gray when below).
Color Candles - an option to transpose the bullish and bearish crossovers to the main candle bars. Can be turned off in the Style Tab by deselecting 'Bar Colors'. Dark blue is bullish, dark purple is bearish, and the black inner color is neutral. Note that the outer red and green border will still be distinguished by whether each individual candle is bearish or bullish during the specified timeframe.
Indicator Visuals
---------------------------
Bullish or Bearish plot based on DMI strategy (ADX and +/-DI values).
Visual cues are intended to improve analysis and decrease interpretation time during trading, as well as to aid in understanding the purpose of this study and how its inclusion can benefit a comprehensive trading strategy.
Trend Strength
---------------------------
To analyze trend strength, the focus should be on the ADX line and not the +DI or -DI lines. An ADX reading above 25 indicates a strong trend, while a reading below 20 indicates a weak or non-existent trend. A reading between those two values would be considered indeterminable. Though what is truly a strong trend or a weak trend depends on the financial instrument being examined; historical analysis can assist in determining appropriate values.
Bullish DI Cross
---------------------------
1. ADX must be over 25 (strong trend) (value is determined by the trader)
2. +DI cross above -DI
3. Set Stop Loss at the current day's low (any +DI cross-backs below -DI should be ignored)
4. Set trailing stop if ADX strengthens (i.e., signal rises)
Bearish DI Cross
---------------------------
1. ADX must be over 25 (strong trend) (value is determined by the trader)
2. -DI cross above +DI
3. Set Stop Loss at the current day's high (any -DI cross-backs below +DI should be ignored)
4. Set trailing stop if ADX strengthens (i.e., signal rises)
Disclaimer
---------------------------
This post and the script are not intended to provide any financial advice. Trade at your own risk.
No known repainting.
Version 1.1
-------------------------
- Added multi-timeframe resolution using PineCoders secure security function to eliminate repainting.
- Cleaned up option for selecting ADX view; and added a colored line as a choice, based on same bullish, bearish, or neutral colors as the background.
- Added exit crossover indicator to aid in an overall strategy development. This ability pairs better with my CHOP Zone Entry Strategy which relies on DMI Exits. Note that exit conditions don't employ the sensitivity variable. Green labels are for Bullish exits and red are for Bearish.
-- Exit condition is triggered if in an active Bullish or Bearish position and ADX drops below 25, Or if either the -DI crosses above +DI (for previously Bullish) or +DI crosses above -DI (for previously Bearish).
- Added reverse position determination. Triggers when a Bullish entry occurs on the same candle as a Bearish exit, or vice versa. Green labels are for Bullish reverses and red are for Bearish.
- Added selectable option to choose visible labels -- Bearish, Bullish, Both, Exits, Reverses, or All.
-- Note that a reverse label will only show if the opposing entry and exit labels are set to show, otherwise the reverse will revert to the appropriate entry or exit on the chart.
- Added alerts to account for new conditions.
-- Note that alerts for crossovers, exits, and reverses will only be triggered if the associated labels are selected to be shown (i.e., what you choose to see on the chart is what you will be alerted to).
Version 1.2
-------------------------
- Changed exit condition to be decided on by whether ADX is below 25 and on a +/-DI crossover. Versus being either or. The previous version had too many false triggers. This variety can now show multiple Bullish or Bearish alerts before an Exit condition too. I'm tempted to simply make this condition based on ADX, and not DI … thoughts? See lines 138 and 139.
- Updated the Background view to have deeper shades of colors dependent upon the ADX trend strength.
- Added an Oscillator view for the ADX and momentum computations to color the histogram by trend. DI lines are hidden.
-- If ADX is Bullish, then the oscillator is colored light green in an uptrend and dark green in a downtrend; if Bearish, then its light red in an uptrend and dark redin a downtrend; if adx is below key level, then it is light gray in a downtrend and dark grey in the uptrend.
- Added option to Hide ADX in case only the Directional lines are desired. This could be useful if you would like to have the ADX oscillator in one panel and +/-DI crossovers in another.
- Added a Columnar view for the ADX. DI lines are hidden. This view is really simple and compact, with the trend strength still easily understood. Colors are the same as for the oscillator -- the deeper the shade of green or red, then the higher the ADX trend strength level.
- Added a Trend Strength label.
ADX Trend Strength Trade (Y/N) Setup Types
0 to 10 = Barely Breathing N N/A
10 to 20 = Weak Trend Y Range/Pre-Breakout
20 to 30 = Potentially Starting to Trend Y Early Stage Trend
30 to 50 = Strong Trend Y Ride the Wave
50 to 75 = Very Strong Trend N Exhaustion
75 to 100 = Extremely Strong Trend N N/A
Version 1.3
-------------------------
Updated to Pine Script v5 to resolve errors from the deprecated v4 version.
This is a reissue of a previously published script that was hidden due to a v4 compatibility issue.
'https://www.tradingview.com/script/9OoEHrv5-Directional-Movement-Index-DMI-Alerts/'

BK AK-9I am incredibly proud to introduce my fourth indicator to the TradingView community:
BK AK-9 — a next-level momentum-volatility hybrid, built for traders who demand precision.
🔥 Why “AK-9”? The Meaning Behind the Name
This indicator is deeply personal to me.
The “AK” in the name represents the initials of my mentor — the man whose guidance shaped my journey in trading, discipline, and strategy.
His wisdom is woven into every line of code, every design choice, and every purpose behind this tool.
The “9” holds its own powerful meaning:
9 is the number of completion and breakthrough — the moment where preparation meets opportunity.
The AK-9 weapon itself is a suppressed variant of the legendary AK platform, built for stealth, precision, and maximum impact in close-quarters combat.
It’s quiet, adaptive, and deadly effective — just like this indicator cuts through market noise, adapts to volatility, and pinpoints moments of maximum opportunity.
✨ About the BK AK-9 Indicator
The BK AK-9 is not just an oscillator.
It’s a multi-layered trading weapon combining:
✅ RSI → Stochastic → Bollinger Bands on Stoch RSI → momentum measured inside volatility.
✅ Dynamic or Static Background Flash → when extremes hit, you get instant visual alerts.
✅ Color-coded %K zones →
🔴 Red: oversold
🟢 Green: overbought
🔵 Blue: neutral
✅ Volatility-adaptive bands → instead of relying on static levels, the bands expand and contract dynamically using standard deviation.
🛡️ Why This Indicator Matters
Pinpoints exhaustion zones statistically, not emotionally.
Confirms breakouts with volatility evidence, not just price action.
Filters noise and helps you wait for high-probability setups.
Gives you visual edge with color-coded momentum and background flash.
Perfect for:
🔹 Breakout traders confirming momentum surges.
🔹 Mean-reversion traders catching exhaustion pivots.
🔹 Swing traders using multi-layered momentum analysis.
🔹 Momentum traders hunting volatility-backed entries.
💥 How to Use BK AK-9
Breakout Confirmation → when Stoch RSI breaks above upper Bollinger Band (green zone, flash ON), ride the trend.
Mean Reversion Trades → when Stoch RSI drops below lower Bollinger Band (red zone, flash ON), look for reversals.
Noise Filtering → stay patient inside the blue zone, wait for extremes.
Advanced Sync → align it with Gann levels, harmonic patterns, Fibonacci clusters, or Elliott waves for maximum edge.
🙏 Final Thoughts
This isn’t just another tool — it’s a weapon in your trading arsenal.
🔹 Dedicated to my mentor, A.K., whose wisdom and legacy guide my work.
🔹 Designed around the number 9, the number of completion, transition, and breakthrough.
🔹 Built to help traders act with precision, discipline, and clarity.
But above all, I give praise and glory to Gd — the true source of wisdom, insight, and success.
Markets will test your patience and your skill, but faith tests your soul. Through every challenge, every victory, and every setback, Gd remains the constant.
This tool is simply another way to use the gifts He has given — to help others rise.
⚡ Stay Ready, Stay Sharp
The markets are a battlefield. But with the right tools, the right strategy, and the right mindset — you will always stay 10 steps ahead.
🔥 Stay locked. Stay loaded. Trade with precision. 🔥
Gd bless, and may He guide us all to wisdom and success. 🙏

Stochastics + VixFix Buy/Sell SignalsThis script is designed for long-term investors using ETFs on a weekly timeframe, where catching high-probability bottoms is the goal. It combines the Stochastic Oscillator with the Williams VixFix to identify moments of extreme fear and potential reversals.
A Buy signal is triggered when:
Stochastic %K drops below 20
VixFix forms a green spike (suggesting a panic-driven market flush)
A Sell signal is triggered when:
Stochastic %K rises above 90
VixFix falls below 5 (indicating excessive complacency)
Catching tops is much harder than catching bottoms.
These Sell signals are not designed to fully exit positions. Instead, they suggest trimming a small portion of ETF holdings — simply to free up liquidity for future opportunities.
This strategy is ideal for:
Long-term ETF investors
Weekly charts
Systematic decision-making in volatile markets
Use in conjunction with macro indicators, sector rotation, and valuation frameworks for best results.

RSI 5 Dakika Al/Sat Alarmırsi 5 dklık grafikte scalp için sinyal üretir. yatırım tavsiyesi değildir.

VAPI with MA (no ta.sum)## 📘 Indicator: **VAPI with MA (no ta.sum)**
This custom indicator is a version of the **Volume Adjusted Price Indicator (VAPI)** combined with a selectable **moving average (MA)**. It manually computes the volume-weighted price momentum over a period and smooths it with a chosen type of moving average. The purpose is to assess directional volume pressure and potential trend shifts.
---
### 🔧 Inputs:
* **VAPI Length (`length`)**: Number of bars used for calculating the VAPI.
* **MA Length (`maLength`)**: Number of bars for smoothing VAPI with a moving average.
* **MA Type (`maType`)**: Type of moving average to apply (options: SMA, EMA, WMA, RMA, HMA, VWMA).
---
### 📈 Calculation Logic:
1. **x = (2 × close − high − low) / (high − low)**
Measures where the closing price lies within the candle range:
* Close at high → x = 1
* Close at low → x = -1
* Close in the middle → x = 0
A small constant (0.0001) is used to avoid division by zero.
2. **volX = volume × x**
This adjusts volume based on the candle's directional momentum.
3. **Manual summation over `length` bars** (instead of using `ta.sum`):
* `tva` accumulates the volume-adjusted values (`volX`)
* `tv` accumulates the total volume
4. **VAPI = 100 × (tva / tv)**
Gives a percentage-style oscillator:
* Positive values → bullish pressure
* Negative values → bearish pressure
5. **MA = Moving Average of VAPI**
Type of MA is user-defined (SMA, EMA, WMA, RMA, HMA, or VWMA).
---
### 📊 Plots:
* **VAPI Line** — Gray line (shows raw volume-adjusted price impulse).
* **MA Line** — Orange line (smoothed VAPI).
* **Zero Line** — Dashed horizontal reference at 0:
* Crossovers may suggest trend direction changes.
---
### 💡 Use Cases:
* **Volume momentum analysis**: Shows if volume supports current price action.
* **Divergence spotting**: Compare VAPI behavior against price movements.
* **Trend filtering**: The MA smooths out noise for clearer signals.
* **Entry/exit signals**: Use crossovers of VAPI/MA or zero line as potential triggers.
