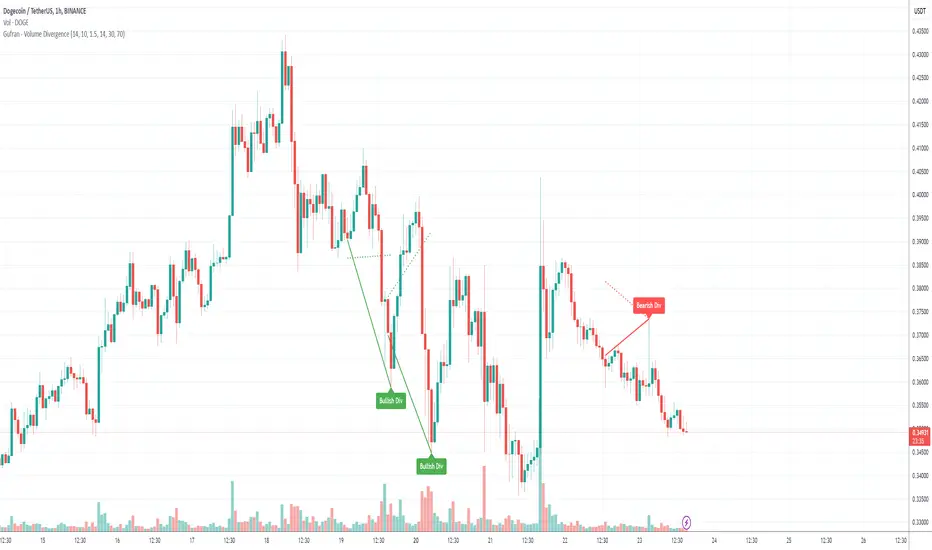
Gufran - Volume DivergenceThis indicator detects bullish and bearish divergences by analyzing price action, volume trends, and RSI (Relative Strength Index) for added confirmation. It highlights key market reversals or trend continuations by identifying when price movement diverges from volume dynamics, providing traders with actionable insights for entry and exit points.
Key Features:
Divergence Detection:
Bullish Divergence: Price makes a lower low, but volume shows higher lows, signaling potential upward reversals.
Bearish Divergence: Price makes a higher high, but volume shows lower highs, signaling potential downward reversals.
RSI Confirmation:
Bullish Signals: Confirmed when RSI is in the oversold zone.
Bearish Signals: Confirmed when RSI is in the overbought zone (optional relaxation of RSI conditions available).
Normalized Volume Analysis:
Volume is scaled to the price range, ensuring clear and meaningful visualization alongside price action.
Customizable Parameters:
Lookback Period: Define how far back the script looks to identify divergences.
Volume Significance: Adjust the threshold for significant volume movements.
RSI Levels: Fine-tune overbought and oversold thresholds for optimal signal accuracy.
Gap Control: Avoid clutter by setting a minimum number of candles between successive divergence signals.
Clear Visual Representation:
Bullish Divergence: Marked with green labels and connecting lines.
Bearish Divergence: Marked with red labels and connecting lines.
Dotted lines show normalized volume divergence, while solid lines indicate price divergence.
Ideal For:
Traders who rely on volume dynamics to validate price movements.
Those looking for an added layer of confidence using RSI to filter false signals.
Swing and intraday traders aiming to identify market reversal zones or continuation patterns.
Customization Options:
Lookback Period: Adjustable range for detecting highs and lows.
Volume Threshold: Define the multiplier for significant volume changes.
RSI Settings: Tailor overbought/oversold levels to suit your trading style.
Relax RSI Condition: Toggle stricter or more flexible conditions for bearish divergences.
How to Use:
Add the indicator to your chart and configure the parameters to fit the asset and timeframe you are trading.
Look for:
Green “Bullish Div” labels near price lows for potential buying opportunities.
Red “Bearish Div” labels near price highs for potential selling opportunities.
Use this indicator in combination with other tools like support/resistance levels, trendlines, or moving averages for a comprehensive trading strategy.
Disclaimer:
This indicator is a tool for educational purposes and should not be used as a standalone trading signal. Always conduct proper risk management and consider additional technical/fundamental analysis before making trading decisions.
Price Volume Trend (PVT)
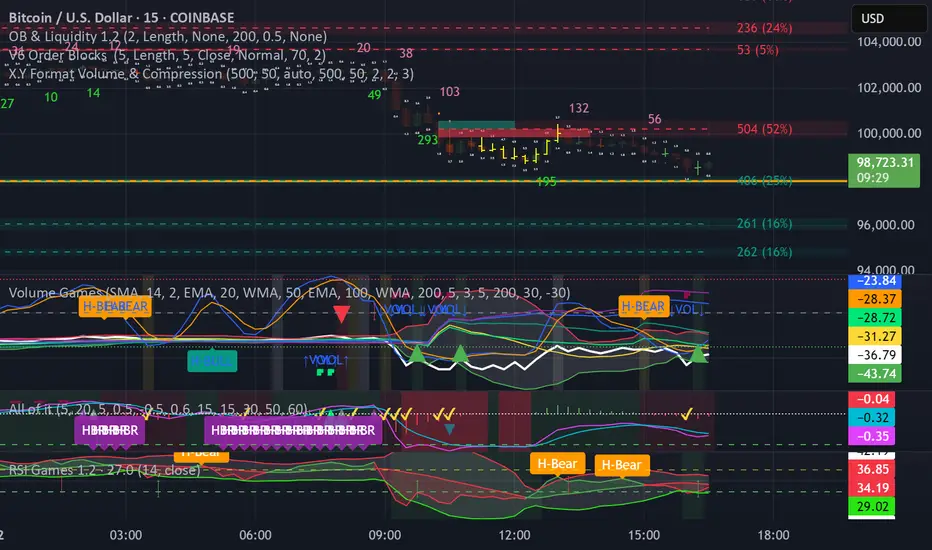
X.Y Format Candle Volume & CompressionThe Volume & Compression Indicator is designed to help traders identify significant market moves by displaying two key metrics above each candle. The top number represents the Volume Ratio, which compares the current candle's volume to the average volume of recent candles. For example, a reading of 2.5 means the current volume is 2.5 times higher than average. When volume exceeds 9.9 times the average, the indicator displays an up or down arrow instead of a number, indicating extremely high volume in that direction.
The bottom number shows the Compression Ratio, which measures the relationship between volume and price movement. This helps identify when large amounts of volume are moving price significantly (low compression) versus when high volume isn't resulting in much price movement (high compression). High compression often indicates accumulation or distribution phases, while low compression with high volume typically suggests strong directional moves.
The indicator includes visual cues to help spot patterns. Dots appear above candles when both high volume and high compression persist over several candles, potentially indicating accumulation phases. Arrows mark possible pivot points after these accumulation periods. Additionally, the candles themselves can display a gradient color that intensifies with increased compression, making it easier to spot areas of interest.
For trading purposes, watch for volume spikes (top number above 2.0) as they can signal potential reversal points or confirm breakouts. High compression readings might precede breakouts, while low compression with high volume often confirms strong trend moves. The most significant signals often come when both metrics show high readings over multiple candles, suggesting sustained institutional interest.
Twiggs Money FlowTwiggs Money Flow (TMF)
This indicator is an implementation of the Twiggs Money Flow (TMF), a volume-based tool designed to measure buying and selling pressure over a specified period. TMF is an enhancement of Chaikin Money Flow (CMF), utilizing more sophisticated smoothing techniques for improved accuracy and reduced noise. This version is highly customizable and includes advanced features for both new and experienced traders.
What is Twiggs Money Flow?
Twiggs Money Flow was developed by Colin Twiggs to provide a clearer picture of market momentum and the balance between buyers and sellers. It uses a combination of price action, trading volume, and range calculations to assess whether a market is under buying or selling pressure.
Unlike traditional volume indicators, TMF incorporates Weighted Moving Averages (WMA) by default but allows for other moving average types (SMA, EMA, VWMA) for added flexibility. This makes it adaptable to various trading styles and market conditions.
Features of This Script:
Customizable Moving Average Types:
Select from SMA , EMA , WMA , or VWMA to smooth volume and price-based calculations.
Tailor the indicator to align with your trading strategy or the asset's behavior.
Optional HMA Smoothing:
Apply Hull Moving Average (HMA) smoothing for a cleaner, faster-reacting TMF line.
Perfect for traders who want to reduce lag and capture trends earlier.
Dynamic Thresholds for Signal Filtering:
Set user-defined thresholds for Long (LT) and Short (ST) signals to highlight significant momentum.
Focus on actionable trends by ignoring noise around neutral levels.
Bar Coloring for Visual Clarity:
Automatically colors your chart bars based on TMF values:
Aqua for strong bullish signals (above the long threshold).
Fuchsia for strong bearish signals (below the short threshold).
Gray for neutral or undecided market conditions.
Ensures that trend direction and strength are visually intuitive.
Configurable Lookback Period:
Adjust the sensitivity of TMF by customizing the length of the lookback period to suit different timeframes and market conditions.
How It Works:
True Range Calculation: The script determines the high, low, and close range to calculate buying and selling pressure.
Adjusted Volume: Incorporates the relationship between price and volume to gauge whether trading activity is favoring buyers or sellers.
Weighted Moving Averages (WMAs): Smooths both volume and adjusted volume values to eliminate erratic fluctuations.
TMF Line: Computes the ratio of adjusted volume to total volume, representing the net buying/selling pressure as a percentage.
HMA Option (if enabled): Smooths the TMF line further to reduce lag and enhance trend identification.
Bar Coloring Logic:
Bars are colored dynamically based on TMF values, thresholds, and smoothing preferences.
Provides an at-a-glance understanding of market conditions.
Input Parameters:
Lookback Period: Defines the number of bars used to calculate TMF (default: 21).
Use HMA Smoothing: Toggle Hull Moving Average smoothing (default: true).
HMA Smoothing Length: Length of the HMA smoothing period (default: 14).
Moving Average Type: Select SMA, EMA, WMA, or VWMA (default: WMA).
Long Threshold (LT): Threshold value above which a long signal is considered (default: 0).
Short Threshold (ST): Threshold value below which a short signal is considered (default: 0).
How to Use It:
Confirm Trends: TMF can validate trends by identifying periods of sustained buying or selling pressure.
Divergence Signals: Watch for divergences between price and TMF to anticipate potential reversals.
Filter Trades: Use the thresholds to ignore weak signals and focus on strong trends.
Combine with Other Indicators: Pair TMF with trend-following or momentum indicators (e.g., RSI, Bollinger Bands) for a comprehensive trading strategy.
Example Use Cases:
Spotting breakouts when TMF crosses above the long threshold.
Identifying sell-offs when TMF dips below the short threshold.
Avoiding sideways markets by ignoring neutral (gray) bars.
Notes:
This indicator is highly customizable, making it versatile across different assets (e.g., stocks, crypto, forex).
While the default settings are robust, tweaking the lookback period, moving average type, and thresholds is recommended for different trading instruments or strategies.
Always backtest thoroughly before applying the indicator to live trading.
This version of Twiggs Money Flow goes beyond standard implementations by offering advanced smoothing, custom thresholds, and enhanced visual feedback to give traders a competitive edge.
Add it to your charts and experience the power of volume-driven analysis!

MERCURY-PRO by DrAbhiramSivprasd“MERCURYPRO”
The MERCURYPRO indicator is a custom technical analysis tool designed to provide dynamic trend signals based on a combination of the Chande Momentum Oscillator (CMO) and Standard Deviation (StDev). This indicator helps traders identify trend reversals or continuation based on the behavior of the price and momentum.
Key Features:
• Source Input: The indicator works with any price data, with the default set to close, which represents the closing price of each bar.
• Length Input: A period (default value 9) is used to determine the calculation window for the Chande Momentum Oscillator and Standard Deviation.
• Fixed CMO Length Option: Users can choose whether to use a fixed CMO length of 9 or adjust the length to the user-defined pds value.
• Calculation Method: The indicator allows switching between using the Chande Momentum Oscillator (CMO) or Standard Deviation (StDev) for the momentum calculation.
• Alpha: The smoothing factor used in the calculation of the MERCURYPRO value, which is based on the length of the period input (pds).
Core Calculation:
1. Momentum Calculation: The script calculates the momentum by determining the change in the source price (e.g., close) from one period to the next.
2. Chande Momentum Oscillator (CMO): The positive and negative momentum components are calculated and then summed over the specified period. This value is normalized to a percentage to determine the momentum strength.
3. K Value Calculation: The script selects either the CMO or Standard Deviation (depending on the user setting) to calculate the k value, which represents the dynamic price momentum.
4. MERCURYPRO Line: The final output of the indicator, MERCURYPRO, is computed using a weighted average of the k value and the previous MERCURYPRO value. The line is smoothed using the Alpha parameter.
Plot and Signal Generation:
• Color Coding: The line is color-coded based on the direction of MERCURYPRO:
• Blue: The trend is bullish (MERCURYPRO is rising).
• Maroon: The trend is bearish (MERCURYPRO is falling).
• Default Blue: Neutral or sideways market conditions.
• Plotting: The MERCURYPRO line is plotted with varying colors depending on the trend direction.
Alerts:
• Color Change Alert: The indicator has an alert condition based on when the MERCURYPRO line crosses its previous value. This helps traders stay informed about potential trend reversals or continuation signals.
Use Case:
• Trend Confirmation: Traders can use the MERCURYPRO indicator to identify whether the market is in a strong trend or not.
• Signal for Entries/Exits: The color change and crossovers of the MERCURYPRO line can be used as entry or exit signals, depending on the trader’s strategy.
Overall Purpose:
The MERCURYPRO indicator combines momentum analysis with smoothing techniques to offer a dynamic, responsive tool for identifying market trends and potential reversals. It is particularly useful in conjunction with other technical indicators to provide confirmation for trade setups.
How to Use the MERCURYPRO Indicator:
The MERCURYPRO indicator is designed to help traders identify trend reversals and market conditions. Here are a few ways you can use it:
1. Trend Confirmation (Bullish or Bearish)
• Bullish Trend: When the MERCURYPRO line is colored Blue, it indicates a rising trend, suggesting that the market is bullish.
• Action: You can consider entering long positions when the line turns blue, or holding your existing positions if you’re already long.
• Bearish Trend: When the MERCURYPRO line is colored Maroon, it signals a downward trend, indicating a bearish market.
• Action: You may consider entering short positions or closing any long positions when the line turns maroon.
2. Trend Reversal Alerts
• Color Change: The MERCURYPRO indicator changes color when there’s a trend reversal. The alert condition triggers when the MERCURYPRO crosses above or below its previous value, signaling a potential shift in the trend.
• Action: You can use this alert as a signal to monitor potential entry or exit points for trades. For example, a crossover from maroon to blue could indicate a potential buying opportunity, while a crossover from blue to maroon could suggest a selling opportunity.
3. Use with Other Indicators for Confirmation
• While the MERCURYPRO provides valuable trend insights, it’s often more effective when used in combination with other indicators like RSI (Relative Strength Index), MACD, or moving averages to confirm signals.
• Example: If MERCURYPRO turns blue and RSI is above 50, it may signal a strong bullish trend, enhancing the confidence to enter a long trade.
4. Divergence
• Watch for divergence between the MERCURYPRO line and the price chart:
• Bullish Divergence: If the price makes new lows while MERCURYPRO is showing higher lows, it suggests a potential bullish reversal.
• Bearish Divergence: If the price makes new highs while MERCURYPRO is showing lower highs, it suggests a potential bearish reversal.
Example of Use:
• Example 1: If the MERCURYPRO line changes from maroon to blue, you might enter a long position. After the MERCURYPRO line turns blue, use an alert to monitor the price action. If other indicators (like RSI) also suggest strength, your confidence in the trade will increase.
• Example 2: If the MERCURYPRO line shifts from blue to maroon, it could be a signal to close long positions and consider shorting the market if other conditions align (e.g., moving averages also turn bearish).
Warning for Using the MERCURYPRO Indicator:
1. Lagging Indicator:
• The MERCURYPRO is a lagging indicator, meaning it responds to price changes after they have occurred. This may delay entry and exit signals, and it’s crucial to combine it with other leading indicators to get timely information.
2. False Signals in Range-bound Markets:
• In choppy or sideways markets, the MERCURYPRO line can produce false signals, flipping between blue and maroon frequently without showing a clear trend. It’s important to avoid trading based on these false signals when the market is not trending.
3. Overreliance on One Indicator:
• Relying solely on MERCURYPRO can be risky. Always confirm signals with additional tools like volume analysis, price action, or other indicators to increase the accuracy of your trades.
4. Market Conditions Matter:
• The indicator may work well in trending markets, but in highly volatile or news-driven environments, it may provide misleading signals. Ensure that you take market fundamentals and external news events into consideration before acting on the indicator’s signals.
5. Risk Management:
• As with any technical indicator, MERCURYPRO is not infallible. Always use appropriate risk management techniques such as stop-loss orders to protect your capital. Never risk more than you can afford to lose on a trade.
6. Backtest First:
• Before implementing MERCURYPRO in live trading, make sure to backtest it on historical data. Test the strategy with various market conditions to assess its effectiveness and identify any potential weaknesses.
By considering these guidelines and warnings, you can use the MERCURYPRO indicator more effectively and mitigate potential risks in your trading strategy.

Holding Volume StrengthHolding Volume Strength Indicator
1. Overview :
The Holding Volume Strength indicator is designed to measure the buying and selling volume based on price action (bullish vs. bearish candles) over a user-defined lookback period. This indicator helps traders gauge the strength of market participants' involvement (buyers vs. sellers) during a specific time frame.
2. Key Inputs :
- Lookback Period : The period over which you want to calculate the Buy and Sell volumes. For example, a lookback of 5 will calculate the volume for the current candle and the previous candle , while a lookback of 10 will consider the current candle and the 9 preceding candles.
- Text Color : This allows customization of the label's text color for better visibility and style.
3. Volume Calculation :
- Buy Volume : If the close price of a candle is greater than its open price (bullish candle), the body size (difference between open and close) is multiplied by the volume for that candle to calculate the buy volume. This represents the market's buying strength.
- Sell Volume : If the close price of a candle is less than its open price (bearish candle), the body size is multiplied by the volume for that candle to calculate the sell volume. This represents the market's selling strength.
4. Volume Display :
The Buy and Sell Volumes are displayed in a readable format, such as:
- Buy Volume: "1.5M" (1.5 million)
- Sell Volume: "500K" (500 thousand)
These values can help identify whether buying or selling is more dominant over a specified period.
5. Label Display :
The calculated Buy and Sell volumes are shown as labels on the main price chart (overlay). These labels dynamically update with each new candle and show the values for the current candle and the previous `n` candles (based on the lookback period).
---
How This Indicator Helps in Making Buy/Sell Decisions :
1. Volume Analysis :
- High Buy Volume : A significant amount of buying volume can indicate strong market interest in the asset, suggesting potential upward momentum. If the market is in a bullish trend (e.g., after a series of green candles), and you see increasing buy volume, this might indicate that buyers are in control , making it a potential signal to buy .
- High Sell Volume : On the other hand, a significant amount of selling volume, particularly after a series of bullish candles, can signal that sellers are taking control of the market, which could indicate bearish pressure . If you observe increasing sell volume, it might be a potential signal to sell or to short the asset.
2. Volume Confirmation :
- Volume is often used to confirm price movements . For example, if the price breaks above a resistance level with strong buy volume , it suggests that the breakout is likely genuine and not a false move. Similarly, if the price drops below a support level with strong sell volume , it could signal that the breakout is real and the downtrend is continuing.
3. Divergence Analysis :
- Volume divergence occurs when price makes a new high or low but volume doesn't confirm it. For instance:
- If price makes a new high but the buy volume does not increase (or even decreases), it could signal a weak trend or potential reversal.
- Similarly, if price makes a new low but sell volume is weak, it might suggest the downtrend is losing steam and could reverse.
4. Buy/Sell Signal Strategy :
- Buy Signal : A potential buy signal might occur when you see a bullish candle with increased buy volume (especially if the buy volume is higher than the sell volume) during an uptrend or near a support level.
- Sell Signal : A potential sell signal might occur when you see a bearish candle with increased sell volume (especially if the sell volume is higher than the buy volume) during a downtrend or near a resistance level.
You could also combine this with other technical indicators (like Moving Averages, RSI, etc.) to form a more robust trading strategy.
---
Example of How It Works in Practice :
- Scenario 1 (Bullish) :
- You're trading a stock or cryptocurrency, and you have the Holding Volume Strength indicator plotted.
- Over the past 10 candles, you notice a bullish trend where the price is rising.
- On the current candle, you see a strong buy volume value, indicating that buyers are in control .
- Given that the buy volume is higher than the sell volume , this might reinforce the bullish trend , and you could consider buying or entering a long position .
- Scenario 2 (Bearish) :
- You're analyzing the same asset, but this time, the price is in a downtrend .
- You notice that a recent bearish candle has a strong sell volume , suggesting sellers are dominating .
- If this sell volume is higher than the buy volume, it could indicate that the downtrend is likely to continue , and you might consider selling or entering a short position .
---
Why Volume Matters :
- Volume precedes price : Volume is often considered a leading indicator, as changes in volume can signal future price movements . For example, a sudden increase in buy volume often precedes upward price movement, while a sudden increase in sell volume often precedes downward price movement.
- Volume confirms trends : Volume helps confirm trends. A price move accompanied by high volume is typically more reliable , while a price move with low volume might be a false signal or less likely to sustain itself.
---
Conclusion :
The Holding Volume Strength indicator helps traders understand the market sentiment (buyers vs. sellers) by showing the cumulative buying and selling volume over a specified period. By examining the buy and sell volumes, traders can make more informed decisions about when to buy, sell, or hold based on market strength.
This volume analysis is essential because it allows traders to understand how strong the price movement is and whether it is likely to continue or reverse. By incorporating volume analysis with other indicators or chart patterns, traders can improve the accuracy of their trading signals and reduce risk.

Numerical Volume with Bullish/Bearish Color CodingDescription: This indicator visually represents trading volume with color-coded lines to distinguish between bullish and bearish market conditions. The volume line is colored green for bullish periods (when the closing price is higher than the opening price), red for bearish periods (when the closing price is lower than the opening price), and gray for neutral periods (when the open and close prices are equal). The volume can be displayed with labels at specified intervals, offering a quick reference to the exact volume for each period. This tool helps to analyze volume trends in relation to price action, providing an easy-to-read overview of market sentiment.

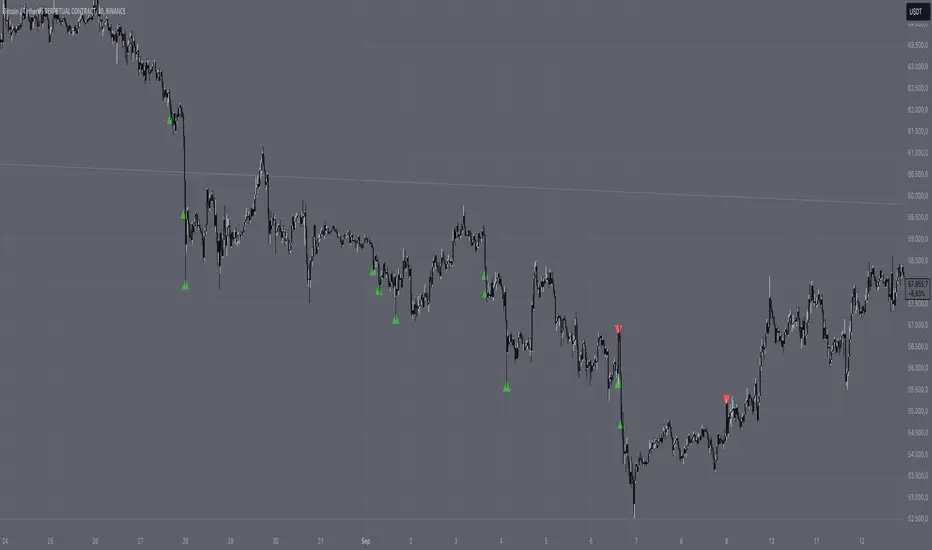
Gap Marker (>5%)This TradingView script identifies and highlights price gaps of more than 5% between consecutive candles. It is a valuable tool for traders to quickly spot significant price movements and take action accordingly.
Features:
Gap-Up Detection: Marks green triangles when a candle’s opening price is more than 5% higher than the previous candle’s closing price.
Gap-Down Detection: Marks red triangles when a candle’s opening price is more than 5% lower than the previous candle’s closing price.
Percentage Display: Shows the percentage change next to the marker for added clarity.
This script is especially useful for identifying potential trading opportunities triggered by substantial market moves.
Dieses TradingView-Skript identifiziert und markiert Kurslücken (Gaps) von mehr als 5 % zwischen aufeinanderfolgenden Kerzen. Es ist ein hilfreiches Tool für Trader, um bedeutende Kursbewegungen sofort zu erkennen und darauf zu reagieren.
Funktionen:
Gap-Up-Erkennung: Markiert grüne Dreiecke, wenn der Eröffnungskurs einer Kerze mehr als 5 % über dem Schlusskurs der vorherigen Kerze liegt.
Gap-Down-Erkennung: Markiert rote Dreiecke, wenn der Eröffnungskurs einer Kerze mehr als 5 % unter dem Schlusskurs der vorherigen Kerze liegt.
Prozentanzeige: Zeigt die prozentuale Veränderung direkt neben der Markierung an.
Das Skript ist besonders nützlich, um potenzielle Handelsmöglichkeiten zu identifizieren, die durch signifikante Marktbewegungen ausgelöst werden.

Enhanced Buy/Sell Pressure, Volume, and Trend Bar analysisEnhanced Buy/Sell Pressure, Volume, and Trend Bar Analysis Indicator
Overview
This indicator is designed to help traders identify buy and sell pressure, volume changes, and overall trend direction in the market. It combines multiple concepts like price action, volume, and trend analysis, candlestick anaysis to provide a comprehensive view of market dynamics. The visual elements are intuitive, making it suitable for traders at different levels. This indicator works together with Enhanced Pressure MTF Screener which is a screener based of this indicator to make it easier to see Bullish/Bearish pressures and trend across multiple timeframes.
Image below: is the Enhanced Buy/Sell Pressure, Volume, and Trend Bar Analysis with the Enhanced Pressure MTF Screener indicator both active together.
Key Features
1.Buy/Sell Pressure Identification
Buy Pressure: Calculated based on price movement where the close price is higher than the opening price.
Sell Pressure: Calculated when the closing price is equal to or lower than the opening price.These pressures help you understand whether buyers or sellers are more dominant for each bar.
2.Volume Analysis
Normalized Volume: Volume data is normalized, making it easier to compare volume levels over different periods.
Volume Histogram: The volume is also presented as a histogram for easy visualization, showing whether the current volume is higher or lower compared to the average.
3.Simplified Coloring Option
You can choose to simplify the coloring of bars to reflect the dominant pressure: green for bullish pressure and red for bearish pressure. This makes it visually easier to identify who is in control. When simplified coloring is disabled, the bars' colors will represent the combined effect of buy and sell pressure.
4.Heikin-Ashi Candles for Pressure Calculation
The indicator includes an option to use Heikin-Ashi candles instead of traditional candles to calculate buy and sell pressure. Heikin-Ashi candles are known for smoothing out price action and providing a clearer trend representation.
5.Trend Background Coloring
This feature uses exponential moving averages (EMAs) to determine the trend:
Short-Term EMA vs. Long-Term EMA: When the short-term EMA is above the long-term EMA, the trend is considered bullish, and vice versa.
The background color changes based on the identified trend: green for an uptrend and red for a downtrend. This feature helps visualize the overall market direction at a glance.
6.Signals for Key Price Actions
The indicator plots various symbols to signal important price movements:
Bullish Close (▲): Indicates a strong upward movement where the close price crosses above the open.
Bearish Close (▼): Indicates a downward movement where the close price falls below the open.
Higher High (•): Highlights new highs compared to previous bars, useful for confirming an uptrend.
Lower Low (•): Highlights lower lows compared to previous bars, which can indicate a downtrend or bearish pressure.
Calculations Explained
1.Buy and Sell Pressure Calculation
The buy pressure is determined by the price range (high - low) if the closing price is above the opening price, indicating an increase in value.
The sell pressure is similarly calculated when the closing price is equal to or below the opening price.
The indicator uses the Average True Range (ATR) for normalization. Normalizing helps you compare pressure across different periods, regardless of market volatility.
2.Volume Normalization
Volume Normalization: To make volume comparable across different periods, the indicator normalizes it using the Simple Moving Average (SMA) of volume over a user-defined length.
Volume Histogram: The histogram provides a clear representation of volume changes compared to the average, making it easier to spot unusual activity that may indicate market shifts.
3.Combined Pressure Calculation
The indicator calculates a combined pressure value by subtracting sell pressure from buy pressure.
When combined pressure is positive, buying is dominant, and when negative, selling is dominant. This helps in visually understanding the ongoing momentum.
4.Trend Calculation
The indicator uses two EMAs to determine the trend:
Short-Term EMA (default 14-period) to capture recent price movements.
Long-Term EMA (default 50-period) to provide a broader trend perspective.
By comparing these EMAs on a higher timeframe, the indicator can identify whether the trend is up or down, making it easier for traders to align their trades with the larger market movement.
Inputs and Customization
The indicator provides several options for customization, allowing you to adjust it to your preferences:
SMA Length: Determines the lookback period for moving averages and volume normalization. A longer length provides more smoothing, whereas a shorter length makes the indicator more responsive.
Buy/Sell/Volume Colors: Customize the colors used to represent buying, selling, and volume to suit your preferences.
Heikin Ashi Option: Toggle between using Heikin Ashi or traditional OHLC (Open-High-Low-Close) candles for pressure calculations.
Trend Timeframe and EMA Periods: You can choose different timeframes and EMA periods for trend analysis to suit your trading strategy.
How to Use This Indicator
Identifying Market Momentum: Use the buy/sell pressure columns to see which side (buyers or sellers) is in control. Positive pressure combined with green color indicates strong buying, while red indicates selling.
Volume Confirmation: Check the volume area plot and histogram. High volume coupled with strong pressure is a sign of conviction, meaning the current move has backing from market participants.
Trend Identification: The trend background color helps identify the overall trend direction. Trade in the direction of the trend (e.g., take long positions during a green background).
Signal Indicators: The plotted symbols like "Bullish Close" and "Bearish Close" provide visual signals of key price actions, useful for timing entry or exit points.
Practical use Example
Scenario: The market is consolidating, and you see alternating green and red bars.
Action: Wait for a consistent sequence of green bars (buy pressure) along with a green background (uptrend) to consider going long, although you can go long without having a green background, the background adds confirmation layer.
Scenario: The market has several bearish closes (red ▼ symbols) accompanied by increasing volume.
Action: This could indicate strong selling pressure. If the background also turns red, it might be a good time to exit long positions or consider shorting.
Higher timeframe pressure and volume: Another way to use the indicator is to check buy/sell volume and pressure of the higher timeframe say weekly or daily or any timeframe you consider higher, once you’ve identified or feel confident in which direction the bar is going along with the full picture of trend, you can go to the lower timeframe and wait for it to sync with the higher timeframe to consider a long or a short. It is also easier to see when markets sync up by also applying the Enhanced Pressure MTF Screener which works in companion to this indicator.
Visual Cues and Interpretation
Combined Pressure Plot: The green and red column plot at the bottom of the chart represents the dominance between buying and selling. Tall green bars signify strong buying, while tall red bars indicate selling dominance.
Trend Background: Helps visualize the overall direction without manually drawing trend lines. When the background turns green, it generally indicates that the shorter-term moving average has crossed above the longer-term average—a sign of a bullish trend.
To Summarize shortly
The Enhanced Buy/Sell Pressure, Volume, and Trend Bar Analysis Indicator is an advanced but simple tool designed to help traders visually understand market dynamics. It combines different aspects of market analysis of candle pressure from buyers and sellers, volume confirmation, and trend identification into a single view, which can assist both new and experienced traders in making informed trading decisions.
This indicator:
Saves time by simplifying market analysis.
Provides clear visual cues for buy/sell pressure, volume, and trend.
Offers customizable settings to suit individual trading styles.
Always, I am happy to share my creations with you all for free. If you guys have cool ideas you would like to share, or suggestions for improvements the comment is below and I hope this overview gave an idea of how to use the indicator :D

Custom Volume for scalping### **Indicator Summary: Custom Volume with Arrow Highlight**
#### **Purpose:**
This indicator visualizes volume bars in a chart, highlighting specific conditions based on volume trends. It displays arrows above the volume bars to indicate potential bullish or bearish market conditions.
#### **Key Features:**
1. **Volume Bars**:
- The indicator plots volume as columns on the chart.
- Volume bars are colored:
- **White** for bullish volume (when the closing price is higher than the opening price).
- **Blue** for bearish volume (when the closing price is lower than the opening price).
2. **Highlight Conditions**:
- The indicator identifies a sequence of three consecutive volume bars:
- The first two bars must be of the same direction (either both bullish or both bearish).
- The third bar must be of the opposite direction.
- Additionally, the third bar's volume must be greater than the previous bar's volume.
3. **Arrow Indicators**:
- When the highlight conditions are met:
- An **upward arrow** ("▲") is placed above the third volume bar for bullish conditions (when the third bar is bullish).
- A **downward arrow** ("▼") is placed above the third volume bar for bearish conditions (when the third bar is bearish).
- The arrows are colored to match the respective volume bar: white for bullish and blue for bearish.
4. **Adjustable Size**:
- The arrows are sized appropriately to ensure visibility without cluttering the chart.
#### **Use Cases:**
- This indicator can help traders identify potential reversals or continuation patterns based on volume behavior.
- It is particularly useful for traders focusing on volume analysis to confirm market trends and make informed trading decisions.
#### **Customization:**
- Users can modify the conditions and visual attributes according to their preferences, such as changing colors, sizes, and label positions.
### **Conclusion:**
The "Custom Volume with Arrow Highlight" indicator provides a straightforward and effective way to visualize volume trends and identify key market conditions, aiding traders in their decision-making processes. It combines the power of volume analysis with clear visual cues, making it a valuable tool for technical analysis in trading.
If you need any further modifications or details, let me know!

Volume Based Price Prediction [EdgeTerminal]This indicator combines price action, volume analysis, and trend prediction to forecast potential future price movements. The indicator creates a dynamic prediction zone with confidence bands, helping you visualize possible price trajectories based on current market conditions.
Key Features
Dynamic price prediction based on volume-weighted trend analysis
Confidence bands showing potential price ranges
Volume-based candle coloring for enhanced market insight
VWAP and Moving Average overlay
Customizable prediction parameters
Real-time updates with each new bar
Technical Components:
Volume-Price Correlation: The indicator analyzes the relationship between price movements and volume, Identifies stronger trends through volume confirmation and uses Volume-Weighted Average Price (VWAP) for price equilibrium
Trend Strength Analysis: Calculates trend direction using exponential moving averages, weights trend strength by relative volume and incorporates momentum for improved accuracy
Prediction Algorithm: combines current price, trend, and volume metrics, projects future price levels using weighted factors and generates confidence bands based on price volatility
Customizable Parameters:
Moving Average Length: Controls the smoothing period for calculations
Volume Weight Factor: Adjusts how much volume influences predictions
Prediction Periods: Number of bars to project into the future
Confidence Band Width: Controls the width of prediction bands
How to use it:
Look for strong volume confirmation with green candles, watch for prediction line slope changes, use confidence bands to gauge potential volatility and compare predictions with key support/resistance levels
Some useful tips:
Start with default settings and adjust gradually
Use wider confidence bands in volatile markets
Consider prediction lines as zones rather than exact levels
Best applications of this indicator:
Trend continuation probability assessment
Potential reversal point identification
Risk management through confidence bands
Volume-based trend confirmation

Hermes Reg FIBONACCI V.4Hermes Reg Fibonacci V.4 Indicator User Guide
Overview
The Hermes Reg Fibonacci V.4 indicator is a versatile tool used for identifying market trends and channels. This indicator analyzes price movements using logarithmic regression and Fibonacci levels, helping users determine the direction of the trend and identify support/resistance levels.
Parameters and Inputs
Source: The price data to be used in the calculations of the indicator. The default is the close price.
Length: The period length for the calculations of the indicator. The default is 262 and the minimum value is 10.
Deviation Multiplier (devlen): Set to 1.6.
Extend Lines: Determines whether the lines should be extended to the right of the chart.
Show Fibonacci Levels: Determines whether Fibonacci levels should be displayed.
Show Broken Channel: Determines whether to display the broken channel lines.
Up Trend Color (upcol): The color of the uptrend line.
Down Trend Color (dncol): The color of the downtrend line.
Fibonacci Up Trend Color (fibupcol): The color of the Fibonacci uptrend line.
Fibonacci Down Trend Color (fibdncol): The color of the Fibonacci downtrend line.
Channel Line Width (widt): The width of the channel line.
Fibonacci Line Width (fibwidt): The width of the Fibonacci line.
Working Mechanism of the Indicator
Logarithmic Source and Regression Channel Calculations:
The indicator takes the logarithm of the price data and calculates the logarithmic regression channel.
It calculates the middle line of the channel, slope, and the starting and ending points.
The standard deviation and the upper/lower boundaries of the channel are determined.
Channel and Fibonacci Levels:
Depending on user preferences, channel lines and Fibonacci levels are drawn on the chart.
Channel lines and Fibonacci levels are dynamically updated based on the slope and price movement.
When the channel is broken, it is displayed with the specified color and style.
Trend Direction and Alert Conditions:
The direction of the trend is determined based on whether the slope is positive or negative.
Alert conditions are defined for trend changes and channel breaks.
Symbols indicating the trend direction are displayed on the chart.
Usage Recommendations
Trend Following: The Hermes Reg Fibonacci V.4 indicator can be used to determine the current trend direction and identify potential trend reversal points.
Support and Resistance Levels: The indicator helps identify support and resistance levels by observing how the price moves within the channel.
Fibonacci Analysis: Fibonacci levels can be used to identify potential retracement and extension points.
Alerts and Notifications: Set alerts for trend changes and channel breaks to avoid missing important price movements.
The Hermes Reg Fibonacci V.4 indicator, with its user-friendly interface and flexible parameters, can be effectively used in different market conditions. By customizing the indicator, you can tailor it to suit your trading strategy.

FuTech V-Spike & V-HighlighterFuTech V-Spike & V-Highlighter
In the context of trading and technical analysis, this volume spike & volume highlighter indicator is the perfect indicator used to assess market activity and make informed trading decisions.
Let's Understand in brief as below :
1) Volume Spike :
A volume spike refers to a sudden, significant increase in trading volume compared to the average volume over a specific period.
This spike can indicate heightened interest in a particular security, often preceding price movements.
Traders may look for volume spikes as signals for potential buy or sell opportunities because they can suggest that a stock is experiencing increased activity, possibly due to news, earnings releases, or other catalysts.
Characteristics of a Volume Spike:
Assess the sudden increase in trading volume.
It Can occur in both upward and downward price movements.
Often compared to the average volume over a defined period (e.g., the last 20 days).
2) Volume Highlighter:
A volume highlighter emphasizes significant changes in trading volume on a price chart. This indicator typically uses color coding to highlight periods of high volume, making it easier for traders to identify volume spikes at a glance.
How this indicator works:
a) Volume Spike will calculate the highest volume spike as per the user defined threshold multiplier. (Multiplier = when volume exceeds a certain threshold)
b) The threshold Multiplier can be set based on a fixed number or as a multiple of the Exponential Moving Average volume. Volume Spike Multiplier default is 1.5, means the EMA volume should cross 1.5 times the user defined lookback period
c) The result is derived from the user defined lookback candles by using its EMA instead of SMA, which will give us more precise results.
d) By default, last 10 candles EMA average is used to calculate the Volume Spike but you can choose your lookback period as many days, weeks, months, years of your choice !
e) In Volume Spike -
- Green candle will show Yellow color Bar as Bullish sentiments, whereas
- Red candle will show Black Bar as Bearish sentiments.
f) Volume Highlighter will highlight the candles background if the highest volume is crossing as per the the user defined lookback period
g) Default Lookback period is 20, Color coding (e.g., Blue for bullish spikes, Red for bearish spikes) helps traders quickly assess the volume context.
h) Volume Highlighter plotting shapes and positions can be modified
Illustration:
From the Above pic,
If last Volume Spike is 10 lookback candles, Spike multiplier is 1.5 and Highlighter lookback candles is 20,
Then yellow candle means the spike in volume which is 1.5 times higher than the last 10 candles
Highlighting color defines the highest volumes trading from the last 20 candles which is either Blue (Bullish) or Red (Bearish) sentiments
Conclusion :
Using FuTech V-Spike & V-Highlighter indicator - will help traders identify potential trading opportunities and better understand market dynamics.
By analyzing volume in conjunction with price movements, traders can make more informed decisions based on market sentiment.
Thank you !
Jai Swaminarayan Dasna Das !
He Hari ! Bas Ek Tu Raji Tha !

Order Flow / Delta Volume IndicatorOrder Flow / Delta Volume Indicator
The Order Flow / Delta Volume Indicator is designed to give traders a comprehensive view of market activity by combining delta volume analysis, order flow imbalances, and momentum filters. This indicator is not just a mashup of components, but a carefully crafted tool that enhances decision-making by integrating various layers of market analysis into one powerful system.
How the Components Work Together:
1. Delta Volume Bars: The core of this indicator, delta volume shows the difference between buy and sell orders, allowing traders to see real-time shifts in market sentiment. Green bars indicate buy-side pressure, while red bars show sell-side dominance. By visualizing this in bar form, traders can easily spot significant shifts in order flow that could signal trend changes or momentum shifts.
2. Cumulative Delta Line (Rescaled): The cumulative delta is rescaled to plot under the price candles, giving traders a clear, contextualized view of how net buyer or seller dominance is developing over time. This line helps identify potential market reversals when price moves diverge from cumulative delta trends.
3. Order Flow Imbalance Detection: Imbalances in buy and sell volumes are automatically detected using a threshold, ensuring that traders are alerted to significant market moves. These imbalances provide insight into aggressive buying or selling behavior, which is crucial for identifying points of high trading activity or potential breakout/reversal zones.
4. VWAP Filter: Volume Weighted Average Price (VWAP) is included as a filter to confirm trend direction. The VWAP ensures that buy signals are only triggered when price action is above the VWAP (indicating strength), and sell signals are triggered when price is below the VWAP (indicating weakness). This ensures that signals are not just based on volume, but also on where price is relative to a critical benchmark.
5. RSI Filter: The inclusion of the Relative Strength Index (RSI) adds a momentum check to the signals. By using RSI, traders can avoid taking trades during low-momentum periods, ensuring they only act when market conditions favor a stronger move.
6. Signal Cooldown Feature: To avoid clutter and noise from frequent signals, this indicator includes a cooldown period between signals, ensuring that traders don’t receive excessive alerts in a short timeframe. This feature prevents overtrading and helps focus on high-quality signals.
Why This Combination is Useful:
• Comprehensive Market Insight: By combining delta volume analysis with order flow imbalance detection, this indicator provides a deep understanding of market sentiment, showing not only price movement but the underlying volume dynamics driving those moves.
• Signal Accuracy: The VWAP and RSI filters ensure that signals are only generated in strong market conditions, filtering out weak or false signals that often occur in choppy markets.
• Divergence Detection: The cumulative delta line provides traders with a tool for spotting divergences between price action and underlying volume, allowing for earlier detection of potential reversals.
This indicator is more than a simple combination of existing tools—it’s a strategic fusion of volume analysis, order flow, and momentum filters designed to provide traders with a clearer view of market activity and to generate more reliable buy/sell signals.
This description explains how the components work together and highlights the indicator’s usefulness, which should address TradingView’s concerns about originality and purpose.

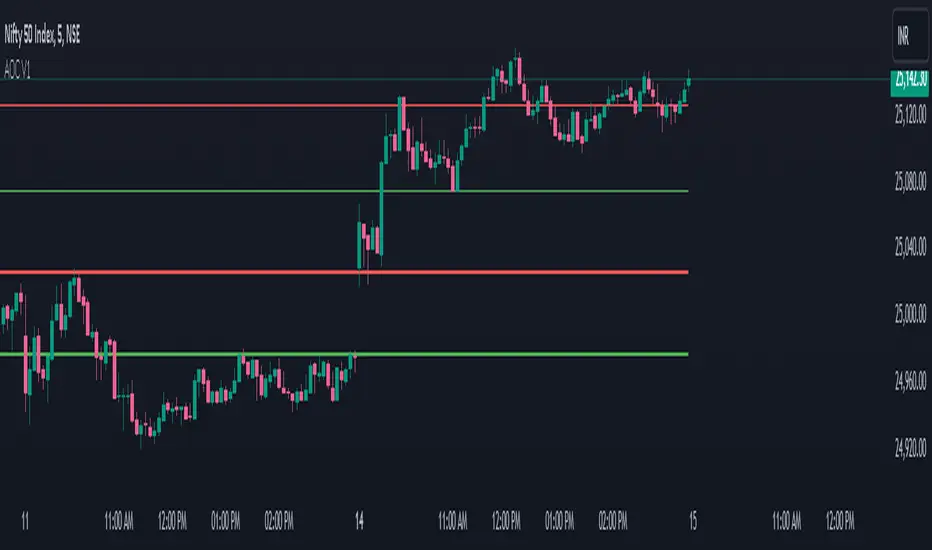
AOC Support & Resistance V1he AOC V1 indicator is designed to plot up to six customizable horizontal price levels on a chart with display options and label customization. This indicator is helpful for marking support (S1, S2, S3) and resistance (R1, R2, R3) levels, often used by traders to analyze market behavior.
Key Features:
Price Level Inputs: Six price levels (R1, S1, R2, S2, R3, S3) can be manually set. These levels are typically used as support and resistance levels.
Display On/Off Toggle: Each price level has an option to be toggled on or off, allowing the user to display only the relevant levels.
Custom Line Style: Users can adjust the color, width, and style (solid, dotted, or dashed) for each line to enhance the chart’s clarity and fit the user's preferences.
Label at Start of the Day: Each price level has a label that shows the price and is placed at the start of the trading day. This helps traders easily identify and track key price levels throughout the session.
Session Control: You can choose to draw the lines either for the entire chart or just for the current day’s trading session. This flexibility allows traders to focus on real-time price movements or broader trends.
Auto-Update: The lines are automatically updated as new bars are formed, ensuring that they stay anchored to the specified price levels.
Inputs:
R1, S1, R2, S2, R3, S3: The specific price levels for the resistance and support levels.
Line Color: Users can customize the line color for each level (Red for resistance levels and Green for support levels by default).
Line Width: The width of the horizontal lines, which can be adjusted from 1 to 5 pixels.
Line Style: The line style can be set to solid, dotted, or dashed, depending on user preference.
Display On/Off: Each level can be individually displayed or hidden by toggling the display option.
This indicator is highly customizable and designed to provide traders with easy-to-interpret visual cues for key price levels in the market.
Trend Filtered Signals with Confidence LevelThe Trend Filtered Signals with Confidence Level is a powerful technical analysis tool designed for trend-following traders. It provides clear buy and sell signals, enhanced by a unique confidence level indicator, helping traders filter out market noise and focus on higher-probability trades. This indicator is built with advanced trend detection, volatility filtering, and volume confirmation, making it suitable for various markets such as stocks, forex, and cryptocurrencies.
Key Features:
Precise Trend Detection:
The indicator uses the Average Directional Index (ADX) to measure the strength of the trend, only generating signals when the trend is strong enough (above a user-defined threshold). This prevents false signals during sideways markets and ensures the system follows meaningful trends.
Buy and Sell Signals:
Buy signals are generated when the price crosses above the fast moving average, and the market is in a strong uptrend based on ADX and other filters. Conversely, sell signals are created when the price crosses below the fast moving average in a strong downtrend. These signals appear directly on the chart with visual markers, making them easy to spot in real-time trading.
Confidence Level for Signals:
Each buy and sell signal is given a confidence percentage, calculated from multiple factors:
The strength of the trend (ADX).
The price’s relationship to moving averages (fast MA and slow MA).
The current trading volume compared to its moving average.
The distance between the price and the moving averages, which is checked against the ATR (Average True Range).
A higher confidence percentage indicates a stronger, more reliable signal. Traders can choose to act only on signals that meet or exceed their preferred confidence level.
ATR-Based Volatility Filtering:
To avoid over-trading or receiving signals that are too close together, the ATR (Average True Range) is used as a volatility filter. This ensures that the signals are spaced out, and traders only receive alerts when the price has moved a meaningful distance, considering market volatility.
Volume Confirmation:
Volume plays a crucial role in signal accuracy. The indicator compares the current volume to its moving average, ensuring that signals are generated only when there is sufficient market participation. This feature helps traders avoid signals during low-volume or illiquid market conditions.
Exit Alerts for Trend Reversals:
The indicator doesn’t just help you enter trades; it also assists with exits. When the trend shows signs of weakening or reversing (such as price crossing back over the moving average or losing ADX strength), the indicator will issue an exit alert, helping traders lock in profits or minimize losses.
How to Use the Indicator:
Choosing Timeframes:
The Trend Filtered Signals with Confidence Level works on multiple timeframes. For intraday traders, it can be applied on 5-minute or 15-minute charts. Swing traders might prefer the 1-hour or daily timeframe to capture longer-term trends. Adjust the inputs based on the volatility of the asset you're trading and the timeframe.
Customizing Inputs:
ADX Length: Defines the length for calculating ADX. A typical setting is 14, but this can be adjusted based on how quickly or slowly you want the indicator to react to changes in trend strength.
ADX Threshold: Set this value to filter out weak trends. The default is 20, but for stronger trend signals, a threshold of 25 or 30 may be more suitable.
ATR Length & Multiplier: Used to calculate the average true range, helping to filter out signals that are too close to each other. The ATR multiplier increases the signal’s precision in volatile markets.
Fast and Slow Moving Averages: These moving averages help define the short- and long-term trend. The default fast MA is 9, and the slow MA is 21, but traders can adjust these based on their strategy.
Volume MA: Defines the length of the moving average applied to volume. A longer setting may be more appropriate for swing trading, while a shorter setting can work better for day trading.
Interpreting the Confidence Percentage:
Signals with a confidence level above 50% are generally considered reliable. However, traders can choose to filter trades based on their risk tolerance by only acting on signals above a certain confidence level (e.g., 70% or higher for conservative traders).
Use the confidence percentage as a guide to increase the likelihood of entering higher-probability trades.
Signal Alerts:
The indicator provides customizable alerts for both buy and sell signals. It also generates alerts when it's time to exit a position due to weakening trend conditions.
Alerts can be set up through TradingView’s alert system to notify you via mobile, email, or browser pop-up, so you never miss an opportunity.
Managing Entries and Exits:
Combine the buy and sell signals with the confidence level to time entries more effectively. After entering a position, keep an eye on the exit signals generated by the indicator to manage your trades.
For trend-following strategies, stay in the trade as long as the indicator shows a strong trend. When the confidence level drops significantly, or the exit alert triggers, it may be time to close the trade.
Inputs Overview:
ADX Length: Default 14, for trend strength.
ADX Threshold: Default 20, minimum trend strength for signal generation.
ATR Length & Multiplier: Adjust for volatility filtering.
Fast MA & Slow MA Lengths: Define the short-term and long-term trend.
Volume MA Length: Confirm signals with volume strength.
Minimum Signal Distance: Prevents excessive signal clustering.
Conclusion:
The Trend Filtered Signals with Confidence Level indicator by Danytradehit is a comprehensive tool that not only identifies trends and trend reversals but also helps you gauge the reliability of each signal through a confidence percentage. It simplifies decision-making for traders by filtering out weak or low-probability trades, ensuring you only act on the most promising market opportunities. This indicator is highly customizable and works across various timeframes and asset classes.

Pivot Volume ConfluenceThe Pivot Volume Confluence indicator is designed to help traders identify significant pivot points (local highs and lows) that are accompanied by increased trading volume. This combination can signal important market turning points and provides valuable insights into potential support and resistance areas.
Key Features:
• Pivot Point Identification: Automatically detects local highs and lows on the chart based on a customizable pivot length.
• Volume Analysis: Compares the volume at the pivot point with the average volume of the last N bars to recognize significant volume spikes.
• Timeframe-Based Adjustment: Automatically adjusts the indicator parameters according to the current timeframe for optimal performance across different timeframes.
• Custom Settings: Allows you to set your own values for pivot length and volume multiplier to tailor the indicator to your trading strategy.
• Visual Markers: Clearly highlights significant pivot points with high volume using colored symbols on the chart.
• Alerts: Integrates alert functionalities to notify you when important pivot points are detected.
Settings:
• Use Custom Settings: Enable this option to use your own parameters instead of automatic adjustments.
• Custom Pivot Length: Set the number of bars to be used for determining pivot points.
• Custom Volume Multiplier: Define the factor by which the average volume is multiplied to set the threshold for significant volume.
• Show Settings in Chart: Displays the current indicator settings directly on the chart.
How to Use the Indicator:
1. Add to Chart:
• Add the “Pivot Volume Confluence” indicator to your desired financial instrument.
2. Adjust Settings:
• Adjust the settings according to your needs or use the preset default values.
• Enable “Use Custom Settings” to input your own values for pivot length and volume multiplier.
3. Interpret the Signals:
• Red downward triangles mark pivot highs with significantly high volume and may indicate potential downward reversal points.
• Green upward triangles mark pivot lows with significantly high volume and may indicate potential upward reversal points.
• Use these markers to identify entry and exit points or to confirm existing trading positions.
4. Set Up Alerts:
• Set up alerts to be notified when a significant pivot point occurs.
• This allows you to react promptly to market movements without having to monitor the chart constantly.
Notes:
• Delay in Pivot Detection: Due to the calculation method, pivot points are recognized only after confirmation by subsequent bars. This leads to a natural delay that should be considered when interpreting the signals.
• Adjusting the Volume Multiplier: A lower multiplier will result in more signals, while a higher multiplier will highlight only the most significant volume spikes.
• Compatibility: The indicator is universally applicable and suitable for various markets such as stocks, forex, commodities, and cryptocurrencies.
• Performance: Using very short timeframes or having many charts open simultaneously may affect performance.
Benefits:
• Deep Market Analysis: By combining price and volume data, you gain a more comprehensive view of market activities.
• Flexibility: The ability to adjust settings allows you to fine-tune the indicator to your specific trading strategy.
• Notifications: With integrated alerts, you won’t miss important signals and can make timely trading decisions.
Disclaimer:
Please note that trading financial instruments involves risks and is not suitable for all investors. Past performance is not indicative of future results. Use this indicator as part of a comprehensive trading strategy and always conduct your own analysis.
VR1 DEMA - Liquidity IdentifierThis custom Pine Script indicator, titled "VR1 DEMA - Liquidity Identifier", is designed to help traders identify periods of significant resistance to price movement, often indicating high liquidity areas where the market may encounter difficulty moving in one direction. The indicator analyzes the relationship between volume and price range, combined with bar volume conditions, to provide enhanced signals of potential liquidity buildup.
Key Features:
Customizable EMA Lengths:
Users can define the lengths of both the fast and slow Exponential Moving Averages (EMAs), with default values of 5 for the fast EMA and 13 for the slow EMA. These EMAs are calculated from the ratio of volume to price range, smoothing the data to detect trends in liquidity.
Dynamic Fast EMA Color:
The fast EMA changes color based on its relationship to the slow EMA:
Red when the fast EMA is above the slow EMA, signaling stronger resistance or greater liquidity.
White when the fast EMA is below the slow EMA, indicating potentially weaker resistance.
Liquidity Signal with Multiplier Condition:
The background of the chart changes to white when the volume-to-price ratio exceeds 1.5 times the fast EMA. This highlights potential areas of liquidity buildup where price movement may encounter stronger resistance. The 1.5 multiplier is adjustable, allowing for sensitivity customization.
Volume Condition for Enhanced Signals:
A new condition is added that requires the actual bar volume to exceed 1.2 times the 5-period EMA of average bar volume. This ensures that the background color only changes when there is not only increased liquidity but also significantly higher trading volume. The 1.2 multiplier is user-adjustable for further refinement.
Combined Liquidity and Volume Filtering:
Both conditions (volume-to-price ratio and actual volume) must be met for the background color to change. This double-filtering helps traders spot moments of unusual market activity more accurately.
Optional Volume/Price Range Visualization:
An optional plot of the volume-to-price ratio is included, providing a visual representation of how volume interacts with price movement in real-time. This can be enabled or disabled based on user preference.
User-Friendly Customization:
The script includes inputs for adjusting the fast and slow EMA lengths, as well as the multipliers for the volume-to-price ratio and actual volume conditions. These customizable parameters allow traders to tailor the indicator to their specific market strategies.
Use Case:
This indicator is particularly useful for identifying periods of high liquidity and resistance in the market, where price movement may stall or reverse. By combining volume-to-price ratio analysis with actual volume conditions, the indicator provides more reliable signals for detecting potential breakouts, reversals, or consolidation periods. The color-coded fast EMA and background shading make it easy to spot key moments of increased market activity and liquidity.
The real breakout indicator CCI + Money Flow + Buy / SellComponents of the indicator
1. CCI (Commodity Channel Index)
The CCI component measures the deviation of the price from its statistical average. It is used to identify overbought or oversold conditions and is integrated into the trend logic to determine potential trend reversals. High values may indicate overbought conditions, while low values could signify oversold situations.
Detailed
The CCI (Commodity Channel Index) used in "The Real Breakout Indicator Hawk" is an enhanced version compared to the traditional CCI, offering several advantages:
1. Weighting and Smoothing Mechanism
In this version, the CCI values are weighted and smoothed using custom parameters (c1, c2, c3), which allows for greater flexibility in adjusting the sensitivity of the CCI to market conditions. This smoothing reduces noise and provides clearer signals compared to the standard CCI, which can be prone to whipsaws in volatile markets.
2. Multi-level Calculation
The indicator uses an array-based approach to calculate multiple variations of CCI values (with p as the parameter for different levels of calculation), which is then combined to create a more robust signal. This multi-level approach allows for capturing different market cycles, unlike the traditional CCI that only uses a single period for calculation.
3. Integration with Moving Averages and Trend Detection
Unlike the original CCI, which is often used in isolation, this version integrates with the trend detection logic by combining it with moving averages and money flow. The enhanced CCI contributes to the broader trend analysis, ensuring that buy/sell signals are not just based on CCI overbought/oversold levels but also validated by moving averages and slope calculations.
4. Trend-Weighted CCI
This version adds weight to recent price action trends, making it more adaptive to current market momentum. The CCI values are influenced by recent high and low prices, adding a trend-following aspect that is missing from the original CCI, which treats all price deviations equally.
This image of EURAD shows for example that when CCI component is green a strong trend is detected which can hold for up to 10 days in this example, ideal for swing trades;
EURAUD 2H
5. Improved Overbought/Oversold Detection
The script incorporates a dynamic overbought/oversold detection zone based on the enhanced CCI. It accounts for market volatility, allowing it to adjust its thresholds (such as the 200 level) more effectively in different market environments. This makes the enhanced CCI better suited for varying market conditions compared to the fixed thresholds of the original CCI.
You can see that the red diamond signal is generated at the absolute top of the price range after which price started to reverse, the detection is based on a cross over value together with Money Flow strength
BTCUSDT 2H
6. Strong Buy/Sell Confirmation
The enhanced CCI works in tandem with other components like Money Flow and Moving Averages to confirm buy or sell signals. This cross-validation makes the indicator less reliant on CCI alone and ensures that the signals generated are stronger and less prone to false positives, which is a common issue with the standalone CCI.
The green diamond buy signal in a strong downtrend is mostly a short retrace of price before continuing down further, yo can use this as an entry signal after the bounce up into an FVG for example. However when price is at a support, meaning price is not moving down further and this occurs this could be a potential reversal signal as shown on the right side on the chart below. FVG is not respected, retested and price continues up.
BTCUSDT 2H
Summary:
In summary, the enhanced CCI in this indicator improves over the original CCI by providing better noise reduction, multi-level analysis, trend integration, and adaptability to different market conditions. These improvements lead to more reliable and actionable trading signals.
2. Money Flow (MF) www.tradingview.com
The Money Flow component tracks the flow of capital in and out of an asset. Positive values indicate strong buying pressure, while negative values show selling pressure. This is smoothed to avoid noise and is used to confirm strong buy or sell conditions.
The Money Flow (MF) in "The Real Breakout Indicator Hawk" measures the flow of capital into or out of an asset, helping to assess the underlying buying or selling pressure in the market.
1. Positive Money Flow (Buying Pressure)
When the MF is positive, it indicates that more money is flowing into the asset, which suggests strong buying interest. This helps confirm that a price increase or breakout to the upside is supported by demand.
2. Negative Money Flow (Selling Pressure)
A negative MF indicates that capital is leaving the asset, reflecting selling pressure. This is a sign that the market is under bearish conditions, and prices are likely to decline or break down.
3. Confirmation of Buy and Sell Signals
The MF is used to confirm buy and sell signals generated by other components of the indicator. When the MF aligns with other bullish signals, it strengthens the buy condition, and similarly, when the MF shows strong selling pressure, it reinforces a sell signal.
4. Filtering Noise
The MF is smoothed to filter out noise, ensuring that only significant movements in buying or selling pressure are considered. This helps avoid false signals and makes the MF a reliable tool for detecting true market strength.
5. Range Sensitivity
The MF operates within defined ranges, ensuring that buy or sell signals are only triggered when the flow of money is strong enough, adding precision to signal generation.
In summary, the Money Flow component is crucial for validating market direction, enhancing signal reliability, and helping traders make more informed decisions based on the underlying capital movement in the market.
3. Moving Averages (MA)
Multiple types of moving averages (SMA, EMA, HMA, etc.) are used to smooth price action and highlight the trend direction. The script supports different types of moving averages, and their slopes are calculated to assist in identifying changes in trend momentum.
The Moving Averages (MA) section of "The Real Breakout Indicator Hawk" plays a critical role in smoothing price data, identifying trends, and generating buy/sell signals. Here’s a breakdown of what it does and how you can use it effectively without diving into the script:
1. Moving Average Types
This section allows the user to choose from different types of moving averages, each with unique characteristics:
SMA (Simple Moving Average): Takes the average of closing prices over a specific period. It’s slower and better suited for detecting long-term trends.
EMA (Exponential Moving Average): Gives more weight to recent prices, making it more responsive to new price action and suitable for short-term trading.
HMA (Hull Moving Average): A smoother and faster moving average, useful for reducing lag in fast-moving markets.
LVMA (Linear Weighted Moving Average): Places the most weight on recent prices, making it even more responsive than EMA.
Alma (Arnaud Legoux Moving Average): A smoother version that reduces noise while maintaining responsiveness to recent price action.
2. Smoothing and Trend Detection
The moving average smooths out price data to remove small fluctuations and focuses on the overall trend. When prices are trading above the moving average, it suggests that the market is in an uptrend. When prices are below the moving average, it indicates a downtrend.
3. Trend Confirmation
The moving average serves as a confirmation tool. When the price crosses above the moving average, it could signal the start of a bullish trend, and when the price crosses below, it may indicate the beginning of a bearish trend.
4. Buy and Sell Signals
Buy Signal: The system detects a buy signal when:
The moving average crosses above 0, indicating a potential upward momentum.
Other indicators like Money Flow and CCI align to confirm the trend.
Sell Signal: A sell signal is triggered when:
The moving average crosses below 0, signaling a potential downtrend.
This signal is further validated by other components such as Money Flow and CCI to reduce false signals.
5. Using Moving Averages in Trading
Crossover Strategy: One of the simplest ways to use moving averages is by employing a crossover strategy. For instance:
When the shorter-term moving average (e.g., 20-period) crosses above a longer-term moving average (e.g., 50-period), this is a bullish crossover, indicating a buy signal.
Conversely, when the shorter-term moving average crosses below the longer-term moving average, this is a bearish crossover, indicating a sell signal.
Trend Following: If you’re trading with the trend, you can use a moving average to stay in the trade as long as the price remains above (for long positions) or below (for short positions) the moving average.
Support and Resistance: Moving averages can also act as dynamic support or resistance levels. For example, in an uptrend, the CCI might bounce off the moving average, offering a good entry point for a long position. In a downtrend, the moving average could act as resistance where prices may reverse, offering a shorting opportunity.
To use the MA section effectively:
Choose the right type of moving average based on your trading style (e.g., use EMA for faster response or SMA for long-term trends).
Watch for crossovers as buy/sell signals, especially in combination with other indicators.
Follow the trend by observing whether the price is above or below the moving average.
Use the moving average as a dynamic support/resistance level to find optimal entry/exit points.
This approach makes the moving average a versatile tool for identifying trends, refining entry and exit points, and confirming overall market direction.
an example when MA crosses below 0, keep in mind that when it it starts curving up and turning green there is a reversal brewing, this could take time...
BTCUSDT 2H
4. Buy Signals
Buy signals are generated when the moving average crosses up, and the Money Flow and other trend-based conditions are met, including CCI levels confirming the strength of the breakout. Additionally, slope calculations and other momentum indicators provide extra confirmation for entries.
5. Sell Signals
Sell signals occur when the moving average crosses down, combined with negative Money Flow, confirming downward pressure. Other trend-based conditions, including the CCI, must also align to validate the signal, and slope calculations ensure that momentum is on the sell side.
6. Slope and Trend Detection
The script includes calculations for the slope of price action over a lookback period to measure trend strength and direction. The slope is normalized to help identify when the market is gaining or losing momentum. This slope is used in conjunction with the moving averages and Money Flow to give more accurate trend signals.
The Slope and Trend Detection component in "The Real Breakout Indicator Hawk" is designed to measure the direction and strength of the market’s trend by calculating the slope of the price action over a specific period. This helps to identify whether the market is gaining or losing momentum, and it is a key element in refining buy/sell signals.
Here’s how the Slope and Trend Detection works and how you can use it effectively without diving into the script:
1. Slope Calculation
Slope is essentially the rate of change of the moving average (or price) over a given number of bars. It measures how steeply the price is moving up or down.
The script calculates the slope by measuring the difference between the moving average over a defined number of bars (e.g., 12 bars in this case). A larger slope indicates a stronger trend, while a smaller slope suggests a weaker or consolidating trend.
2. Normalized Slope
The slope is normalized, meaning it is adjusted to fall within a range that makes it easier to compare across different time frames and markets. This normalization helps to gauge whether the slope is strong or weak relative to historical data.
Positive slopes (above 0) indicate an uptrend or rising price momentum, while negative slopes (below 0) indicate a downtrend or falling price momentum.
3. Trend Detection
The slope of the moving average is used to detect the current trend:
If the slope is positive, the market is in an uptrend.
If the slope is negative, the market is in a downtrend.
The stronger the slope (the steeper it is), the stronger the trend. A small slope indicates a weak trend or consolidation.
4. Slope Thresholds
The system uses thresholds to determine the significance of the slope. These thresholds are set as upper and lower bounds:
Upper Threshold: If the slope exceeds this threshold, the trend is considered strong, and it could trigger a buy signal.
Lower Threshold: If the slope falls below this threshold (into the negative range), it indicates a strong downtrend, and it could trigger a sell signal.
These thresholds help filter out weak or false signals that occur in sideways or low-momentum markets.
5. Positive and Negative Slope Arrays
The system keeps track of both positive and negative slopes over a defined lookback period (e.g., 500 bars). By storing these values, it creates a historical context that helps to assess the current slope in relation to past price movements.
It calculates the standard deviation and the average of these slopes to dynamically adjust the thresholds for each market condition, making the trend detection more adaptive to different types of assets or market phases.
6. Using Slope and Trend Detection in Trading
Buy Signal with Positive Slope: When the slope is positive and exceeds a certain threshold, it confirms that the market is in a strong uptrend. This can be used as a signal to enter a long position or add to existing long trades.
Sell Signal with Negative Slope: When the slope turns negative and falls below the lower threshold, it signals a strong downtrend, indicating a potential short-selling opportunity or the time to exit long positions.
Avoiding Flat Markets: If the slope remains close to zero (neither strongly positive nor negative), it suggests a lack of clear trend or a consolidating market. In these conditions, it might be better to avoid taking new trades or use additional filters to confirm signals.
7. Slope-Based Trend Strength Indicator
You can also use the slope as a measure of trend strength:
Strong Trend: When the slope is steep (either positive or negative), it indicates strong momentum, and you can be more confident in holding a trade in that direction.
Weak Trend or Consolidation: When the slope is flat, it indicates weak price momentum, which may signal a period of consolidation or indecision in the market.
8. Visual Representation
The slope is often visually represented as a gradient or line that fluctuates around a central point (usually zero). Positive values are shown in one color (e.g., green for an uptrend), while negative values are shown in another color (e.g., red for a downtrend). This allows traders to quickly identify the current trend direction and its strength.
Summary:
To use Slope and Trend Detection effectively:
Monitor the slope to determine the trend direction (positive = uptrend, negative = downtrend).
Look for thresholds to identify strong trends. For instance, a steep positive slope signals a strong uptrend, while a steep negative slope signals a strong downtrend.
Use slope changes to confirm buy/sell signals. For example, if you receive a buy signal and the slope is positive and increasing, it confirms that momentum is behind the trade.
Avoid low-slope periods when the slope is close to zero, indicating a lack of trend or sideways market conditions.
This approach helps traders stay on the right side of the trend while avoiding periods of low momentum, enhancing the accuracy of trade signals.
7. Banker Fund Flow Trend
This component identifies potential large institutional moves by tracking specific patterns in price and volume data. When the institutional or "banker" entry or exit conditions are met, it highlights these moments with candles and generates alerts.
The Banker Fund Flow Trend in "The Real Breakout Indicator Hawk" helps detect the flow of institutional (or "smart money") into and out of the market by tracking price trends and large player activity. It uses red and yellow candles to signal when institutional money is influencing the market.
Key Points:
Yellow Candles (Banker Entry):
A yellow candle is plotted when institutional money starts flowing into the market.
This signals a potential buy opportunity, as large market players are likely pushing prices upward.
Red Candles (Banker Exit):
A red candle appears when institutional money starts exiting the market.
This is a signal to consider selling or exiting long positions, as institutional selling could drive prices lower.
Usage:
Yellow candles: Use these as signals to enter long trades or add to existing positions, confirming upward momentum driven by institutional buyers.
Red candles: Treat these as signals to exit long trades or consider short positions, as institutional selling may lead to further downside.
BTCUSDT 2H
The yellow and red candles provide clear, actionable signals for aligning trades with institutional flows, ensuring you’re following the "smart money."
8. Dynamic Buy/Sell Calculations
A dynamic component is designed to refine the buy and sell signals further based on additional conditions like price patterns, volatility, and Money Flow. This ensures that signals are more responsive to changing market conditions.
The Dynamic Buy/Sell Calculations in "The Real Breakout Indicator Hawk" are designed to refine entry and exit points for trades by using additional conditions beyond simple crossovers. These calculations adapt to the current market conditions, making them more responsive to changes in volatility, trend strength, and momentum.
Key Features:
Dynamic Buy Calculation:
The indicator generates a buy signal when multiple conditions align. These conditions include the money flow (MF) being within a favorable range, the moving average (MA) confirming upward momentum, and the CCI and other trend components indicating strength.
This makes the buy signal more reliable, as it considers multiple aspects of market behavior (price, momentum, and money flow) to avoid false entries.
Dynamic Sell Calculation:
Similarly, the sell signal is triggered when the dynamic conditions indicate downward momentum.
This includes:
The moving average crossing down.
Negative money flow, suggesting selling pressure.
Other trend signals confirming a bearish move.
The dynamic nature of these conditions ensures that sell signals are only generated when there’s a high probability of continued downside movement.
Adaptive to Market Conditions:
The dynamic nature of these calculations means that the buy/sell signals adapt to market changes, like volatility spikes or sudden trend reversals. Instead of relying on static conditions, the system adjusts to current price movements and volatility.
Avoiding Noise:
By adding multiple filters like MF thresholds, slope, and moving averages, the dynamic calculations help reduce false signals that occur in noisy, sideways markets. This helps traders avoid entering trades during periods of low momentum or unclear trends.
How to Use:
Buy Signals: Use these signals to enter long trades when the dynamic conditions align, confirming that upward momentum is strong and backed by institutional flows.
BTCUSDT 2H
Aqua marker/cross signals (price manipulation/continuation)
BTCUSDT 2H
Sell Signals: Use the sell signals to exit long positions or enter short trades when the market shows signs of bearish momentum, confirmed by multiple conditions like MA crossovers and negative money flow.
BTCUSDT 2H
In summary, the Dynamic Buy/Sell Calculations provide a more sophisticated approach to generating trade signals by combining various trend and momentum indicators, helping traders make more informed decisions in different market conditions.
This part of the code is identifying two key trading signals: moments to buy and moments to sell based on the behavior of a calculated trend line.
Buy Condition:
The system looks for a situation where the trend has been moving downward but has started to reverse upward. Specifically, it checks if the trend was declining a little while ago, then stopped falling, and is now starting to rise. If these conditions are met and the trend is still below a certain level, the system considers this a possible time to buy.
Sell Condition:
The opposite happens for selling. The system monitors for a situation where the trend has been moving upward but starts to turn downward. It checks if the trend was rising, leveled off, and now seems to be starting to fall. If these conditions are met and the trend is above a certain level, this could indicate a good time to sell.
Visual Markers:
To help the user easily see these signals on a chart, the system places symbols at specific points. A marker appears on the chart where the conditions for buying or selling are met, allowing the trader to quickly spot potential entry or exit points in the market.
In summary, this logic is designed to detect possible changes in trend direction and signal appropriate times to consider buying or selling, with clear visual markers on the chart for quick identification.
9. Alerts for Buy and Sell
The indicator provides built-in alert conditions for both buy and sell signals. When these conditions are met, the system generates alerts, making it suitable for automated monitoring.
Each of these components works together to detect potential breakout opportunities, trend continuations, and reversals, making the indicator suitable for both short-term and long-term trading strategies.

Price-Volume w Trendline - Strategy [presentTrading]█ Introduction and How it is Different
The Price-Volume with Trendline Strategy is an innovative strategy that combines volume profile analysis, price-based Z-scores, and dynamic trendline filtering to identify optimal entry and exit points in the market. What sets this strategy apart is the integration of volume concentration (Point of Control or PoC) with dynamic volatility thresholds. Additionally, this strategy introduces a multi-step take profit (TP) mechanism that adjusts based on predefined levels, allowing traders to exit trades progressively while capitalizing on market momentum.
BTCUSD 6hr LS Performance
█ Strategy, How it Works: Detailed Explanation
The combination of multiple indicators and methodologies serves to create a more robust and reliable trading system. Each element is carefully chosen for its complementary role in providing accurate signals while minimizing false entries and exits. Here’s why the different components were chosen and how they work together:
- PoC and Z-Scores: The volume profile identifies key price areas, while the Z-score measures deviations from the mean. Together, they highlight points where the market is likely to react. For example, when the Z-score indicates an oversold condition near a PoC support level, it increases the probability of a reversal, providing a clear entry signal.
- Trendlines and Z-Scores: Trendlines serve as a secondary filter to ensure that price deviations identified by Z-scores align with broader market trends. This ensures that trades are only entered when the price has both deviated from its average and broken through a significant trendline level, reducing the likelihood of false signals.
- Multi-Step TP and Risk Management: Finally, the multi-step take profit logic works in tandem with the entry signals generated by the PoC, Z-scores, and trendlines. As the price moves in favor of the trade, profits are gradually locked in, ensuring the trader captures gains while still leaving room for further upside.
🔶 Point of Control (PoC) and Volume Profile Analysis
The PoC identifies the price level with the highest volume concentration within a specified lookback period. This price level represents where the most trading activity has occurred, often acting as a strong support or resistance. By breaking down the range into several rows (bins), the strategy identifies how much volume was traded at each price level.
🔶 Z-Score Calculation
The Z-score is a statistical metric that measures how far the current price is from its mean, expressed in terms of standard deviations. This is calculated both for price deviation and PoC-based deviation.
🔶 Trendline Breakout Filtering
The trendline filtering is a crucial aspect that refines entry signals by confirming trend continuation or reversals. It calculates trendlines based on pivot highs and lows using the selected method (e.g., ATR or standard deviation).
🔶 Multi-Step Take Profit
The multi-step take profit mechanism allows the strategy to take partial profits at several predefined levels. For example, when the price reaches 3%, 8%, 14%, or 21% above (or below) the entry price, it exits portions of the position. This is a useful technique for locking in profits as the market moves favorably.
Local
█ Usage
The Price-Volume with Trendline Strategy can be applied to various asset classes, including stocks, cryptocurrencies, and commodities. It is particularly effective in volatile markets where price deviations and volume concentrations signal potential reversals or trend continuations. By adjusting the settings for volatility and the lookback period, this strategy can be tailored to both short-term intraday trades and longer-term swing trades.
█ Default Settings
The default settings in the strategy play a vital role in shaping its performance.
- POC_lookbackLength (144): This defines the number of bars used to calculate the PoC. A longer lookback captures more data, leading to a more stable PoC, but may result in delayed signals. A shorter lookback increases responsiveness but may introduce noise.
- priceDeviationLength (200): This determines the period for calculating the standard deviation of price. A higher length smooths out the volatility, reducing the likelihood of false signals. Shorter lengths make the strategy more sensitive to sudden price movements.
- TL_length (14): Controls the swing detection period for trendline calculation. A shorter length will generate more frequent trendline breakouts, while a longer length captures only significant moves.
- Stop Loss and Take Profit: The strategy offers both fixed and SuperTrend-based stop losses. SuperTrend is adaptive to volatility, while fixed stop losses provide simpler risk control. The multi-step take profit ensures that profits are secured progressively, which can improve performance in trending markets by reducing the risk of full reversals.
Each of these settings can significantly affect the strategy’s risk-reward balance. For instance, increasing the stop loss level or the take profit percentages allows the strategy to stay in trades longer, potentially increasing profit per trade but at the cost of larger drawdowns. Conversely, tighter stops and smaller profit targets result in more frequent trades with lower average profit per trade.

Cumulative Net VolumeCumulative Calculation: Summarizes the net volume (buying minus selling volume) cumulatively, providing a running total that reflects the aggregate trading pressure.
Custom Timeframe Flexibility: Users can choose to analyze the volume on a custom timeframe, enhancing adaptability for various trading strategies.
Color-Coded Visualization: Features an intuitive color scheme where green indicates a net buying dominance and red signals net selling dominance, making it easier to interpret shifts in market dynamics.
Versatility: Suitable for all types of assets available on TradingView including cryptocurrencies like Bitcoin, stocks, forex, and more.
Utility: This tool is particularly useful for identifying trends in buying or selling pressure, which could be pivotal during significant market events or when assessing the potential for a trend reversal. By understanding the accumulation and distribution phases through the cumulative net volume, traders can make more informed decisions.
Perfect for both novice traders looking to get a grip on volume analysis and seasoned professionals seeking an edge in their trading tactics.
VSA Wyckoff Volume with Bubbles Introducing the "VSA Wyckoff Volume" indicator—a powerful tool for traders who want to visualize and analyze market volume with precision. This indicator leverages Volume Spread Analysis (VSA) and Wyckoff principles to categorize volume into six distinct levels: Ultra High, Very High, High, Normal, Low, and Very Low. Each level is represented by a color-coded bubble on the chart, with bubble sizes adjusted according to the volume intensity. Additionally, the indicator incorporates an ATR-based positioning system, ensuring that each bubble is placed accurately on the chart for easy interpretation. Whether you're an experienced trader or new to the market, this indicator provides clear insights into market activity, helping you make more informed trading decisions.
Volume Spread Analysis (VSA) is a trading methodology that analyzes the relationship between volume, price, and the spread (range) of a price bar. It was developed by Tom Williams, who combined his experience as a trader with principles derived from Richard D. Wyckoff's work on market manipulation.
Key Concepts of VSA:
Volume: The amount of a particular asset traded during a specific time period. In VSA, volume is a key indicator of market activity and is used to understand the strength or weakness behind price movements.
Spread: The range between the high and low of a price bar. The spread, when analyzed in conjunction with volume, can indicate whether the market is being driven by strong or weak hands.
Price: The actual value at which an asset is traded. VSA looks at price in relation to volume and spread to identify the intentions of smart money (large institutional traders).
How VSA Works:
VSA aims to uncover the footprints of smart money by analyzing the volume and price spread. The core idea is that significant price movements accompanied by high volume indicate the involvement of professional traders, while price movements on low volume might suggest that the move lacks conviction or is driven by retail traders.
VSA in Practice:
High Volume, Narrow Spread: This could indicate supply coming into the market as professional traders sell into the buying pressure, leading to potential price weakness.
High Volume, Wide Spread, Price Up: This often suggests strong buying interest, with smart money pushing prices higher.
Low Volume, Wide Spread: A sign of a potential weak market, where price is moving without strong participation, indicating that the move may not be sustainable.
Applications:
VSA is particularly useful for identifying potential turning points in the market, understanding market sentiment, and anticipating future price movements based on the actions of smart money. Traders who use VSA often combine it with other technical analysis tools to build a comprehensive trading strategy.
Your "VSA Wyckoff Volume" indicator, by categorizing volume into distinct levels and visualizing it on the chart, provides an enhanced way to apply VSA principles and understand the underlying market dynamics.

BX-Volume Trend and OscillatorBX-Volume Trend and Oscillator (VTO)
This is my second indicator. I created this indicator for myself. I was inspired by the indicators created by Bjorgum, Duyck and QuantTherapy and decided to create multiple indicators that either work well combined with their indicators or something new that applies some of their indicator concepts. I decided to share this because I believe in learning and earing together as a community. I will later share the rest of the indicators I have created. If you guys have any questions or suggestions write them.
The BX-Volume Trend and Oscillator (VTO) is a comprehensive trading indicator designed to help traders identify trends, momentum shifts, and potential reversals by analyzing volume and price action through various metrics. This indicator combines relative volume analysis with custom Xtrender oscillators and moving averages to provide valuable insights into market behavior.
Image: BX-Volume Trend and Oscillator (VTO)
Features:
Relative Volume Analysis: Measures the current volume relative to the average volume over a specified period, helping traders understand if the current trading activity is unusually high or low.
Short-Term Xtrender Oscillator: This oscillator analyzes the difference between two short-term Exponential Moving Averages (EMAs) and smooths it with a custom RSI, highlighting short-term trends and potential reversal points.
Long-Term Xtrender Oscillator: Similar to the short-term oscillator but uses longer-term EMAs and RSI for identifying more sustained trends and shifts.
T3 Moving Average: A smoothed version of the Xtrender oscillator that helps in detecting trend changes more clearly.
Volume Trend Plot: Shows the smoothed relative volume to understand how trading activity aligns with the trend.
Visual Indicators: Uses colors and shapes to highlight significant changes and trends, such as circles to mark potential reversal points.
How to Use the Indicator
Analyze Relative Volume:
Relative Volume Plot: The smoothed relative volume is displayed in white, helping you assess if current trading volumes are above or below the historical average.
High Relative Volume: Indicates strong trading interest, which could support or contradict the prevailing trend.
Image above: is set to daily timeframe
Monitor Short-Term Xtrender Oscillator
Short-Term Xtrender: Plotted as a column histogram with colors changing from green to red based on the oscillator's movement and momentum. Green and lime colors indicate bullish trends, while maroon and red suggest bearish conditions.
Smoothed Short-Term Xtrender (T3): Plotted as a line that adjusts color based on the short-term Xtrender's trend. The line changes color to match the histogram's color, providing a clearer view of momentum shifts.
Reversal Markers: Small circles indicate potential short-term trend reversals, where changes in the T3 moving average suggest shifts in momentum.
Assess Long-Term Xtrender Oscillator:
Long-Term Xtrender: Plotted as a histogram, with color changes similar to the short-term Xtrender. It shows longer-term trends and shifts.
Color Indicators: Lime and green colors suggest an uptrend, while red and maroon indicate a downtrend.
Look for Zero Line Crossings:
The zero line serves as a reference point. Crossings above the zero line may indicate bullish trends, while crossings below may signal bearish trends.
Image above: is set to daily timeframe, and it showcases the Short-Term Xtrender (T3) applied.
Image above: is set to 8hr timeframe: Using the lower timeframe you can spot better details of pullbacks and potential reversals.
Example of Use:
Identify Trend and Momentum: Use the combination of the short-term and long-term Xtrender oscillators to gauge the prevailing market trend. For instance, if both oscillators are above zero and showing upward momentum, it suggests a strong bullish trend.
Spot Reversals: Observe the short-term Xtrender and its smoothed T3 version. If the T3 line changes direction and crosses through previous peaks and troughs, it could signal a potential reversal.
Volume Confirmation: Check the relative volume and its smoothed version to confirm the strength of price movements. Significant changes in volume can validate the trends indicated by the Xtrender oscillators.
By combining these elements, the BX-Volume Trend and Oscillator (VTO) provides a holistic view of market dynamics, helping traders make more informed decisions based on trend strength, potential reversals, and volume activity.
Lastly, my Scripts/Indicators/Ideas /Systems that I share are only for educational purposes!

Rsi Long-Term Strategy [15min]Hello, I would like to present to you The "RSI Long-Term Strategy" for 15min tf
The "RSI Long-Term Strategy " is designed for traders who prefer a combination of momentum and trend-following techniques. The strategy focuses on entering long positions during significant market corrections within an overall uptrend, confirmed by both RSI and volume. The use of long-term SMAs ensures that trades are made in line with the broader market trend. The stop-loss feature provides risk management by limiting losses on trades that do not perform as expected. This strategy is particularly well-suited for longer-term traders who monitor 15-minute charts but look for substantial trend reversals or continuations.
Indicators and Parameters:
Relative Strength Index (RSI):
- The RSI is calculated using a 10-period length. It measures the magnitude of recent price changes to evaluate overbought or oversold conditions. The script defines oversold conditions when the RSI is at or below 30 and overbought conditions when the RSI is at or above 70.
Volume Condition:
-The strategy incorporates a volume condition where the current volume must be greater than 2.5 times the 20-period moving average of volume. This is used to confirm the strength of the price movement.
Simple Moving Averages (SMA):
- The strategy uses two SMAs: SMA1 with a length of 250 periods and SMA2 with a length of 500 periods. These SMAs help identify long-term trends and generate signals based on their crossover.
Strategy Logic:
Entry Logic:
A long position is initiated when all the following conditions are met:
The RSI indicates an oversold condition (RSI ≤ 30).
SMA1 is above SMA2, indicating an uptrend.
The volume condition is satisfied, confirming the strength of the signal.
Exit Logic:
The strategy closes the long position when SMA1 crosses under SMA2, signaling a potential end of the uptrend (a "Death Cross").
Stop-Loss:
A stop-loss is set at 5% below the entry price to manage risk and limit potential losses.
Buy and sell signals are highlighted with circles below or above bars:
Green Circle : Buy signal when RSI is oversold, SMA1 > SMA2, and the volume condition is met.
Red Circle : Sell signal when RSI is overbought, SMA1 < SMA2, and the volume condition is met.
Black Cross: "Death Cross" when SMA1 crosses under SMA2, indicating a potential bearish signal.
to determine the level of stop loss and target point I used a piece of code by RafaelZioni, here is the script from which a piece of code was taken
I hope the strategy will be helpful, as always, best regards and safe trades
;)
