Intrabar OBV/PVTI got this idea from @fikira's script Intrabar-Price-Volume-Change-experimental
The indicator calculates OBV and PVT based on ticks. Since, the indicator relies on live ticks, it only starts execution after it is put on the charts. The script can be useful in analysing intraday buy and sell pressure. Details are color coded based on the values.
Data is presented in simple tabular format.
Formula for OBV and PVT can be found here:
www.investopedia.com
www.investopedia.com
Price Volume Trend (PVT)

Monkey D Luffy RSI+SMA OscillatorIts a basic rsi sma crossover indicator
you can use in any market
just adjust settings to your preference
M.Right_Relative Volume and PVT (cc)Hello Traders,
I hope you're all doing well and enjoying your holiday!
Today I am releasing a Relative Volume and Price Volume Trend indicator that will help traders assess current price action based on its volume and trend.
Volume is one of the most important aspects of trading that is often overlooked by new traders. Generally, when the volume is higher than normal, something is happening with said equity. Whether that's selling or buying volume it shows importance.
The higher the volume the higher the interest of traders in the equity, so a sudden increase in volume relative to its average volume (relative volume) can cause an increased probability that the price will move.
Relative volume is very self-explanatory , it’s the volume relative to its average. In this indicator, I use several different average calculations to give the trader a clear picture of where the volume stands and added a few different trends using these averages. One is a modified Price Volume Trend.
PVT or Price Volume Trend is a momentum-based indicator that measures money flow in relation to volume. It is usually used to confirm trends, but can be used as a trading signal; as I’ve created some in here. I didn’t added divergences, but using divergences in PVT is another strong way to use it. PVT tends to mirror the market price movements; hence, confirm trends.
You will find this indicator to be jam packed full of features.
-Fully customizable: colors, shapes, lines, on/off toggles for everything.
-Includes:
---Relative Volume Wave.
---Shadow Waves that can help with trend confirmation.
---Vibrant Relative Price Spike in the forefront.
---Additional Volume Trend on bottom of volume bars
---Stat box: showing the Current, Average, and Relative volume on the current user selected timeframe.
---Signals.
---Alerts: prefilled.
Enjoy!
Please add a thumbs up if you like this and follow the instructions for access.
Leave any other questions in the comments section.
Cheers,
Mike

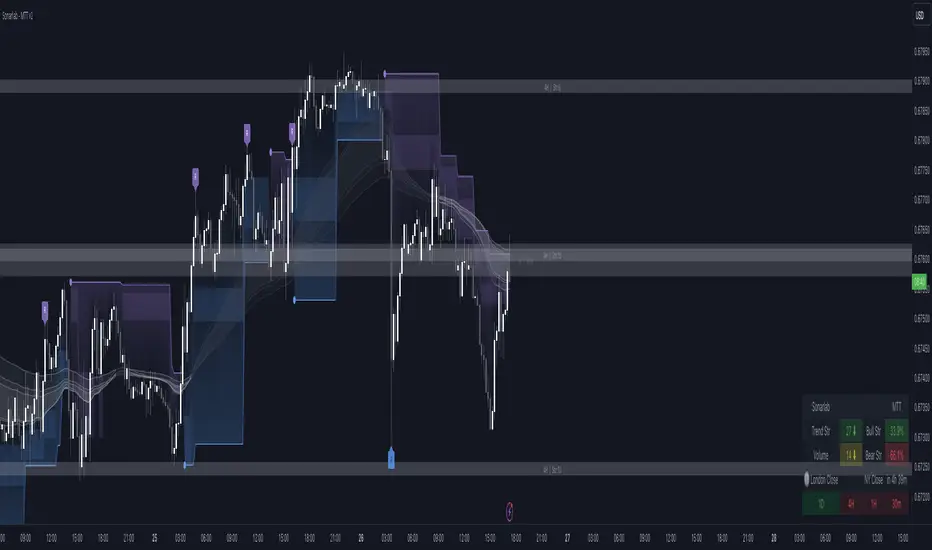
Multi Trend Tool - SonarlabVersion 1 (releasing new updates every 2 weeks
The Sonarlab Liquid Script included a lot of indicators at once, so you have all the tools you need in hand reach.
Features:
01_ Revision Band (Reversal Cloud)
The reversal cloud can be used for many options. These zones can be great areas to take profit or find early entries to use alongside the confirmation or contrarian signals.
02_Supply & Demand Levels / Imbalances (still need some improvement)
The driving force behind changes in price is supply and demand. When there are more buyers than sellers, the market price will move up. Conversely, when there are more sellers than buyers, the market price will move down. When buyers and sellers are more or less even, the market will range. Know where the world’s biggest buyers & sellers are entering and exiting their trades, so you can too.
03_Support and Resistance (Multi Timeframe)
04_Trading Dashboard
Get a quick overview of the current market situation.
- Multi Timeframe Trend Structures
- Volatility %
- Trend Strength %
- Directional Bias: Strong/ Weak/ Neutral
- Trading Sessions
05_Imbalances
See Imbalances within a wink of an eye. Draw them out and make better decisions using those zones (those zones needs to be filled.)
06_Filter options
Filter the signals with Moving averages or with a second trend structure
07_Trend Lines
08_Pivot Highs and Lows
09_Alerts
Even the option to automate the signals true 3Commas (Please wait for our Strategy version of this indicator before using this function).
10_Reduce Risk/ Exit Points
Grey circles on the chart
A lot of things can be changed and customize as you want. You can change/set:
- Colors of Body and Top/Bottom Wicks separately
- Moving Average Values
- Supply and demand values
- Trend Line values
- Colors of the shapes
Sonarlab can be adjusted To All Trading Styles to simply create your own, unique trading strategies around this Powerful Indicator.
Support
For questions, you can reach out on discord or send us a private message on Tradingview or discord group.
We kindly suggest you to test this indicator out on a demo account first.
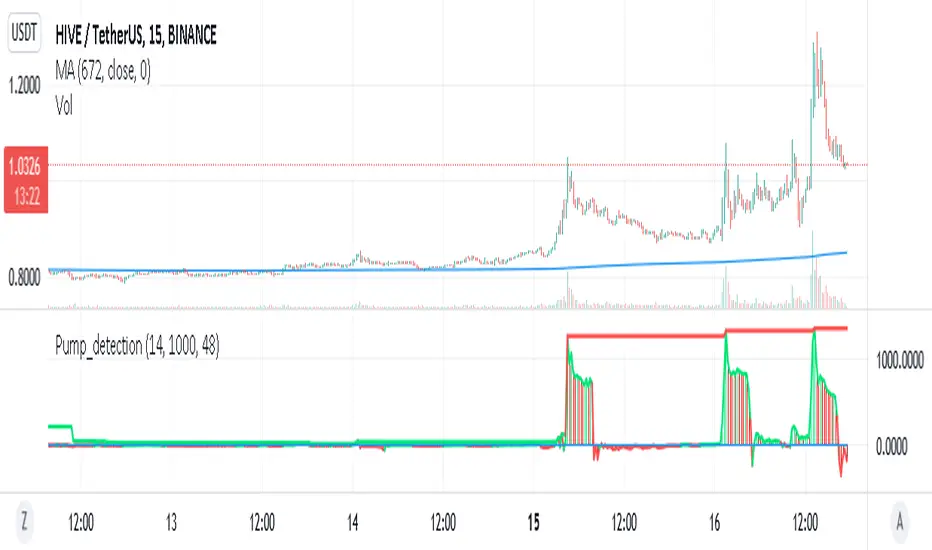
Pump_Detection_price_and_volume_15mThis indicator is very useful for spotting pump.
It is highly inspired from Pump_Doctor_Trend indicator of LARP_Capital.
This indicator is design for 15m timeframe but can be adapted for other timeframe.
If you find any way to optimized it please keep me updated !
Volume Price Trend with Divergence and Pivot Points The volume price trend indicator is used to determine the balance between a security’s demand and supply. The percentage change in the share price trend shows the relative supply or demand of a particular security, while volume indicates the force behind the trend. The VPT indicator is similar to the on-balance volume (OBV) indicator in that it measures cumulative volume and provides traders with information about a security’s money flow.
This is Volume Price Trend or VPT recalculated to be an Oscillator, a Divergence hunter was added, also Pivot Points and Alerts.
VPT is considered a "leading indicator" - in contrast to a "lagging indicator" just as Moving Averages it does not show a confirmation what already happened, but it shows what can happen in the future. For example: The chart is climbing while the VPT oscillator is slowly declining, gets weaker and weaker, maybe even prints bearish divergences? That means that a reversal might be occurring soon. Leading indicators are best paired with Stop and Resistance Lines, general Trendlines , Fib Retracements etc...Your chart is approaching a very important Resistance Trendline but the VPT shows a very positive signal? That means there is a high probability that the Resistance is going to be pushed though and becomes Support in the future.
What are those circles?
-These are Divergences. Red for Regular-Bearish. Orange for Hidden-Bearish. Green for Regular-Bullish. Aqua for Hidden-Bullish.
What are those triangles?
- These are Pivots . They show when the VPT oscillator might reverse, this is important to know because many times the price action follows this move.
Please keep in mind that this indicator is a tool and not a strategy, do not blindly trade signals, do your own research first! Use this indicator in conjunction with other indicators to get multiple confirmations.

Realtime Volume Stats Panel w Delta, Buy/Sell%, Cumulative DeltaWhat is it?
Displays several realtime volume stats for each bar/candle.
Although it was originally created to be an assist tool for the Market Footprint (available as a separate indicator) to consolidate the numbers into a neat panel below, it can be used independently as an Orderflow Analysis tool as well.
It currently displays the following:
(1) Net Delta Volume for the bar; (2) Total Volume for the bar; (3) Cumulative Delta Volume for bars plotted up till this point (i.e., from the time the tool started collecting realtime data);
(4) Buy Volume for the bar as a percentage of the total volume for the bar; and, (5) Sell Volume for the bar as a percentage of the total volume for the bar.
All labels/colors etc. are configurable to suit your aesthetics.
All data are ONLY AVAILABLE FOR REAL-TIME BARS. The longer you keep a chart open with the study enabled, the more data it collects and displays, and the better your analysis can potentially be.
Note that the data gets reset every time (a) any of the options is changed, (b) the market is switched, (c) the browser is refreshed, or (d) the script is reloaded
DATA ISN'T STORED. I.e., every time a new symbol is loaded, the previous symbol's data is lost. So if you intend to monitor a symbol closely, you would need to keep it loaded all the time (and without tinkering with any of the Settings).
Who is it for?
For ultra short term traders who are used to looking at short term auction orderflow (and price action) to catch buy/sell anomalies and accurate trade entries
For traders who are already using Market Footprint but want the volume stats to be displayed on the bottom pane making for a cleaner interface.
For traders (, irrespective of their method of trading,) who wish to understand what is happening under the hood when a certain price action unfolds. (Who is in control, who got trapped, what does liquidity or the lack thereof look like, etc.)

Footprint
What is it?
The classic Market Footprint chart for realtime bars (; at least the closest I could get it to anyway).
The tool has 3 modes, which display different volume data for the traded prices of each bar: (1) Up/Down Volume Footprint: At-price Up Volume and At-price Down Volume ; (2) Total Volume Footprint: Total volume transacted at each price; and, (3) Delta Volume Footprint: Difference between At-price Up Volume and At-price Down Volume . You can choose which mode you want from Settings. Each at-price value is color-coded based on its strength/weakness.
Maximum at-price volume for a bar can be chosen to be displayed in a separate color. This will serve (and be shown) as the VPOC ( Volume Point of Control). Note: This is not technically precise as VPOC is a slightly different concept. (But should be the same for most candles).
Below the bars (or above, depending on how you configure it), are displayed the following:(1) Net Delta Volume for the bar; (2) Total Volume for the bar; (3) Cumulative Delta Volume for bars plotted up till this point (i.e., from the time the tool started collecting realtime data); (4) Buy Volume for the bar as a percentage of the total volume for the bar; and, (5) Sell Volume for the bar as a percentage of the total volume for the bar. Each value here is color-coded as well.
In addition, a custom candle option has been provided. These are ON by default and displays 'thinner' candles for, arguably, good readability with Footprint in Up/Down Volume Mode. With custom candles, Tradingview's default candles will be rendered redundant and can be disabled. If you wish to switch to Tradingview's candles, it is recommended that you use either hollow candle mode or bar mode to view the footprint properly. (Filled-body candles will hide the values). Note that with the Footprint chart in either "Total Volume" or "Delta Volume" mode, you are better off using Tradingview's hollow candles or bars.
Almost all labels/colors etc. are configurable to suit your aesthetics.
All data are ONLY AVAILABLE FOR REAL-TIME BARS. The longer you keep a chart open with the study enabled, the more data it collects and displays, and the better your analysis can potentially be. Note that the data gets reset every time (a) any of the options is changed, (b) the market is switched, (c) the browser is refreshed, or (d) the script is reloaded
DATA ISN'T STORED. I.e., every time a new symbol is loaded, the previous symbol's data is lost. So if you intend to monitor a symbol closely, you would need to keep it loaded all the time (and without tinkering with any of the Settings in between).
Who is it for?
For ultra short term traders who are used to looking at short term auction orderflow (and price action) to catch buy/sell anomalies and accurate trade entries
For traders looking to get into footprint chart reading and who wish to give it a go and learn before investing in expensive platforms/tools.
For traders (, irrespective of their method of trading,) who wish to understand what is happening under the hood when a certain price action unfolds.
Who is in control, who got trapped, what does liquidity or the lack thereof look like, etc.
Mode 2: Total Volume Footprint. This also shows how Tradingvoew's hollow candles can be used with the tool.
Mode 3: Delta Volume Footprint

PVT RSIPrice Volume Trend based RSI with SMA smoothing. I personally prefer smoothed RSI's to get rid of noise.

Dynamic Price SwingFinally, a price channel oscillator that works.
I programmed three flavors into this.
The first flavor uses the Fast and Slow EMA to check for the trend to ensure you don't trade in the wrong direction simply because the price crosses the previous highest high or lowest low (based on lookback bars).
The second flavor uses a seven point average of the Fibonacci bands to create an upper and lower central channel for quick trades (like DOGE).
The third flavor uses the golden Fibonacci ratio of 1.618 and trades when the price moves above or below this band.

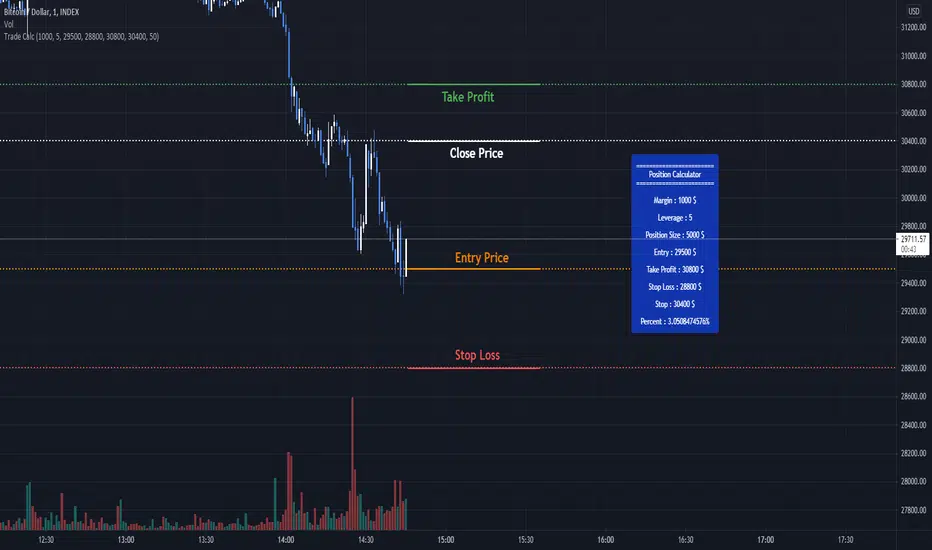
Trade Calculator by RealmixA clean Trade Calculator for any Asset, which calculates everything you need to know.
This script is a modified version of the Position Calculator by Mysteriown. Link:
I try to make it a bit better for Futures Trading.
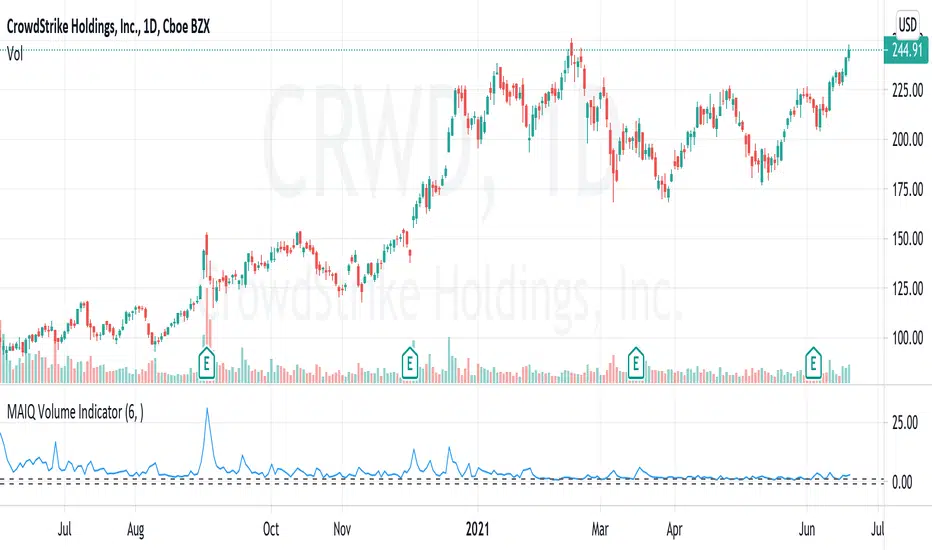
MAIQ Volume Trend IndicatorUses Volume and current outstanding shares float to calculate a ratio to determine if a price trend is occuring.
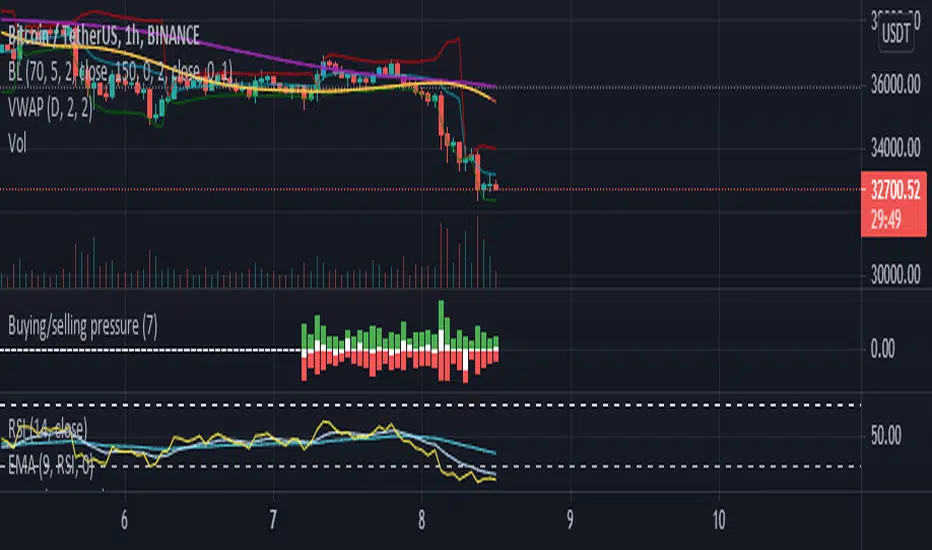
Buying/selling pressureBuying/selling pressure
Green bar for buying pressure, calculated by multiply Volume change and the increasing of price
Red bar for selling pressure, calculated by multiply Volume change and the decreasing of price
White bar is the subtract of Green bar and Red bar, which is calculated how strong of buying or selling in the market at the current timeframe.
The heigh of the Bars (green+red) is related to Moving average of Volume (100 points is equal to 100% of current Volume MA) , can set custom period in Setting.
Bear & Bull Zone Signal StrategySince I love to mix and match, here is something fresh and that actually works on the breakout of Ethereum without losing your ass on lagging indicators.
It blends some of the nice parts of my previous scripts while moving to big boy pants with a twist on the Fibonacci retracement using SMA and EMA at multiple levels to do a sanity check.
Is it too good to be true? Nope, just what happens when a Solution Architect starts messing around with crypto and applies engineering and mathematics to the mix. You get a strategy that really doesn't have high profit losses when you tweak it just the right way.
What's the right tweak you ask?
1. Start with a 30 minute timeframe and set your window start date to the date the market began the bear or bull run
2. Make sure you can see your strategy performance window (not the graph one)
3. Set Stop Loss and Target Profit to 50%
4. Use your mouse wheel or up and down arrows and mess around with the RSI, go down one at a time but no lower than 7. Whichever value displayed the highest long or short gain is the one to pick.
5. Now select long or short only based on whichever one shows the highest gain.
6. Now go to K and D, leave K as 3 and check what happens when D is 4 or 5. Leave D at the value that gives you the highest gain.
7. Now go to EMA Fast and Slow Lengths. Leave Fast at 5 and check what happens when the Slow is moved up to 11 or 12, do the gains go up. If not, check what happens when Slow is moved down to 9, 8, or 7. Whichever gives you the highest gain, leave it there. Now go mess with the fast length, keep in mind that fast must always be less than slow. So check values down to 3 and up to 6. Same concept, mo money...leave it be.
8. Now go mess with the Target Profit, I start at 5, hit enter, then go to 7, hit enter, then 9...up by 2 until I get to 21 to make sure I don't hastily pick a low one and always keep in mind between which values the gain switched from high to low. For example, in this example I published at 11 it was $5k and at 13 it was $3700 for the gains. So after I got up to 21 I went back to 11 and started going up by 0.01 steps until the value dropped, which was at 11.19 so I set it at 11.18.
9. Now stop loss is trickier, you've maximized the gains, which means if you set the stop loss at a low value you will sacrifice gains. Typically by this point your loss is less than 10% with this script. So, my approach is to find the value where the stop loss doesn't change what I've tweaked already. In this example, I did the same start at 5 and go up by 2 and saw that when I went to 17 it stopped changing. So I started going back down by 0.5 and saw at 15.5 the gains went lower again. Now I started going back up in steps of 0.01 and at 15.98 it went back to the high gain I already tweaked for. I kept stop loss there and unleashed the strategy on ETH.
So far so good, no bad trades and it's been behaving pretty well.

Price/Volume Trend MeterAnother simple indicator from the sweet indicator series, This is a combination of the Volume and Price Trend Meter indicators combined (Links below) into one indicator called PVTM (Price Volume Trend Meter).
PVTM measures the strength of price and volume pressure on a histogram.
The indicator sums up all green candles price and volume and red candles price and volume over a specific period of bars and plots based on Price summed value. The result will look similar to Price Trend Meter with the benefit of trying to filter out more noise.
Use this indicator to identify the increasing asset of price and volume with the green candles (Close is higher than open) and decreasing of price and volume with the red candles (Close is lower than open).
======= Calculation ==========
Bright Green Color Column: Total summed up Price and Volume are higher than 0.
Bright Red Color Column: Total summed up Price and Volume are Lower than 0.
Weak Green Color Column: Conflict between Price and Volume (One positive and one negative) so we continue based on previous color .
Weak Red Color Column: Conflict between Price and Volume (One positive and one negative) so we continue based on previous color.
======= Price/Volume Trend Meter Colors =======
Green: Increasing buying pressure.
Weaker Green: Declining Buying pressure (Possible Sell Reversal).
Red: Increasing selling pressure.
Weaker Red: Declining Selling pressure (Possible Buy Reversal).
Other sweet indicators that this indicator is based on:
Volume Trend Meter:
Price Trend Meter:
Like if you Like and Follow me for upcoming indicators/strategies: www.tradingview.com

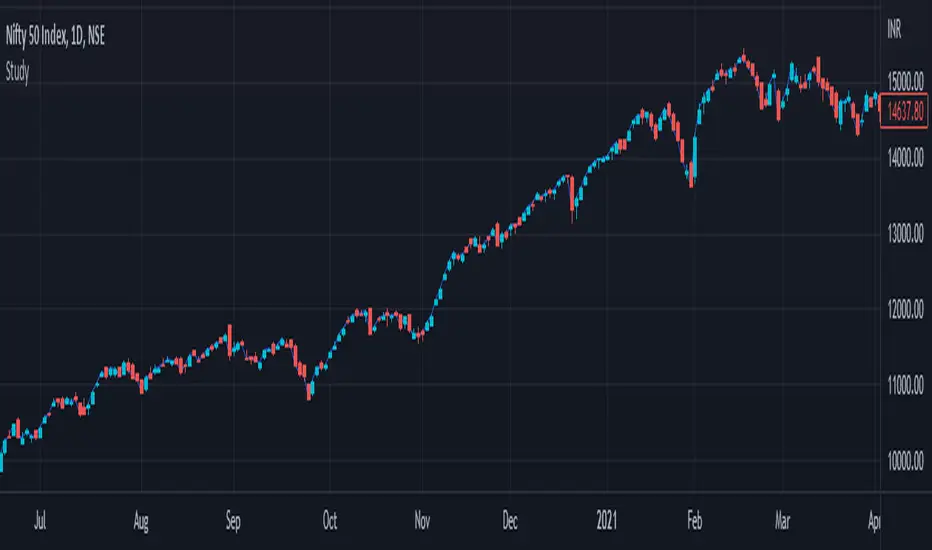
NSE BankNifty Spot Volume - by GrowMore IndicatorsNSE BankNifty Spot Volume - by GrowMore Indicators !!
HOW Does it work ?
Trading volume is a measure of how much of a given financial asset has traded in a period of time. For stocks, volume is measured in the number of shares traded and, for futures and options, it is based on how many contracts have changed hands. The numbers, and other indicators that use volume data, are often provided with online charts.
The Spot Volume of NSE Bank-Nifty is hard to calculate, but TradingView Pine made it easier to calculate the actual spot volume of Bank-Nifty.
As Bank-Nifty users are aware that the Bank-Nifty comprises of 12 banks and each bank has its own weightage in Bank-Nifty movement.
The Indicator has 12 inputs of banks that are in NSE Bank-Nifty and next beside there is weightage input for that particular bank,
now this weightage is modified by NSE every month so it should be changed every month. The link to it is - www1.nseindia.com
User must update the weightage given by NSE into indicator to use it flawlessly.
Disclaimer : Here the volumes are average of volume - of all Bank-Nifty banks.
User Options : Option to input security name and weightage nearby.
also have SMA of volume of user defined length.
Visual Checks - The user could manually validate the back test results on various assets they would like to use this strategy on before putting it live.
How to get access
Please click on the link / email available in the signature or send me a private message to get access.
Feedback
Please click on the link/email in the signature or send me a private message for suggestions/feedbacks.

Pivot Points by stelmaxFor pivot levels, we use different definitions of the pivot point. In fact, there are three different methods to calculate the reference level using this method.
For these pivot points, we set the variable x, the value of which depends on whether the open is higher or lower than the close.
If the close is less than the open, x = H + 2L + C.
If the close is higher than the open, x = 2H + L + C.
When open equals close, x = H + L + 2C
This final value will be one of the most commonly used designs. This is because, as FX is a 24 hour market, the open is almost always equal to the close.
If you look at the daily chart throughout the week, the close and the open are really just names. This is in contrast to the stock market, where the open and close are very different things, separated by time and price.
Once we have the pivot point and the x-value, we use it to compute the pivot point of the base P.
P = x / 4
Support and resistance levels are also calculated from x (pivot points do not use more than one support and resistance level).
S₁ = x / 2 - H
S₂ = x / 2 - L
Thus, we have seen how to calculate different types of Pivot Points indicator. But how can we now use them in our trade?
First, we can use our anchor point to define the general direction. - If the existing market price is above the key PP level, it suggests a bullish trend.
- If the market is below the key PP level, it suggests a bearish trend.
Pivot levels are set according to the value of the previous trading day.
+ If the price is below the PP pivot level - priority is given to sell deals, if higher - to purchases
+ Confirmatory signals can be candlestick patterns and the Stochastic indicator
+ The SL level can be set either for a signal candle or for the nearest level
+ Target - movement to the nearest support / resistance level
Keep in mind that the Pivot Level Indicator is not a complete trading system!
Remember that there are no indicators in trading that do not make mistakes, Pivot Points, like any others, require confirmation of their signals. When building your own trading system, use several indicators.
Observe Money Management. Never risk more than 2 percent of your capital in one trade. This approach will protect you from ruin and will allow you to consistently make money on Forex using the Pivot Point.
Be clear about your trading strategy. If, according to the pivot point strategy, you need to open a deal - open, if you fix the result - fix it, and it doesn't matter if you are in the black or not. Only following the rules of Pivot Points "from and to" will allow you to earn.

MAX SAHAM ADX with DI Max Saham's ADX line with D+ & D-
ADX is used to quantify trend strength.
When the D+ (+DMI) is dominant and rising, price direction is up.
When the D- (-DMI) is dominant and rising, price direction is down. But the strength of price must also be considered.
Uses Wilder's MA to get a more accurate ADX reading as compared to SMA.
Also added the green background to indicate the trend and also dots to indicate bull and bear crossing of the DMI's

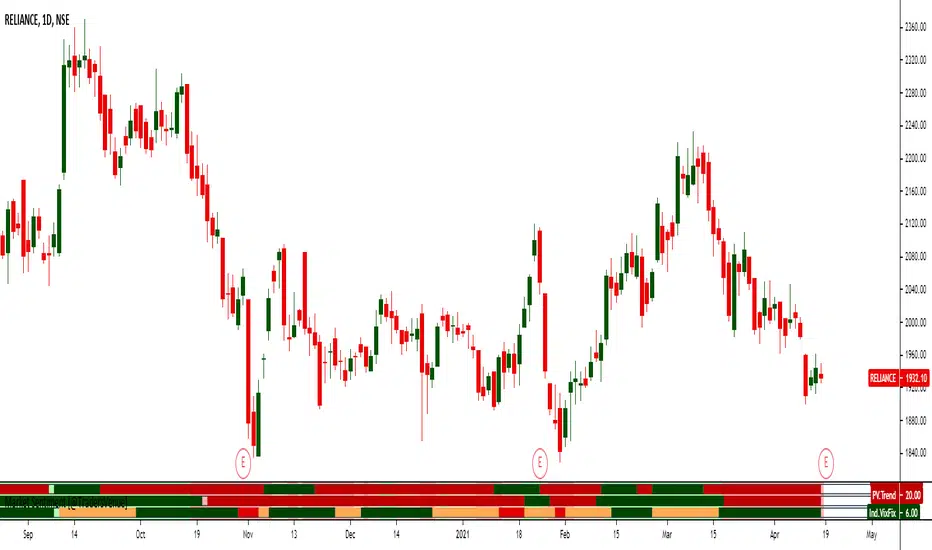
Market Sentiment [@TradersVenue]This majorly combines 3 indicators. More detailed usage will be taught to the subscribers as part of webinars to understand how to use these along with VSA to improve the trading results.
1)Mean Revert Indicator (M.Revert) - Most useful for intraday. When M.Revert bar turns red its ideally a sell signal. When M.Revert bar turns green its buy signal.
2)PV.Trend is nothing but price volume trend. Green bullish, red bearish.
3) Ind.VIxFix - Its India VIX. When its red it means VIX is shooting up and chances of fall is higher. When VIX turns green VIX is cooling down and market may consolidate or go higher.
When VIXFIX turns green its a good time to sell straddle or strangles and avoid neutral strategies when red. Additionally when VIXFix turns red, simply exit the losing leg holding the other leg of the neutral strategy. It helps.
GOD's EYEGet to know when to accumulate when biggies are buying and when to stay away from the stock

Zeta Volume Profile ProWhat is Volume Profile?
Volume Profile is an advanced order flow analysis which displays volume distribution at various price points over time. It may be called a recent biodata of a stock which is displayed on a chart as a horizontal histogram. Volume Profile can help reveal significant price levels where smart money is sitting.
Why Volume Profile is important?
The life of a Future Contract is of maximum 3 months. All the near month contracts expire on the last Thursday of the respective month. But, the traders who want to continue holding on to their winning positions would likely take the same position in the next series. So they often close the existing position near the expiry and take position in the next series. This activity is termed as Rolling Over the position and mostly it catches strength about 5-6 days before the expiry.
If we start tracking Volume Profile 5-6 days before the monthly expiry, we get to know the levels where maximum concentration of volume is located. In layman terms, we want to see where the biggest crowd is sitting. In this crowd, there will be equal number of buyers and sellers and when either party starts feeling the heat (market goes against them), they try to limit their loss by Buying/Selling and the random walks become a unidirectional march.
Zeta Volume Profile Pro tries to detect this crowd behavior by tracking maximum volume concentration area and when price leaves this area, it generates Buy/Sell Signals.
What is unique about Zeta Volume Profile Pro?
There are other volume profile indicators also in the market but Zeta Volume Profile Pro is unique in following aspects:
1. Whenever last Thursday of any month starts, Zeta Volume Profile Pro resets automatically and starts calculating volume and price levels from 30 bars backwards (default value which the user can change). Assuming we are looking at 30 Min. Time-Frame chart and your Stock Exchange opens for 6 hours a day, the last 30 candles cover 5 days data. If in your time zone, stock exchange remains open for longer hours, you can either increase minimum number of bars to be considered or you may increase your time-frame. The idea is you should cover 5-6 days of data on last Thursday of the month.
2. Once you set the minimum number of bars and time-frame relevant to you, leave everything to Zeta Volume Profile Pro. Now with every passing tick, the volume profile created by Zeta Volume Profile Pro will keep changing and more and more price bars will keep adding to the minimum number of bars set by you till last Wednesday of the current month occurs.
3. On any given day or time, whenever price breaks out of maximum volume concentration area, the indicator generates a Buy/Sell Signal and often such breakouts give handsome returns.
What markets it is suitable for?
It can be used in any time-zone on any stock exchange. However, since the concept is based upon Volume Concentration, it works best on highly liquid stocks, commodities, currency pairs and indices.
It will not give good results if the underlying security is illiquid because volume profile generated will not be efficient one.
Since Future Contracts volume tends to be more than cash segment, it gives much better results on Futures Charts.
Which time frames are best for this indicator?
Choose such time-frame and minimum number of bars which are equivalent to 5-6 trading sessions in your time-zone. In settings, there is an option to set your time-zone.
How to Take Buy/Sell Entry with Zeta Volume Profile Pro?
Whenever you see a Buy Signal appearing on your chart, take Buy Entry and whenever you see a Sell Signal, take Sell side Entry.
Your STOP LOSS would be high or low of candle which occurs just before the Buy/Sell Signal respectively.
Keep moving your STOP LOSS up as the price moves in your favor and when market turns around and you see a SELL signal, it is time to book your BUY position profit and take Entry on SELL Side now and so on.
What are the limitations of this indicator?
Sometimes price takes a break out of maximum volume concentration area and then again comes back which might hit your stop loss. However, as the backtested data shows, having faith in the indicator will give you some so nice breakouts that a single trade will cover your 10 to 20 Stop Loss hits.
How to get this indicator?
This is invite-only indicator. Get in touch with us using information given below in Signature field to try this tool FREE for 02 live sessions. After that, it is subscription based access.
