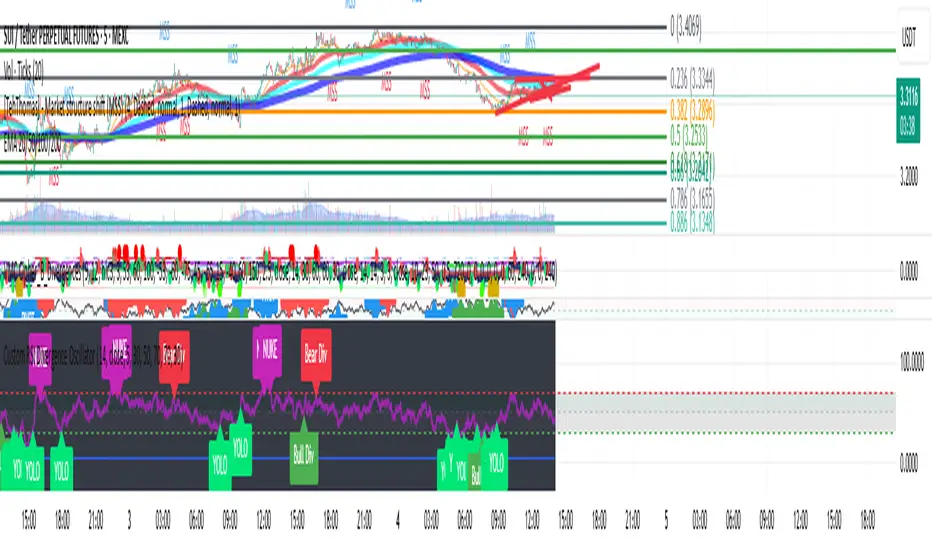
ZenAlgo - MarsThis indicator is a momentum-based oscillator built around a modified RSI calculation and subsequent smoothing with moving averages. It introduces a layered structure where divergences, signal crossovers, histogram dynamics, and multi-timeframe tables all combine into a comprehensive framework. The purpose is not to forecast markets with certainty but to provide structured context on momentum shifts, divergences, and trend bias.
Core Calculation
The base source is the closing price.
From it, relative upward and downward movements are measured over a chosen lookback length (by preset or manual input).
These values are normalized into an oscillator bounded between 0–100, equivalent to a traditional RSI structure.
This oscillator is smoothed by a moving average (SMA by default), producing the main line (MA).
A secondary smoothing (EMA by default) of the MA produces a signal line, against which crossovers are monitored.
Why this structure:
RSI captures momentum imbalance between gains and losses. Smoothing removes noise and makes divergences more stable to identify. Adding a signal line allows crossover events to highlight relative strengthening or weakening momentum phases.
Zones and Visual Guides
Static horizontal levels are placed at 70 (upper bound), 50 (mid-line), and 30 (lower bound).
The region between 30–70 is softly filled to emphasize the neutral zone.
Color changes on the MA line occur depending on whether it is above or below the signal line.
Why these levels:
Values above 70 or below 30 are commonly interpreted as overextended regions. A central 50 line separates positive from negative bias. These anchors allow consistent interpretation of oscillator movements.
Crossover Events
Alerts and conditions are defined for when the MA crosses above or below the signal line.
These are not entry signals by themselves but indicate shifts in relative momentum strength.
Divergence Detection
Divergences are calculated on the smoothed MA rather than raw RSI.
Four conditions are tracked:
Regular bullish (price makes a lower low while MA makes a higher low).
Hidden bullish (price higher low with MA lower low).
Regular bearish (price higher high with MA lower high).
Hidden bearish (price lower high with MA higher high).
Each detected divergence is marked with shapes and labeled "R" (regular) or "H" (hidden).
Why divergences are used:
They highlight when oscillator momentum disagrees with price structure. Regular divergences often suggest exhaustion, while hidden divergences may appear during continuation phases.
RSI & MA Multi-Timeframe Table
A table can be displayed showing RSI and MA values across multiple timeframes (1m, 5m, 15m, 1h, 4h, 1D).
For each, the relationship (Rising, Falling, Neutral) is determined by comparing RSI and MA.
Colors are adjusted depending on value ranges (extreme low, oversold, overbought, etc.).
Added value:
Instead of analyzing divergences or crossovers only on one chart, the table provides a compact overview of aligned or conflicting conditions across timeframes.
Strong and Warning Indications
"Strong" mark (Diamond) appear when the MA is firmly biased above or below 50 and hidden divergence supports the trend.
"Warning" mark (Triangle) appear when bias is strong but a regular divergence forms in the opposite direction.
Shapes mark these conditions, and alerts are available.
Why this distinction:
Hidden divergences often accompany continuation phases, while regular divergences may challenge the prevailing bias. Marking them separately allows the user to distinguish between potential trend reinforcement versus warning conditions.
Signal Table
A separate table summarizes:
Overall trend bias (Bull, Full Bull, Bear, Full Bear, Flat).
Time spent in each key zone.
Current MA trend (Rising, Falling, Flat).
Visual icons and color codes provide quick interpretation.
Time in Zones
The indicator measures how many bars (converted into minutes) the MA has spent:
above 70
above 50
below 50
below 30
These values appear in the signal table.
Why this matters:
Extended time in an extreme zone can show persistent momentum. Quick reversals versus sustained positioning give different context for bias strength.
MA vs Signal Histogram
A histogram plots the difference between MA and signal line, shifted around the 50 level.
Rising differences are shown with brighter coloring, falling differences with faded tones.
This emphasizes whether momentum is accelerating or decelerating.
Daily VWAP Integration
When the MA crosses the 50 level, additional conditions check whether the histogram is aligned and whether price is above or below the daily VWAP.
Only when both momentum bias and VWAP alignment agree are triangle markers shown.
Why VWAP is included:
VWAP serves as an intraday mean reference. Requiring alignment between oscillator momentum and price position relative to VWAP reduces random crossover noise.
Added Value Over Free Indicators
Divergences are calculated on smoothed momentum rather than raw RSI, reducing false positives.
Integration of multi-timeframe tables avoids the need to manually switch charts.
Bias measurement in terms of time spent in zones adds a temporal dimension often missing in basic oscillators.
Combining histogram dynamics with VWAP filtering provides context not present in typical RSI or MA overlays.
Limitations and Disclaimers
Divergences are not predictive on their own; price may continue without respecting them.
Extreme readings (e.g., above 70) can remain extended for long periods, especially in strong trends.
Multi-timeframe aggregation may introduce repainting effects when lower timeframes update faster than higher ones.
Signals must be interpreted in broader market context; the indicator does not provide trade entries or exits by itself.
How to Interpret Values
Above 70: momentum is strongly stretched upward.
Below 30: momentum is strongly stretched downward.
Crossing 50: often marks a structural change in directional bias.
MA rising vs. falling: tracks whether momentum pressure is increasing or decreasing.
Divergence labels: "R" = potential reversal, "H" = potential continuation.
Tables: confirm whether bias is consistent across multiple timeframes.
Best Use
Observe divergences in conjunction with bias tables to understand whether short-term moves align with higher-timeframe conditions.
Treat "Strong" and "Warning" markers as contextual alerts, not direct signals.
Use the histogram and VWAP alignment to filter out weaker crossovers.
Combine with price action and risk management rather than using in isolation.
Relative Strength Index (RSI)
RSI DivergenceThe code originally belongs to Matthew J. Slabosz, the founder of Zen Trading (The Art of Trading). ✍️📈
👉 My contribution and improvement was adding a divergence line directly on the RSI chart.
Why? Because most people can’t confirm correctness just by reading the code. 🧑💻❌
They need to see it with their own eyes 👀✔️ — this prevents misinterpretation and makes divergences crystal clear.
✨ By adding these visual confirmations, the efficiency and usability of the code has been significantly enhanced. 🚀📊

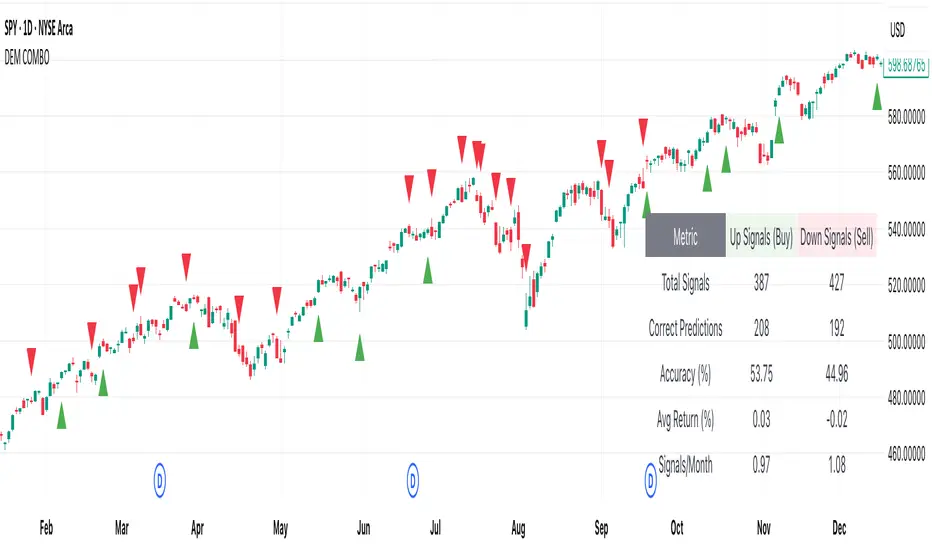
[DEM] Relative Strength Signal (With Backtesting) Relative Strength Signal (With Backtesting) is a momentum indicator that generates trading signals based on when an asset reaches its highest or lowest relative strength compared to the SPY benchmark over a 20-period lookback window. The indicator calculates relative strength by dividing the current asset's price by SPY's price, then triggers buy signals when this ratio hits a 20-period high (indicating maximum outperformance) and sell signals when it reaches a 20-period low (indicating maximum underperformance). To prevent signal clustering and improve practical utility, the indicator includes a built-in filter that requires a minimum number of bars (default 20) to pass between signals of the same type, ensuring adequate spacing for meaningful trade opportunities. The system includes comprehensive backtesting functionality that tracks signal accuracy, average returns, and signal frequency over time, displaying these performance metrics in a detailed statistics table to help traders evaluate the effectiveness of trading on relative strength extremes versus the broader market.

[DEM] Multiple Linear Regression Score Multiple Linear Regression Score is a composite momentum indicator that evaluates market conditions by analyzing a reference symbol (defaulting to NDX) across multiple technical dimensions and combining them into a single predictive score. The indicator processes ten different technical variables including RSI, MACD components (line, signal, and histogram), price relationships to various moving averages (10, 50, 100, 200), and short-term price changes (1-day and 5-day), converting most into binary signals (1 or 0) based on whether they're above or below zero. These binary and continuous inputs are then weighted using regression-derived coefficients and combined into a final percentage score that oscillates around zero, with the indicator also calculating a 20-period standard deviation of the score to measure volatility. This approach creates a data-driven sentiment gauge that quantifies the overall technical health of the reference market by mathematically weighting the importance of each technical factor based on historical relationships.

[DEM] Multi-Symbol Relative Strength Index Multi-Symbol Relative Strength Index is a comparative analysis indicator that simultaneously displays RSI values for five different symbols (defaulting to major tech stocks NVDA, MSFT, AAPL, AMZN, and GOOG) on a single chart pane. The indicator plots each symbol's RSI as colored lines with standard overbought (70) and oversold (30) reference levels, allowing traders to quickly compare relative momentum across multiple assets. A key feature is the dynamic background coloring that highlights which symbol currently has the extreme RSI value (either highest or lowest, depending on user selection), making it easy to identify which stock is showing the most extreme momentum condition at any given time. The indicator includes a legend table displaying all tracked symbols with their corresponding colors, and the background fill between the 30-70 RSI levels provides clear visual reference for overbought and oversold zones across all symbols simultaneously.

[DEM] Multi-RSI Signal (With Backtesting) Multi-RSI Signal (With Backtesting) is a technical indicator that generates buy signals based on multiple RSI (Relative Strength Index) timeframes simultaneously reaching oversold conditions. The indicator monitors RSI values across seven different periods (2, 3, 4, 5, 6, 8, 25, 50, and 100) and triggers a buy signal only when all shorter-term RSIs (2-8 periods) drop below specific thresholds (mostly below 10-20) while longer-term RSIs (25, 50, 100) remain within defined ranges, indicating a confluence of oversold conditions across multiple timeframes. The system includes comprehensive backtesting capabilities that track signal accuracy, average returns, and signal frequency over time, displaying these performance metrics in a real-time statistics table. Unlike typical single-RSI approaches, this multi-timeframe methodology aims to filter out false signals by requiring alignment across various RSI periods, though it currently only generates buy signals with no corresponding sell signal logic implemented.

[DEM] Momentum Bars Momentum Bars is designed to color price bars based on a combination of Aroon oscillator analysis and RSI momentum to identify periods of strong directional bias and filter out choppy or indecisive market conditions. The indicator calculates the Aroon Up and Aroon Down values over a configurable period (default 20) to determine which direction has more recent strength, then combines this with RSI analysis using the same period to confirm momentum alignment. Bars are colored green when Aroon Up exceeds Aroon Down (indicating recent highs dominate) and RSI is above 50 (confirming bullish momentum), red when Aroon Down exceeds Aroon Up (indicating recent lows dominate) and RSI is below 50 (confirming bearish momentum), and purple for all other conditions where the Aroon and RSI signals are conflicting or neutral, providing traders with immediate visual feedback about when price momentum and recent high/low activity are aligned versus when market conditions are mixed.

[DEM] Confirmation Signal (With Backtesting) Confirmation Signal (With Backtesting) is designed to generate buy and sell signals by combining Aroon oscillator analysis with Parabolic SAR positioning, smoothed EMA trend confirmation, and RSI filtering to create high-confidence trading opportunities. It also includes a comprehensive backtesting framework to evaluate the historical performance of these signals. The indicator overlays directly on the price chart, plotting signals and displaying performance statistics in a table while also coloring bars based on market conditions (green for bullish confirmation, red for bearish confirmation, purple for neutral). The strategy generates buy signals when the Aroon Up reaches 100% (new highs) combined with bullish trend confirmations, proper SAR positioning, RSI filters, and adequate time spacing between signals, while sell signals are triggered under opposite conditions, emphasizing signal quality over quantity through multiple confirmation layers and integrated backtesting metrics.

[DEM] Combo Signal (With Backtesting) Combo Signal (With Backtesting) is designed to generate buy and sell signals by combining seven different trading strategies that incorporate multiple technical indicators including SuperTrend, Parabolic SAR, MACD, and RSI. It also includes a comprehensive backtesting framework to evaluate the historical performance of these signals. The indicator overlays directly on the price chart, plotting signals and displaying performance statistics in a table. The strategy triggers buy signals when any of seven long conditions are met (including ATR-based reversal patterns, SuperTrend confirmations, RSI oversold crossovers, MACD bullish crossovers, and SuperTrend line breaks), while sell signals are generated when any of the corresponding seven short conditions occur, creating a multi-faceted approach that aims to capture various market conditions and trading opportunities while tracking signal accuracy, average returns, and signal frequency through its integrated backtesting system.
RSI Trend Navigator [QuantAlgo]🟢 Overview
The RSI Trend Navigator integrates RSI momentum calculations with adaptive exponential moving averages and ATR-based volatility bands to generate trend-following signals. The indicator applies variable smoothing coefficients based on RSI readings and incorporates normalized momentum adjustments to position a trend line that responds to both price action and underlying momentum conditions.
🟢 How It Works
The indicator begins by calculating and smoothing the RSI to reduce short-term fluctuations while preserving momentum information:
rsiValue = ta.rsi(source, rsiPeriod)
smoothedRSI = ta.ema(rsiValue, rsiSmoothing)
normalizedRSI = (smoothedRSI - 50) / 50
It then creates an adaptive smoothing coefficient that varies based on RSI positioning relative to the midpoint:
adaptiveAlpha = smoothedRSI > 50 ? 2.0 / (trendPeriod * 0.5 + 1) : 2.0 / (trendPeriod * 1.5 + 1)
This coefficient drives an adaptive trend calculation that responds more quickly when RSI indicates bullish momentum and more slowly during bearish conditions:
var float adaptiveTrend = source
adaptiveTrend := adaptiveAlpha * source + (1 - adaptiveAlpha) * nz(adaptiveTrend , source)
The normalized RSI values are converted into price-based adjustments using ATR for volatility scaling:
rsiAdjustment = normalizedRSI * ta.atr(14) * sensitivity
rsiTrendValue = adaptiveTrend + rsiAdjustment
ATR-based bands are constructed around this RSI-adjusted trend value to create dynamic boundaries that constrain trend line positioning:
atr = ta.atr(atrPeriod)
deviation = atr * atrMultiplier
upperBound = rsiTrendValue + deviation
lowerBound = rsiTrendValue - deviation
The trend line positioning uses these band constraints to determine its final value:
if upperBound < trendLine
trendLine := upperBound
if lowerBound > trendLine
trendLine := lowerBound
Signal generation occurs through directional comparison of the trend line against its previous value to establish bullish and bearish states:
trendUp = trendLine > trendLine
trendDown = trendLine < trendLine
if trendUp
isBullish := true
isBearish := false
else if trendDown
isBullish := false
isBearish := true
The final output colors the trend line green during bullish states and red during bearish states, creating visual buy/long and sell/short opportunity signals based on the combined RSI momentum and volatility-adjusted trend positioning.
🟢 Signal Interpretation
Rising Trend Line (Green): Indicates upward momentum where RSI influence and adaptive smoothing favor continued price advancement = Potential buy/long positions
Declining Trend Line (Red): Indicates downward momentum where RSI influence and adaptive smoothing favor continued price decline = Potential sell/short positions
Flattening Trend Lines: Occur when momentum weakens and the trend line slope approaches neutral, suggesting potential consolidation before the next move
Built-in Alert System: Automated notifications trigger when bullish or bearish states change, sending "RSI Trend Bullish Signal" or "RSI Trend Bearish Signal" messages for timely entry/exit
Color Bar Candles Option: Optional candle coloring feature that applies the same green/red trend colors to price bars, providing additional visual confirmation of the current trend direction


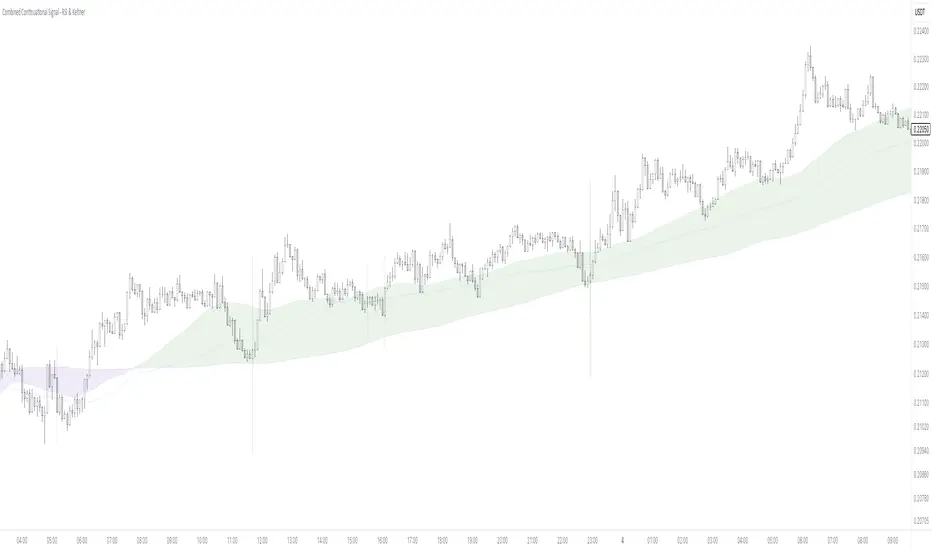
Combined Continuational Signal - RSI & KeltnerContinuational Signal Indicator
This technical indicator provides trend continuation signals through dual-methodology analysis, offering traders flexibility to choose between RSI-based or Keltner Channel-based signal generation, or utilize both simultaneously for enhanced confirmation.
Core Functionality:
Dual Signal Architecture: Toggle between RSI momentum analysis or Keltner Channel volatility breakout detection
Multi-Confirmation Framework: Incorporates moving average trend filters, slope analysis, and candle pattern validation
Cloud Interaction Filter: Signals activate only when price interacts with the moving average cloud zone
MA Closeness Filter: Uses ATR-based filtering to avoid signals during low-volatility consolidation periods
Signal Logic:
The indicator waits for overbought/oversold conditions (RSI) or band extremes (Keltner), confirms directional bias through slope analysis, validates trend alignment via moving average positioning, then triggers signals on specific candle formations with engulfing characteristics.
Customization Options:
Adjustable RSI parameters and threshold levels
Configurable Keltner Channel settings with multiple calculation methods
Multiple moving average lengths for trend and slope analysis
Various display modes (shapes, backgrounds, candle coloring, vertical lines)
Comprehensive alert system for all signal types
Risk Management Integration:
Built-in filters prevent signals during choppy market conditions and ensure alignment with higher-timeframe trend direction before activation.
Use in conjunction with other confluent variables for optimal results. The default settings are calibrated for specific market conditions, though experimentation with parameters is recommended for different trading styles and timeframes.
AI-Weighted RSI (Zeiierman)█ Overview
AI-Weighted RSI (Zeiierman) is an adaptive oscillator that enhances classic RSI by applying a correlation-weighted prediction layer. Instead of looking only at RSI values directly, this indicator continuously evaluates how other price- and volume-based features (returns, volatility, volume shifts) correlate with RSI, and then weights them accordingly to project the next RSI state.
The result is a smoother, forward-looking RSI framework that adapts to market conditions in real time.
By leveraging feature correlation instead of static formulas, AI-Weighted RSI behaves like a lightweight learning model, adjusting its emphasis depending on which features are most aligned with RSI behavior during the current regime.
█ How It Works
⚪ Feature Extraction
Each bar, the script computes features: log returns, RSI itself, ATR% (volatility), volume, and volume log-change.
⚪ Correlation Screening
Over a rolling learning window, it measures the correlation of each feature against RSI. The strongest relationships are ranked and selected.
⚪ Adaptive Weighting
Features are standardized (z-scored), then combined using their signed correlations as weights, building a rolling, adaptive prediction of RSI.
⚪ Prediction to RSI Weight
The predicted RSI is mapped back into a “weight” scale (±2 by default). Above 0 = bullish bias, below 0 = bearish bias, with color-graded fills to visualize overbought/oversold pressure.
⚪ Signal Line
A smoothing option (signal length) overlays a moving average of the AI-Weighted RSI for clearer trend confirmation.
█ Why AI-Weighted RSI
⚪ Adaptive to Market Regime
Because the model re-evaluates correlations continuously, it naturally shifts which features dominate, sometimes volatility explains RSI best, sometimes volume, sometimes returns.
⚪ Forward-Looking Bias
Instead of simply reflecting RSI, the model provides a projection, helping anticipate shifts in momentum before RSI itself flips.
█ How to Use
⚪ Directional Bias
Read the RSI relative to 0. Above = bullish momentum bias, below = bearish.
⚪ Overbought / Oversold Zones
Shaded fills beyond +0.5 or -0.5 highlight extremes where RSI pressure often exhausts.
⚪ Divergences
When price makes new highs/lows but AI-Weighted RSI fails to confirm, it often signals weakening momentum.
█ Settings
RSI Length: Lookback for the core RSI calculation.
Signal Length: Smoothing applied to the AI-Weighted RSI output.
Learning Window: Bars used for correlation learning and z-scoring.
-----------------
Disclaimer
The content provided in my scripts, indicators, ideas, algorithms, and systems is for educational and informational purposes only. It does not constitute financial advice, investment recommendations, or a solicitation to buy or sell any financial instruments. I will not accept liability for any loss or damage, including without limitation any loss of profit, which may arise directly or indirectly from the use of or reliance on such information.
All investments involve risk, and the past performance of a security, industry, sector, market, financial product, trading strategy, backtest, or individual's trading does not guarantee future results or returns. Investors are fully responsible for any investment decisions they make. Such decisions should be based solely on an evaluation of their financial circumstances, investment objectives, risk tolerance, and liquidity needs.

RSI ALL INOverbought and Oversold with Candle Pattern Confluences
1. Overbought / Oversold signal only
2. RSI + Engulfing Candle
3. RSI + Hammer/Shooting Star
RSI ADX Bollinger Analysis High-level purpose and design philosophy
This indicator — RSI-ADX-Bollinger Analysis — is a compact, educational market-analysis toolkit that blends momentum (RSI), trend strength (ADX), volatility structure (Bollinger Bands) and simple volumetrics to provide traders a snapshot of market condition and trade idea quality. The design philosophy is explicit and layered: use each component to answer a different question about price action (momentum, conviction, volatility, participation), then combine answers to form a more robust, explainable signal. The mashup is intended for analysis and learning, not automatic execution: it surfaces the why behind signals so traders can test, learn and apply rules with risk management.
________________________________________
What each indicator contributes (component-by-component)
RSI (Relative Strength Index) — role and behavior: RSI measures short-term momentum by comparing recent gains to recent losses. A high RSI (near or above the overbought threshold) indicates strong recent buying pressure and potential exhaustion if price is extended. A low RSI (near or below the oversold threshold) indicates strong recent selling pressure and potential exhaustion or a value area for mean-reversion. In this dashboard RSI is used as the primary momentum trigger: it helps identify whether price is locally over-extended on the buy or sell side.
ADX (Average Directional Index) — role and behavior: ADX measures trend strength independently of direction. When ADX rises above a chosen threshold (e.g., 25), it signals that the market is trending with conviction; ADX below the threshold suggests range or weak trend. Because patterns and momentum signals perform differently in trending vs. ranging markets, ADX is used here as a filter: only when ADX indicates sufficient directional strength does the system treat RSI+BB breakouts as meaningful trade candidates.
Bollinger Bands — role and behavior: Bollinger Bands (20-period basis ± N standard deviations) show volatility envelope and relative price position vs. a volatility-adjusted mean. Price outside the upper band suggests pronounced extension relative to recent volatility; price outside the lower band suggests extended weakness. A band expansion (increasing width) signals volatility breakout potential; contraction signals range-bound conditions and potential squeeze. In this dashboard, Bollinger Bands provide the volatility/structural context: RSI extremes plus price beyond the band imply a stronger, volatility-backed move.
Volume split & basic MA trend — role and behavior: Buy-like and sell-like volume (simple heuristic using close>open or closeopen) or sell-like (close1.2 for validation and compare win rate and expectancy.
4. TF alignment: Accept signals only when higher timeframe (e.g., 4h) trend agrees — compare results.
5. Parameter sensitivity: Vary RSI threshold (70/30 vs 80/20), Bollinger stddev (2 vs 2.5), and ADX threshold (25 vs 30) and measure stability of results.
These exercises teach both statistical thinking and the specific failure modes of the mashup.
________________________________________
Limitations, failure modes and caveats (explicit & teachable)
• ADX and Bollinger measures lag during fast-moving news events — signals can be late or wrong during earnings, macro shocks, or illiquid sessions.
• Volume classification by open/close is a heuristic; it does not equal TAPEDATA, footprint or signed volume. Use it as supportive evidence, not definitive proof.
• RSI can remain overbought or oversold for extended stretches in persistent trends — relying solely on RSI extremes without ADX or BB context invites large drawdowns.
• Small-cap or low-liquidity instruments yield noisy band behavior and unreliable volume ratios.
Being explicit about these limitations is a strong point in a TradingView description — it demonstrates transparency and educational intent.
________________________________________
Originality & mashup justification (text you can paste)
This script intentionally combines classical momentum (RSI), volatility envelope (Bollinger Bands) and trend-strength (ADX) because each indicator answers a different and complementary question: RSI answers is price locally extreme?, Bollinger answers is price outside normal volatility?, and ADX answers is the market moving with conviction?. Volume participation then acts as a practical check for real market involvement. This combination is not a simple “indicator mashup”; it is a designed ensemble where each element reduces the others’ failure modes and together produce a teachable, testable signal framework. The script’s purpose is educational and analytical — to show traders how to interpret the interplay of momentum, volatility, and trend strength.
________________________________________
TradingView publication guidance & compliance checklist
To satisfy TradingView rules about mashups and descriptions, include the following items in your script description (without exposing source code):
1. Purpose statement: One or two lines describing the script’s objective (educational multi-indicator market overview and idea filter).
2. Component list: Name the major modules (RSI, Bollinger Bands, ADX, volume heuristic, SMA trend checks, signal tracking) and one-sentence reason for each.
3. How they interact: A succinct non-code explanation: “RSI finds momentum extremes; Bollinger confirms volatility expansion; ADX confirms trend strength; all three must align for a BUY/SELL.”
4. Inputs: List adjustable inputs (RSI length and thresholds, BB length & stddev, ADX threshold & smoothing, volume MA, table position/size).
5. Usage instructions: Short workflow (check TF alignment → confirm participation → define stop & R:R → backtest).
6. Limitations & assumptions: Explicitly state volume is approximated, ADX has lag, and avoid promising guaranteed profits.
7. Non-promotional language: No external contact info, ads, claims of exclusivity or guaranteed outcomes.
8. Trademark clause: If you used trademark symbols, remove or provide registration proof.
9. Risk disclaimer: Add the copy-ready disclaimer below.
This matches TradingView’s request for meaningful descriptions that explain originality and inter-component reasoning.
________________________________________
Copy-ready short publication description (paste into TradingView)
Advanced RSI-ADX-Bollinger Market Overview — educational multi-indicator dashboard. This script combines RSI (momentum extremes), Bollinger Bands (volatility envelope and band expansion), ADX (trend strength), simple SMA trend bias and a basic buy/sell volume heuristic to surface high-quality idea candidates. Signals require alignment of momentum, volatility expansion and rising ADX; volume participation is displayed to support signal confidence. Inputs are configurable (RSI length/levels, BB length/stddev, ADX length/threshold, volume MA, display options). This tool is intended for analysis and learning — not for automated execution. Users should back test and apply robust risk management. Limitations: volume classification here is a heuristic (close>open), ADX and BB measures lag in fast news events, and results vary by instrument liquidity.
________________________________________
Copy-ready risk & misuse disclaimer (paste into description or help file)
This script is provided for educational and analytical purposes only and does not constitute financial or investment advice. It does not guarantee profits. Indicators are heuristics and may give false or late signals; always back test and paper-trade before using real capital. The author is not responsible for trading losses resulting from the use or misuse of this indicator. Use proper position sizing and risk controls.
________________________________________
Risk Disclaimer: This tool is provided for education and analysis only. It is not financial advice and does not guarantee returns. Users assume all risk for trades made based on this script. Back test thoroughly and use proper risk management.

Multi-RSI with Stochastic Oscillator - flack0xA sophisticated momentum analysis tool combining 4 customizable RSI oscillators with an innovative Close/Close Stochastic implementation. Designed for traders seeking comprehensive momentum insights across multiple timeframes in a single, organized indicator.
Key Features:
4 Independent RSI Oscillators with default periods: 2, 3, 9, 27
Innovative Close/Close Stochastic - Compares closing prices to closing price ranges (not high/low)
Complete Customization - Individual control over periods, colors, line widths, and visibility
Reference Levels - Customizable overbought (70), oversold (30), and midline (50) levels
Smart Alert System - Crossover notifications for key momentum shifts
Unique Close/Close Stochastic Methodology:
Unlike traditional Stochastic oscillators that use high/low ranges.
Benefits of Close/Close Approach:
Eliminates Gap Noise - Ignores overnight gaps and intraday wicks
Smoother Signals - Reduces whipsaws common in traditional Stochastic
Position-Relevant - Focuses on actual settlement prices traders care about
Cleaner Momentum Reading - Pure closing price momentum without intraday volatility

Kameniczki AI RSI Pro v2.0Kameniczki AI RSI Pro v2.0 is an advanced technical indicator based on RSI (Relative Strength Index) with artificial intelligence that provides comprehensive market analysis with emphasis on safety and signal reliability. The indicator combines traditional RSI calculations with modern AI technologies for detecting high-quality trading opportunities.
Key Features:
AI Signal Quality Assessment
- Automatic signal quality rating on 0-100% scale
- Strict filtering to prevent false signals
- Trend confirmation with "falling knife" protection
- Momentum filter for detecting strong trends
Multi-Timeframe Analysis
- RSI analysis across 5 timeframes (5M, 15M, 30M, 1H, 4H)
- Alignment score calculation for trend direction confirmation
- Configurable threshold for MTF alignment (50-90%)
Smart Money Detection
- Detection of smart money accumulation and distribution
- Volume vs. price analysis for institutional activity identification
- Smart money strength calculation (0-100%)
Anomaly Detection System
- Early warning system for market anomalies
- Monitoring of price, volume, and volatility anomalies
- 4 anomaly levels: NORMAL, MEDIUM, HIGH, CRITICAL
- Comprehensive anomaly scoring (0-100 points)
Volume-Weighted RSI
- Volume-weighted RSI calculations
- Adaptive RSI lengths based on volatility
- Three RSI variants: Fast (7), Medium (14), Slow (21)
RSI Divergence Detection
- Automatic bullish and bearish divergence detection
- 20-bar lookback period for accurate identification
- Integration with AI signal quality
Dashboard and Visualization
Information Dashboard
- **SIGNAL**: Main trading signal with percentage score
- **ANOMALY**: Market anomaly status with color coding
- **MTF**: Multi-timeframe alignment percentages
- **SMART MONEY**: Accumulation/distribution status
- **DIVERGENCE**: Current RSI divergences
Signal Types
- **STRONG BUY/SELL**: Highest quality with trend confirmation
- **BUY/SELL**: Normal signals with percentage score
- **NEUTRAL**: No clear direction
Visual Effects
- Glowing colors for high AI quality (90%+)
- Modern AI color schemes
- RSI momentum histogram
- Critical zones for extreme levels
Settings
RSI Core Settings
- Base RSI Length: 5-100 (default 14)
- Fast RSI Length: 3-21 (default 7)
- Slow RSI Length: 14-50 (default 21)
- RSI Source: Price source for calculations
AI Enhancement
- Enable AI Signal Quality: AI quality rating
- AI Quality Threshold: 30-95% (default 70%)
- Enable Smart Money Detection: Smart money detection
- Enable Volume Weighting: Volume weighting
Multi-Timeframe Analysis
- Enable MTF Analysis: Multi-timeframe analysis
- MTF Weight: 10-50% (default 30%)
- MTF Alignment Threshold: 50-90% (default 75%)
Visual Settings
- Enable Glowing Effects: Bright colors for high quality
- Line Width: 1-5 (default 2)
- Zone Transparency: 50-95% (default 80%)
- Dashboard Position: 6 positioning options
- Customizable signal colors
Alert Settings
- Enable Alerts: Main alerts
- Enable Divergence Alerts: Divergence alerts
- Enable Smart Money Alerts: Smart money alerts
Alert System
Main Alerts (AI Quality ≥ 85%)
- SUPER RSI STRONG BUY/SELL: Highest priority
- SUPER RSI BUY/SELL: Normal signals
- Price, RSI, trend, and stress level information
Specialized Alerts
- BULLISH/BEARISH DIVERGENCE: RSI divergences
- ANOMALY CRITICAL/HIGH: Market anomalies
- SMART MONEY ACCUMULATION/DISTRIBUTION: Smart money activity
- MTF ALIGNMENT: Multi-timeframe alignment
Technical Specifications
Calculation Methods
- Volume-weighted RSI with adaptive lengths
- ATR-based volatility analysis
- EMA trend confirmation (20, 50, 200)
- Stress level calculation (KAMENICZKI AI 1.5.5)
Safety Mechanisms
- Momentum filter against counter-trend trading
- Trend confirmation requirements
- Volume confirmation for extreme signals
- Falling knife protection
Performance Optimization
- Max bars back: 500
- Efficient global variables
- Optimized functions for speed
Usage
The indicator is designed for professional traders who need reliable and safe signals with emphasis on quality over quantity. It combines traditional technical analysis with modern AI technologies for maximum accuracy and risk minimization.

TRAPPER TRENDLINES — RSIBuilds dynamic RSI trendlines by connecting the two most recent confirmed RSI swing points (highs→highs for resistance, lows→lows for support). Includes optional channel shading for the 30–70 zone, an RSI moving average, clean break alerts, and simple bullish/bearish divergence alerts versus price.
How it works
RSI pivots: A point on RSI is a swing high/low only if it is the most extreme value compared with a set number of bars on the left and the right (the Pivot Lookback).
RSI trendlines:
Resistance connects the last two confirmed RSI swing highs.
Support connects the last two confirmed RSI swing lows.
Lines can be Full Extend (update into the future) or Pivot Only.
Channel block: Optional fill of the 30–70 range for fast visual context.
Alerts:
Breaks of RSI support/resistance trendlines.
Basic bullish/bearish RSI divergences versus price pivots.
Inputs
RSI
RSI Length: Default 14 (standard).
Pivot Lookback: Bars to the left/right required to confirm an RSI swing.
Overbought / Oversold: 70 / 30 by default.
Line Extension: Full Extend or Pivot Only.
Visuals
Show RSI Moving Average / Signal Length: Optional smoothing line on RSI.
RSI/Signal colors: Customize plot colors.
Show 30–70 Channel Block: Toggle the middle-zone fill.
Tint pane background when RSI in channel: Optional subtle background when RSI is between OB/OS.
Divergences & Alerts
Enable RSI TL Break Alerts: Alert conditions for RSI line breaks.
Enable Divergence Alerts: Bullish/Bearish divergence alerts versus price.
Pairing with price for confluence/divergence
For accurate confluence and clearer divergences, align this RSI tool with your price trendline tool (for example, TRAPPER TRENDLINES — PRICE):
Set RSI Pivot Lookback equal to the Pivot Left/Right size used on price.
Example: Price uses Pivot Left = 50 and Pivot Right = 50 → set RSI Pivot Lookback = 50.
Keep RSI Length = 14 and OB/OS = 70/30 unless you have a specific edge.
Interpretation:
Confluence: Price reacts at its trendline while RSI reacts at its own line in the same direction.
Divergence: Price makes a higher high while RSI makes a lower high (bearish), or price makes a lower low while RSI makes a higher low (bullish), using matched pivot windows.
Suggested settings
Higher timeframes (4H / 1D / 1W): Pivot Lookback = 50; optional RSI MA length 14; channel block ON.
Intraday (15m / 30m / 1H): Pivot Lookback = 30; optional RSI MA length 14.
Always mirror your price pivot size to this RSI Pivot Lookback for consistent swings.
Reading the signals
RSI trendline touch/hold: Momentum reacting at structure; look for confluence with price levels.
RSI Trendline Break Up / Down: Momentum shift; consider price structure and retests.
Bullish/Bearish Divergence: Confirm only when pivots are matched and the new swing is confirmed.
Notes & limitations
Pivots require future bars to confirm by design; trendlines update as new swings confirm.
Divergence logic compares RSI pivots to price pivots with the same lookback; mismatched windows can produce false positives.
No strategy entries/exits or performance claims are provided. This is an analytical tool.
Alerts (titles/messages)
RSI: Trendline Break Up — “RSI broke falling resistance line.”
RSI: Trendline Break Down — “RSI broke rising support line.”
RSI: Bullish Divergence — “Bullish RSI divergence confirmed.”
RSI: Bearish Divergence — “Bearish RSI divergence confirmed.”
Quick start
Add the indicator to a separate pane.
Set Pivot Lookback to match your price tool’s pivot size (e.g., 50).
Optionally toggle the RSI MA and Channel Block for clarity.
Enable alerts if you want notifications on RSI line breaks and divergences.
Use with TRAPPER TRENDLINES — PRICE or any price-based trendline tool for confluence/divergence analysis.
Compliance
This script is for educational purposes only and does not constitute financial advice. Trading involves risk. Past performance does not guarantee future results. No performance claims are made.

𝑨𝒔𝒕𝒂𝒓 - TyrAstar – Tyr is a dynamic RSI system with adaptive EMA and divergence detection.
@v1.0
Dynamic RSI period adjusts to volatility & market activity
Adaptive EMA smooths RSI with variable length
Optional Gaussian Kernel smoothing for noise reduction
Highlights bullish & bearish divergences automatically
Clean visualization with color coding and fills
Works in real time with no repainting

Aljane's 1348ema strategy13/48ema crossover powerful setup
EMAs (13, 48, 200)
VWAP
buy/sell labels
Candles turn white on bullish , red on bearish
Ideal for traders who want a simplified but powerful chart setup without clutter.

Custom RSI Divergence OscillatorStill work in progress, but wanted the RSI indicator to look nicer and to be easier and more fun to use.