Mean Reversion Probability Zones [BigBeluga]🔵 OVERVIEW
The Mean Reversion Probability Zones indicator measures the likelihood of price reverting back toward its mean . By analyzing oscillator dynamics (RSI, MFI, or Stochastic), it calculates probability zones both above and below the oscillator. These zones are visualized as histograms, colored regions on the main chart, and a compact dashboard, helping traders spot when the market is statistically stretched and more likely to revert.
🔵 CONCEPTS
Mean Reversion : The tendency of price to return to its average after significant extensions.
Oscillator-Based Analysis : Uses RSI, MFI, or Stochastic as the base signal for detecting overextension.
Probability Model : The probability of reversion is computed using three factors:
Whether the oscillator is rising or declining.
Whether the oscillator is above or below user-defined thresholds.
The oscillator’s actual value (distance from equilibrium).
Dual-Zone Output :
Upper histogram = probability of downward mean reversion.
Lower histogram = probability of upward mean reversion.
Historical Extremes : The dashboard highlights the recent maximum probability values for both upward and downward scenarios.
🔵 FEATURES
Oscillator Choice : Switch between RSI, MFI, and Stochastic.
Customizable Zones : User-defined upper/lower thresholds with independent colors.
Probability Histograms :
Above oscillator → down reversion probability.
Below oscillator → up reversion probability.
Colored Gradient Zones on Chart : Visual overlays showing where mean reversion probabilities are strongest.
Probability Labels : Percentages displayed next to histogram values for clarity.
Dashboard : Compact table in the corner showing the recent maximum probabilities for both upward and downward mean reversion.
Overlay Compatibility : Works in both chart pane and sub-pane with oscillators.
🔵 HOW TO USE
Set Oscillator : Choose RSI, MFI, or Stochastic depending on your strategy style.
Adjust Zones : Define upper/lower bounds for when oscillator values indicate strong overbought/oversold conditions.
Interpret Histograms :
Orange (upper) histogram → higher chance of a pullback/downward mean reversion.
Green (lower) histogram → higher chance of upward reversion/bounce.
Watch Gradient Zones : On the main chart, shaded areas highlight where probability of mean reversion is elevated.
Consult Dashboard : Use the “Recent MAX” values to understand how strong recent reversion probabilities have been in either direction.
Confluence Strategy : Combine with support/resistance, order flow, or trend filters to avoid counter-trend trades.
🔵 CONCLUSION
The Mean Reversion Probability Zones provides traders with an advanced way to quantify and visualize mean reversion opportunities. By blending oscillator momentum, threshold logic, and probability calculations, it highlights when markets are statistically stretched and primed for reversal. Whether you are a contrarian trader or simply looking for exhaustion signals to fade, this tool helps bring structure and clarity to mean reversion setups.
Reversal

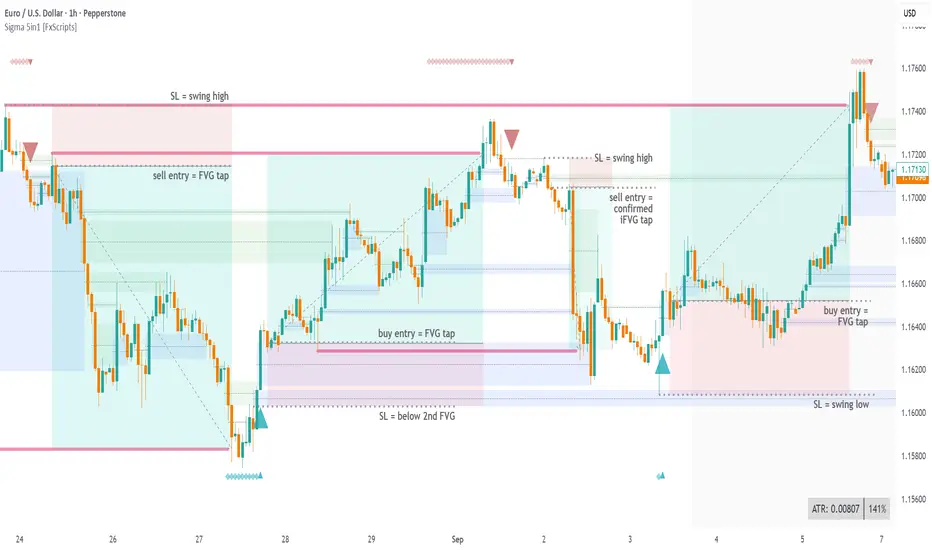
Killzones SMT + IFVG detectorKillzones SMT + IFVG Detector
Summary
This strategy implements a specific intraday workflow inspired by ICT-style concepts.
It combines:
Killzone session levels (recording untouched highs/lows)
SMT divergence between NQ and ES (exclusive sweep logic)
IFVG confirmation (3-bar imbalance + width filter + inversion guard)
and an optional smart exit engine
The components are not simply mashed together: they interact in sequence.
A setup only confirms if all conditions line up (time window → untouched level sweep → divergence → valid IFVG → confirmation candle → risk filter).
Workflow
Killzones & session levels
Tracks highs/lows inside default killzones (19:00–23:00, 01:00–04:00, 08:30–10:00, 11:00–12:00, 12:30–15:00, chart timezone).
Stores untouched levels forward; sweeps trigger candidate signals.
SMT divergence (exclusive sweep)
Bullish SMT : one index sweeps its low while the other remains above its session low.
Bearish SMT : one index sweeps its high while the other remains below its session high.
Detection supports “Sweep (Cross)” or “Exact Tick.”
Session IDs are tracked so once a side has fired, later re-touches can’t re-trigger .
IFVG confirmation
Locks the first valid 3-bar IFVG after SMT.
Confirmation requires a candle close beyond the IFVG boundary in the direction of the close.
IFVGs must meet a minimum width filter (default 1.0 point).
Inversion guard: ignores IFVGs already inverted before SMT.
Optional “re-lock” keeps tracking the latest IFVG until confirmation/expiry.
Smart exit engine
Initial stop from opposite wick (+ buffer).
Fixed TP (default 40 points).
Dynamic stop escalation at progress thresholds (BE → 50% → 80% of target).
Safety gates
Weekend lockout (Fri 16:40 → Sun 18:00).
Same-bar sweep of high & low cancels setups.
Max initial stop filter skips oversized setups.
Optional cooldown bars.
Alerts
SMT Bullish/Bearish : divergence detected this bar.
Confirm Long/Short : IFVG confirmation triggered.
Default Strategy Properties (used in screenshots/backtests)
Initial capital: $25,000
Order size: 1 contract
Commission: $1.25 per contract per side
Slippage: 2 ticks
Backtest window: Jun 16, 2025 – Sep 14, 2025
These settings are intentionally conservative. If you change them, your results will differ.
How to use
Apply on an NQ or ES futures chart (1–5 min).
Choose your killzones and detection mode.
Select confirmation symbol (NQ, ES, or “Sweeper”).
Enable/disable IFVG re-lock.
Review signals and use alerts for automation if desired.
Limitations
Strict filters reduce trade count; extend backtest window for more samples.
Works best on NQ/ES; not validated elsewhere.
Past performance is not indicative of future results.
This is an educational tool ; not financial advice.

Climax Absorption Engine [AlgoPoint]Overview
Have you ever noticed that during a sharp, fast-moving trend, the single candle with the highest volume often appears right at the end, just before the price reverses? This is no coincidence. It's the footprint of a Climax Event.
This indicator is designed to detect these critical moments of maximum panic (capitulation) and maximum euphoria (FOMO). These are the moments when retail traders are driven by emotion, creating a massive pool of liquidity. The "Climax Absorption Engine" identifies when Smart Money is likely absorbing this liquidity to enter large positions against the crowd, right before a potential reversal.
It's a tool built not just on mathematical formulas, but on the principles of market psychology and smart money activity.
How It Works: The 3-Step Logic
The indicator uses a sequential, three-step process to identify high-probability reversal setups:
1. Momentum Move Detection: First, the engine identifies a period of strong, directional momentum. It looks for a series of consecutive, same-colored candles and confirms that the move is backed by a steeply sloped moving average. This ensures we are only looking for climactic events at the end of a significant, non-random move.
2. Climax Candle Identification: Within this momentum move, the indicator scans for a candle with abnormally high volume—a volume spike that is significantly larger than the recent average. This candle is marked on your chart with a diamond shape and is identified as the Climax Candle. This is the point of peak emotion and the primary area of interest. No signal is generated yet.
3. Absorption & Reversal Confirmation: A climax is a warning, not a signal. The final signal is only triggered after the market confirms the reversal.
- For a BUY Signal: After a bearish (red) Climax Candle, the indicator waits for a subsequent green candle to close decisively above the midpoint of the Climax Candle. This confirms that the panic selling has been absorbed by buyers.
- For a SELL Signal: After a bullish (green) Climax Candle, it waits for a subsequent red candle to close decisively below the midpoint. This confirms that the euphoric buying has evaporated.
How to Interpret & Use This Indicator
- The Diamond Shape: A diamond shape on your chart is an early warning. It signifies that a climax event has occurred and the underlying trend is exhausted. This is the time to pay close attention and prepare for a potential reversal.
- The BUY/SELL Labels: These are the final, actionable signals. They appear only after the reversal has been confirmed by price action.
- A BUY signal suggests that capitulation selling is over, and buyers have absorbed the pressure.
- A SELL signal suggests that FOMO buying is over, and sellers are now in control.
Key Settings
- Momentum Detection: Adjust the number of consecutive bars and the EMA slope required to define a valid momentum move.
- Climax Detection: Fine-tune the sensitivity of the volume spike detection using the Volume Multiplier. Higher values will find only the most extreme events.
- Confirmation Window: Define how many bars the indicator should wait for a reversal candle after a climax event before the setup is cancelled.

PowerDelta Oscillator [FxScripts]PowerDelta Oscillator
The PowerDelta Oscillator measures real-time buying and selling pressure using the proprietary PowerDelta Algorithm. By quantifying order flow, it identifies whether the market conditions favor bullish or bearish activity, helping traders determine directional bias for both trend and countertrend setups.
Calculation Methodology
The PowerDelta computes the delta (difference) between buying and selling pressure by integrating both price movement and volume behavior rather than relying solely on volume or price-based approximations like other oscillators.
The PowerDelta Algorithm evaluates six core price-volume conditions:
Price advancing with increasing volume
Price advancing with decreasing volume
Price consolidating with increasing volume
Price consolidating with decreasing volume
Price declining with increasing volume
Price declining with decreasing volume
From these conditions, the algorithm derives:
Accumulation vs Distribution phases
Buyer/Seller exhaustion points
Effort vs No Result scenarios (volume pressure failing to move price)
Operational Use
The PowerDelta Oscillator has three operational modes:
Trend
Countertrend
Blended (Trend/Countertrend hybrid)
Trend Mode
In Trend Mode, the indicator plots an oscillator that fluctuates between positive and negative values:
Positive readings indicate dominant buying pressure
Negative readings indicate dominant selling pressure
The magnitude of the reading reflects the intensity of the pressure
Crossovers at the zero line provide directional shifts:
Negative → Positive: bullish transition
Positive → Negative: bearish transition
Additionally:
Sustained positive values indicate control by buyers, long bias is favoured
Sustained negative values indicate control by sellers, short bias is favoured
The magnitude of displacement from zero provides additional confirmation of market strength or weakness
Countertrend Mode
In Countertrend Mode, the primary use of the PowerDelta Oscillator is to locate divergences between price and the oscillator (as visualised on the chart above) which helps traders pinpoint potential reversals
The oscillator is much more sensitive in this mode, making highs, lows and hence divergences, easier to spot
Like Trend Mode, the magnitude of displacement from zero provides additional confirmation of market strength or weakness
The various Analytical Scenarios detailed below provide detailed use cases for both Trend and Countertrend Mode
Blended Mode
To provide maximum flexibility, there’s also a third Blended Mode
This mode combines elements of the two primary modes and can be used as part of a hybrid approach making it easier to spot both trends and reversals
Alternative Source
The PowerDelta algorithm utilises volume data therefore it’s best to use the most reliable source of volume data for the instrument being traded
For instance, whilst XAUUSD provides excellent results with most forex brokers, slightly better results may be achieved using GC futures data which comes direct from the exchange (data package required)
To use a third-party source, select 'Alternative' and input the relevant source
This can also be used as a way to monitor correlated pairs by adding two instances of the PowerDelta to the same chart, selecting pair 1 e.g. EURUSD as the first instance and the correlated pair e.g. USDCHF as the second instance
Thorough backtesting advised
Analytical Scenarios
Accumulation: High positive oscillator readings combined with upward price movement suggest active accumulation.
Optimal strategy: Monitor pullbacks for potential long entries or wait for a divergence with price and potential reversal.
Distribution: High negative oscillator readings with downward price movement indicate distribution.
Optimal strategy: Monitor pullbacks for potential short entries or wait for a divergence with price and potential reversal.
Buyer Exhaustion: Price forms higher highs while oscillator value declines. Indicates weakening buying strength and potential bearish reversal.
Seller Exhaustion: Price forms lower lows while oscillator value contracts. Indicates weakening selling strength and potential bullish reversal.
Effort / No Result (Buyers): Positive oscillator expansion without higher highs indicates aggressive buying without price confirmation, suggesting overbought conditions and a potential bearish reversal.
Effort / No Result (Sellers): Negative oscillator expansion without lower lows indicates aggressive selling without price confirmation, suggesting oversold conditions and a potential bullish reversal.
Alerts
To trigger alerts when market bias transitions across the zero line:
Right-click on chart → Add Alert on PowerDelta
Condition: PowerDelta → Select Mode
Type: Crossing
Value: 0
Execution: Once Per Bar Close
Adjust additional parameters as required
Performance and Optimization
Backtesting Results: The PowerDelta Oscillator has undergone extensive backtesting across various instruments, timeframes and market conditions, demonstrating strong performance in identifying strong trends and reversals. User backtesting is strongly encouraged as it allows traders to optimize settings for their preferred instruments and timeframes.
Optimization for Diverse Markets: The PowerDelta Oscillator can be used on crypto, forex, indices, commodities and stocks. The PowerDelta Oscillator's algorithmic foundation ensures consistent performance across a variety of instruments. The Trend, Countertrend and Blended Modes make it easy for the trader to set up based on their individual trading style.
Educational Resources and Support
Users of the PowerDelta Oscillator benefit from comprehensive educational resources and full access to FxScripts Support. This ensures traders can maximize the potential of the PowerDelta Oscillator and other tools in the Sigma Indicator Suite by learning best practices and gaining insights from an experienced team of traders.

Sigma Reversal Print [FxScripts]Indicator Overview
The Sigma Reversal Print is a powerful tool designed for traders who like to trade reversal strategies plus trend traders looking to enter on strong pullbacks. It integrates advanced price action with volume analysis, highlighting areas where a trend reversal or pullback may be in progress, providing insights into where markets may be exhausted or about to surge.
Key Features and Functionality
Reversal Trading: Tailored primarily for reversal traders, the Sigma Reversal Print highlights zones where the market is likely to change direction. While this approach offers significant potential, it inherently carries a degree of risk due to the precision required in predicting market turning points. The Sigma Reversal Print uses advanced methodology to forecast such reversals with a high degree of accuracy.
Signal Generation Based on Reversal and Pullback Zones: The Reversal Print generates signals when price enters specific conditions, representing exhaustion followed by a change in order flow. These conditions allow the indicator to filter out low-probability signals and focus on those with higher potential for a trend change.
Settings
Sensitivity Control: The sensitivity setting allows traders to adjust the strength of the pattern required for a signal to be generated. The scale ranges from 2-10 with higher sensitivity demanding more confirmation, leading to fewer, generally more reliable, signals however backtesting is highly recommended. Adjusting the sensitivity enables traders to balance early entries with signal accuracy, accommodating both aggressive and more conservative strategies.
Customizable Length: The length setting allows users to fine-tune the calculation period, adjusting the indicator’s responsiveness to overall market conditions. Adjusting length allows the Reversal Print to adapt to the user’s trading style and timeframe of choice. Similar to the sensitivity control, the scale ranges from 2-10 with a higher length demanding more confirmation. This can lead to fewer, often more reliable, signals however, once again, backtesting is highly recommended.
Advanced Filters
Opening Gap Filter: Turning this on allows the system to avoid painting false signals that can be triggered by the daily or weekly opening gap at market open. This setting is toggled on by default.
Price Filter: This filter applies an additional weighted price action algorithm to the signal being painted thus further filtering out weaker signals. Warning dots will still paint however the larger break arrow will no longer paint if the filter is triggered. This setting is toggled on by default.
Volume Filter: This filters out low volume entries which have a lower probability of turning into successful trades. Variable from 1-10 with 1 being the most lenient and 10 the most stringent. Warning dots will still paint however the larger break arrow will no longer paint if the filter is triggered. This setting is toggled on by default.
Alerts
Configure alerts and receive notifications when the first warning dot in a sequence appears (the series of dots seen on the chart) and again when a breakpoint is triggered (the larger arrow on the chart). This feature is particularly beneficial for traders who like to monitor multiple instruments or prefer not to stare at a screen all day.
Performance and Optimization
Backtesting Results: The Reversal Print has undergone extensive backtesting across various instruments, timeframes and market conditions, demonstrating strong performance in identifying reversal points, particularly during volatile or overextended price movements. User backtesting is strongly encouraged as it allows traders to optimize settings for their preferred instruments and timeframes.
Optimization for Diverse Markets: The Reversal Print can be used on crypto, forex, indices, commodities or stocks. The Reversal Print's algorithmic foundation ensures consistent performance across a variety of instruments. Key settings such as Sensitivity and Length will require adjustment based on the volatility and characteristics of each market.
Educational Resources and Support
Users of the Sigma Reversal Print benefit from comprehensive educational resources and full access to FxScripts Support. This ensures traders can maximize the potential of the Reversal Print and other tools in the Sigma Indicator Suite by learning best practices and gaining insights from an experienced team of traders.
Summary
The Reversal Print is a powerful and adaptable tool for reversal and pullback traders, combining statistical analysis and price action to identify high-probability turning points. Its advanced customization options, flexible controls and integration with the Sigma Indicator Suite offer significant advantages over standard indicators. By pinpointing precise entry points, the Reversal Print enables traders to make informed trading decisions with confidence.
Silent Trigger Silent Trigger combines widely used concepts under one scoring engine. Each module adds weight only when its conditions are met:
1. Higher-Timeframe (HTF) context
• Requests 1H and the next HTF up (e.g., 4H/D) with request.security(...) on confirmed bars only.
• Uses RSI(14) and a MACD line (EMA12–EMA26 difference) for bias.
• By default HTF weights the score. There is an option to require HTF alignment if you prefer a hard filter.
2. Market regime
• ADX for trend strength.
• Bollinger Band width and a fractal-energy proxy to detect squeeze/coiling vs expansion.
3. Smart-money / Wyckoff structure
• High-volume narrow bars, absorption, spring/upthrust, and liquidity grabs past recent swing highs/lows.
4. Momentum & divergences
• RSI and MACD-line divergences (regular + hidden) and simple exhaustion checks.
5. Fair Value Gaps (FVG)
• 3-bar gap with mid-gap revisit confirmation.
6. Volume context
• Relative volume and a compact 10-bin rolling volume profile to locate HVN proximity.
7. Sessions / time filter
• Optional London/NY “kill zone” participation filter.
8. Correlation (optional)
• Simple BTC trend check for USD-quoted markets.
Pre-Move (yellow) logic:
Triggers only when the market is compressed (squeeze/low fractal energy), ADX is rising, the MACD histogram is near zero (pressure building), and there is a money-flow impulse (MFI slope and/or OBV Z-score spike).
The yellow diamond is plotted on the side of the expected move:
• Below for bullish reversals / Above for bullish breakouts.
• Above for bearish reversals / Below for bearish breakouts.
A built-in cooldown keeps yellows from spamming.
⸻
What appears on the chart
• Bull diamond (green): Total score ≥ your threshold and > bear score.
• Bear diamond (magenta): Mirror of the above.
• Pre-move (yellow): Early heads-up; use it with HTF context and structure.
All diamonds are intentionally tiny to minimize clutter.
⸻
Key settings
• Signal Mode & Min Probability – tighten/loosen confirmations.
• Use Higher TF in Scoring – soft weighting (default).
• Require HTF Alignment – optional hard gate.
• Module toggles – Smart Money, Wyckoff, FVG, Correlation, Sessions.
• Pre-Move – enable, cooldown bars, MFI levels, OBV Z-score threshold.
⸻
How to use (practical)
1. Choose a TF that matches your style (5–15m intraday, 1H–4H swing).
2. Read HTF bias first; trade in that direction unless structure clearly supports a reversal.
3. Treat yellow as “get ready.” Act only when a green/magenta prints with structure (S/R, FVG, HVN) and acceptable risk.
4. Place stops beyond the liquidity level or FVG midpoint; size positions conservatively.
⸻
Repainting & HTF policy
• No lookahead is used anywhere.
• request.security is called on confirmed bars; the HTF MACD line is computed inside the HTF context (single series), not by indexing a tuple.
• Signals are designed for bar-close confirmation. Intra-bar alerts can change until the bar closes.
⸻
Limitations (honest)
• Money-flow features depend on volume quality; thin/synthetic volume reduces reliability.
• Pre-moves can fail during unscheduled news shocks or when HTF trend is dominant.
• This is not financial advice. You are responsible for entries, exits, and risk.
⸻
Alerts
Built-in bull/bear alerts include direction and a probability bucket (Basic/Moderate/Strong/Extreme).
Pre-move yellows are primarily visual; you can still set an alert on their plot condition if desired.
⸻
Why this isn’t a “mashup”
• A single probability engine blends HTF bias, structure (liquidity/Wyckoff/FVG), regime, and volume into a score, rather than stacking unrelated indicators.
• A pre-move detector that requires compression + rising trend energy + money-flow impulse, and places the marker on the side of the expected move, with cooldown control.
• A lightweight rolling HVN check to bias continuation vs mean-reversion near key nodes.
⸻
Changelog (summary)
• Current release: pre-move module, HTF hard-gate option, tiny diamonds, clarified HTF/no-repaint policy, session filter tidy-up.

Cyclic Reversal Engine [AlgoPoint]Overview
Most indicators focus on price and momentum, but they often ignore a critical third dimension: time. Markets move in rhythmic cycles of expansion and contraction, but these cycles are not fixed; they speed up in trending markets and slow down in choppy conditions.
The Cyclic Reversal Engine is an advanced analytical tool designed to decode this rhythm. Instead of relying on static, lagging formulas, this indicator learns from past market behavior to anticipate when the current trend is statistically likely to reach its exhaustion point, providing high-probability reversal signals.
It achieves this by combining a sophisticated time analysis with a robust price-action confirmation.
How It Works: The Core Logic
The indicator operates on a multi-stage process to identify potential turning points in the market.
1. Market Regime Analysis (The Brain): Before analyzing any cycles, the indicator first diagnoses the current "personality" of the market. Using a combination of the ADX, Choppiness Index, and RSI, it classifies the market into one of three primary regimes:
- Trending: Strong, directional movement.
- Ranging: Sideways, non-directional chop.
- Reversal: An over-extended state (overbought/oversold) where a turn is imminent.
2. Adaptive Cycle Learning (The "Machine Learning" Aspect): This is the indicator's smartest feature. It constantly analyzes past cycles by measuring the bar-count between significant swing highs and swing lows. Crucially, it learns the average cycle duration for each specific market regime. For example, it learns that "in a strong trending market, a new swing low tends to occur every 35 bars," while "in a ranging market, this extends to 60 bars."
3. The Countdown & Timing Signal: The indicator identifies the last major swing high or low and starts a bar-by-bar countdown. Based on the current market regime, it selects the appropriate learned cycle length from its memory. When the bar count approaches this adaptive target, the indicator determines that a reversal is "due" from a timing perspective.
4. Price Confirmation (The Trigger): A signal is never generated based on timing alone. Once the timing condition is met (the cycle is "due"), the indicator waits for a final price-action confirmation. The default confirmation is the RSI entering an extreme overbought or oversold zone, signaling momentum exhaustion. The signal is only triggered when Time + Price Confirmation align.
How to Use This Indicator
- The Dashboard: The panel in the bottom-right corner is your command center.
- Market Regime: Shows the current market personality analyzed by the engine.
- Adaptive Cycle / Bar Count: This is the core of the indicator. It shows the target cycle length for the current regime (e.g., 50) and the current bar count since the last swing point (e.g., 45). The background turns orange when the bar count enters the "due zone," indicating that you should be on high alert for a reversal.
- BUY/SELL Signals: A label appears on the chart only when the two primary conditions are met:
The timing is right (Bar Count has reached the Adaptive Cycle target).
The price confirms exhaustion (RSI is in an extreme zone).
A BUY signal suggests a downtrend cycle is likely complete, and a SELL signal suggests an uptrend cycle is likely complete.
Key Settings
- Pivot Lookback: Controls the sensitivity of the swing point detection. Higher values will identify more significant, longer-term cycles.
- Market Regime Engine: The ADX, Choppiness, and RSI settings can be fine-tuned to adjust how the indicator classifies the market's personality.
- Require Price Confirmation: You can toggle the RSI confirmation on or off. It is highly recommended to keep it enabled for higher-quality signals.

RB — Rejection Blocks (Price Structure)This indicator detects and visualizes Rejection Blocks (RBs) using pure price action logic.
A bullish RB occurs when a down candle forms a lower low than both its neighbors. A bearish RB occurs when an up candle forms a higher high than both its neighbors.
Validated RBs are displayed as boxes, optional lines, or labels. Blocks are automatically removed when invalidated (price closes through them), keeping the chart uncluttered and focused.
How to use
• Apply on any timeframe, from intraday to higher timeframes.
• Watch how price reacts when revisiting RB zones.
• Treat these zones as contextual areas, not entry signals.
• Combine with your own trading methods for confirmation.
Originality
Unlike generic support/resistance tools, this indicator isolates a specific structural pattern (rejection blocks) and renders it visually on the chart. This selective focus allows traders to study structural reactions with more clarity and precision.
⚠️ Disclaimer: This is not a trading system or a signal provider. It is a visual analysis tool designed for structural and educational purposes.

POC Migration Velocity (POC-MV) [PhenLabs]📊POC Migration Velocity (POC-MV)
Version: PineScript™v6
📌Description
The POC Migration Velocity indicator revolutionizes market structure analysis by tracking the movement, speed, and acceleration of Point of Control (POC) levels in real-time. This tool combines sophisticated volume distribution estimation with velocity calculations to reveal hidden market dynamics that conventional indicators miss.
POC-MV provides traders with unprecedented insight into volume-based price movement patterns, enabling the early identification of continuation and exhaustion signals before they become apparent to the broader market. By measuring how quickly and consistently the POC migrates across price levels, traders gain early warning signals for significant market shifts and can position themselves advantageously.
The indicator employs advanced algorithms to estimate intra-bar volume distribution without requiring lower timeframe data, making it accessible across all chart timeframes while maintaining sophisticated analytical capabilities.
🚀Points of Innovation
Micro-POC calculation using advanced OHLC-based volume distribution estimation
Real-time velocity and acceleration tracking normalized by ATR for cross-market consistency
Persistence scoring system that quantifies directional consistency over multiple periods
Multi-signal detection combining continuation patterns, exhaustion signals, and gap alerts
Dynamic color-coded visualization system with intensity-based feedback
Comprehensive customization options for resolution, periods, and thresholds
🔧Core Components
POC Calculation Engine: Estimates volume distribution within each bar using configurable price bands and sophisticated weighting algorithms
Velocity Measurement System: Tracks the rate of POC movement over customizable lookback periods with ATR normalization
Acceleration Calculator: Measures the rate of change of velocity to identify momentum shifts in POC migration
Persistence Analyzer: Quantifies how consistently POC moves in the same direction using exponential weighting
Signal Detection Framework: Combines trend analysis, velocity thresholds, and persistence requirements for signal generation
Visual Rendering System: Provides dynamic color-coded lines and heat ribbons based on velocity and price-POC relationships
🔥Key Features
Real-time POC calculation with 10-100 configurable price bands for optimal precision
Velocity tracking with customizable lookback periods from 5 to 50 bars
Acceleration measurement for detecting momentum changes in POC movement
Persistence scoring to validate signal strength and filter false signals
Dynamic visual feedback with blue/orange color scheme indicating bullish/bearish conditions
Comprehensive alert system for continuation patterns, exhaustion signals, and POC gaps
Adjustable information table displaying real-time metrics and current signals
Heat ribbon visualization showing price-POC relationship intensity
Multiple threshold settings for customizing signal sensitivity
Export capability for use with separate panel indicators
🎨Visualization
POC Connecting Lines: Color-coded lines showing POC levels with intensity based on velocity magnitude
Heat Ribbon: Dynamic colored ribbon around price showing POC-price basis intensity
Signal Markers: Clear exhaustion top/bottom signals with labeled shapes
Information Table: Real-time display of POC value, velocity, acceleration, basis, persistence, and current signal status
Color Gradients: Blue gradients for bullish conditions, orange gradients for bearish conditions
📖Usage Guidelines
POC Calculation Settings
POC Resolution (Price Bands): Default 20, Range 10-100. Controls the number of price bands used to estimate volume distribution within each bar
Volume Weight Factor: Default 0.7, Range 0.1-1.0. Adjusts the influence of volume in POC calculation
POC Smoothing: Default 3, Range 1-10. EMA smoothing period applied to the calculated POC to reduce noise
Velocity Settings
Velocity Lookback Period: Default 14, Range 5-50. Number of bars used to calculate POC velocity
Acceleration Period: Default 7, Range 3-20. Period for calculating POC acceleration
Velocity Significance Threshold: Default 0.5, Range 0.1-2.0. Minimum normalized velocity for continuation signals
Persistence Settings
Persistence Lookback: Default 5, Range 3-20. Number of bars examined for persistence score calculation
Persistence Threshold: Default 0.7, Range 0.5-1.0. Minimum persistence score required for continuation signals
Visual Settings
Show POC Connecting Lines: Toggle display of colored lines connecting POC levels
Show Heat Ribbon: Toggle display of colored ribbon showing POC-price relationship
Ribbon Transparency: Default 70, Range 0-100. Controls transparency level of heat ribbon
Alert Settings
Enable Continuation Alerts: Toggle alerts for continuation pattern detection
Enable Exhaustion Alerts: Toggle alerts for exhaustion pattern detection
Enable POC Gap Alerts: Toggle alerts for significant POC gaps
Gap Threshold: Default 2.0 ATR, Range 0.5-5.0. Minimum gap size to trigger alerts
✅Best Use Cases
Identifying trend continuation opportunities when POC velocity aligns with price direction
Spotting potential reversal points through exhaustion pattern detection
Confirming breakout validity by monitoring POC gap behavior
Adding volume-based context to traditional technical analysis
Managing position sizing based on POC-price basis strength
⚠️Limitations
POC calculations are estimations based on OHLC data, not true tick-by-tick volume distribution
Effectiveness may vary in low-volume or highly volatile market conditions
Requires complementary analysis tools for complete trading decisions
Signal frequency may be lower in ranging markets compared to trending conditions
Performance optimization needed for very short timeframes below 1-minute
💡What Makes This Unique
Advanced Estimation Algorithm: Sophisticated method for calculating POC without requiring lower timeframe data
Velocity-Based Analysis: Focus on POC movement dynamics rather than static levels
Comprehensive Signal Framework: Integration of continuation, exhaustion, and gap detection in one indicator
Dynamic Visual Feedback: Intensity-based color coding that adapts to market conditions
Persistence Validation: Unique scoring system to filter signals based on directional consistency
🔬How It Works
Volume Distribution Estimation:
Divides each bar into configurable price bands for volume analysis
Applies sophisticated weighting based on OHLC relationships and proximity to close
Identifies the price level with maximum estimated volume as the POC
Velocity and Acceleration Calculation:
Measures POC rate of change over specified lookback periods
Normalizes values using ATR for consistent cross-market performance
Calculates acceleration as the rate of change of velocity
Signal Generation Process:
Combines trend direction analysis using EMA crossovers
Applies velocity and persistence thresholds to filter signals
Generates continuation, exhaustion, and gap alerts based on specific criteria
💡Note:
This indicator provides estimated POC calculations based on available OHLC data and should be used in conjunction with other analysis methods. The velocity-based approach offers unique insights into market structure dynamics but requires proper risk management and complementary analysis for optimal trading decisions.

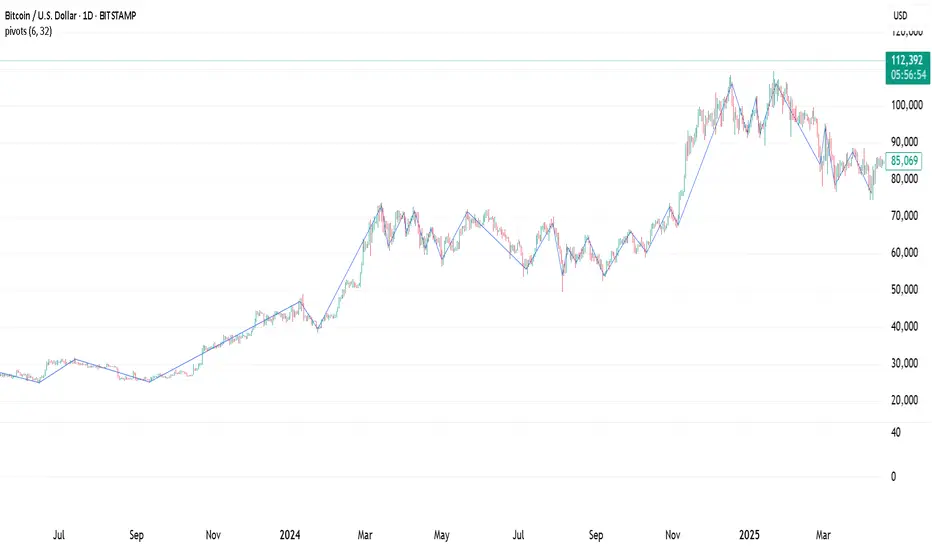
Pivot Points. High & Lows By Reversal PercentageLibrary "Pivot Points. High & Lows By Reversal Percentage" by Jal9000
This Pine Script library provides a robust function for identifying and tracking pivot points (reversal points) in price data, suitable for integration into custom trading indicators and strategies.
🛠️ Main Features:
- ✅ Identifies pivot highs and lows based on configurable price movement thresholds.
- ✅ Lightweight. No candle backtracing used. Much less computation heavy.
- ✅ Supports multiple calls (with different values) within a single script.
- ✅ Compatible with request.security for multi-timeframe analysis.
- ✅ Returns both confirmed and temporary pivots for flexible integration.
- ✅ Pinescript V5 and V6 compliant code.
Purpose:
The pivots library enables Pine Script developers to easily add pivot point detection to their scripts. It identifies significant price reversals by evaluating price movements against a minimum range threshold ( min_range_pct ) and confirming reversals based on a percentage ( reversal_pct ) of the prior trend’s magnitude. The library supports multiple simultaneous calls with different settings, making it ideal for multi-timeframe strategies.
How It Works:
The library’s f_calculatePivot function tracks price movements to detect pivot points:
Minimum Range Threshold : A potential pivot is considered if the price moves beyond the min_range_pct percentage of the current high (for a high pivot) or low (for a low pivot), ensuring sufficient movement.
Reversal Confirmation : A pivot is confirmed if the price reverses from the potential pivot by at least the reversal_pct percentage of the distance between the last confirmed pivot and the current potential pivot, measuring the retracement relative to the prior trend’s magnitude.
The function alternates between tracking highs (in an uptrend) and lows (in a downtrend), updating the trend when a pivot is confirmed.
State management uses an array of pivot_state objects, allowing independent calculations for different timeframes and min_range_pct values within the same script.
## Technical Reference
Functions:
f_calculatePivot(series float _high, series float _low, float _min_range_pct, float _reversal_pct) →
- Parameters:
_high : The high price series (e.g., high or math.max(open, close) ).
_low : The low price series (e.g., low or math.min(open, close) ).
_min_range_pct : The minimum percentage price movement to consider a potential pivot.
_reversal_pct : The percentage of the prior trend’s distance required to confirm a pivot.
- Returns:
A tuple containing:
isNewPivot : Boolean indicating if a new pivot was confirmed.
last_confirmed_pivot : The most recent confirmed pivot (type pivot ).
temp_pivot : The current temporary pivot (type pivot ).
Pivot type:
idx (series int) : Bar index of the pivot.
typ (series int) : Type of pivot ( PIVOT_HIGH or PIVOT_LOW ).
prc (series float) : Price of the pivot.
tme (series int) : Timestamp of the pivot.
Constants (internal):
TREND_LONG , TREND_SHORT : Trend direction indicators (1, -1).
PIVOT_HIGH , PIVOT_LOW : Pivot type indicators (1, -1).
✨ Example of Use:
//@version=5
indicator("Pivot Example", overlay=true)
import jal9000/pivots/1 as pivots
// Inputs
min_range_pct = input.float(20.0, 'Min Range %')
reversal_pct = input.float(30.0, 'Reversal %')
ignore_wick = input.bool(true, 'Ignore wick')
h = ignore_wick ? math.max(open, close) : high
l = ignore_wick ? math.min(open, close) : low
// Call the function with high, low, and input parameters
= pivots.f_calculatePivot(h, l, min_range_pct, reversal_pct)
// Variable to store previous confirmed pivot outside the function
var pivots.pivot prev_confirmed_pivot = na
// Draw the line if a new pivot is confirmed and previous pivot exists
if is_new_pivot
if not na(prev_confirmed_pivot) and not na(new_confirmed_pivot)
line.new(x1 = prev_confirmed_pivot.idx, y1 = prev_confirmed_pivot.prc, x2 = new_confirmed_pivot.idx, y2 = new_confirmed_pivot.prc, color = color.blue, width = 1)
prev_confirmed_pivot := new_confirmed_pivot
## Release Notes
v1
- Initial release of the pivots library with f_calculatePivot function for detecting pivot points and supporting multiple configurations and timeframes.
v2
- Code is Pinescript V6 ready. Remains identified as V5, but changing the version number is the only thing that is required to be v6.
Dynamic Value Zone Oscillator (DVZO) - @CRYPTIK1Dynamic Value Zone Oscillator (DVZO) @CRYPTIK1
Introduction: What is the DVZO?
The Dynamic Value Zone Oscillator (DVZO) is a powerful momentum indicator that reframes the classic "overbought" and "oversold" concept. Instead of relying on a fixed lookback period like a standard RSI or Stochastics, the DVZO measures the current price relative to a significant, higher-timeframe Value Zone (e.g., the previous week's entire price range).
This gives you a more contextual and structural understanding of price. The core question it answers is not just "Is the price moving up or down quickly?" but rather, "Where is the current price in relation to its recently established area of value?"
This allows traders to identify true "premium" (overbought) and "discount" (oversold) levels with greater accuracy, leading to higher-probability reversal and trend-following signals.
The Core Concept: Price vs. Value
The market is constantly trying to find equilibrium or "fair value." The DVZO is built on the principle that the high and low of a significant prior period (like the previous day, week, or month) create a powerful area of perceived value.
The Value Zone: The range between the high and low of the selected higher timeframe. The midpoint of this zone is the equilibrium (0 line on the oscillator).
Premium Territory (Distribution Zone): When price breaks above the Value Zone High (+100 line), it is trading at a premium. This is an area where sellers are more likely to become active and buyers may be over-extending.
Discount Territory (Accumulation Zone): When price breaks below the Value Zone Low (-100 line), it is trading at a discount. This is an area where buyers are more likely to see value and sellers may be exhausted.
By anchoring its analysis to these significant structural levels, the DVZO filters out much of the noise from lower-timeframe price fluctuations.
Key Features
The Oscillator:
The main blue line visualizes exactly where the current price is within the context of the Value Zone.
+100: The high of the Value Zone.
0: The midpoint/equilibrium of the Value Zone.
-100: The low of the Value Zone.
Automatic Divergence Detection:
The DVZO automatically identifies and plots bullish and bearish divergences on both the price chart and the oscillator itself.
Bullish Divergence: Price makes a new low, but the DVZO makes a higher low. This is a strong signal that downside momentum is fading and a reversal to the upside is likely.
Bearish Divergence: Price makes a new high, but the DVZO makes a lower high. This indicates that upside momentum is waning and a pullback is probable.
Value Migration Histogram:
The purple histogram in the background visualizes the width of the Value Zone.
Expanding Histogram: Volatility is increasing, and the accepted value range is getting wider.
Contracting Histogram: Volatility is decreasing, and the price is coiling in a tight range, often in anticipation of a major breakout.
How to Use the DVZO: Trading Strategies
1. Reversion Trading
This is the most direct way to use the indicator.
Look for Buys: When the DVZO line drops below -100, the price is in the "Accumulation Zone." Wait for the price to show signs of strength (e.g., a bullish candle pattern) and the DVZO line to start turning back up towards the -100 level. This is a high-probability mean reversion setup.
Look for Sells: When the DVZO line moves above +100, the price is in the "Distribution Zone." Look for signs of weakness (e.g., a bearish engulfing candle) and the DVZO line to start turning back down towards the +100 level.
2. Divergence Trading
Divergences are powerful confirmation signals.
Entry Signal: When a Bullish Divergence appears, it provides a strong entry signal for a long position, especially if it occurs within the Accumulation Zone (below -100).
Exit/Short Signal: When a Bearish Divergence appears, it can serve as a signal to take profit on long positions or to look for a short entry, especially if it occurs in the Distribution Zone (above +100).
3. Best Practices & Settings
Timeframe Synergy: The DVZO is most effective when your chart timeframe is lower than your selected Value Zone Source.
For Day Trading (e.g., 1H, 4H chart): Use the "Previous Day" Value Zone.
For Swing Trading (e.g., 1D, 12H chart): Use the "Previous Week" or "Previous Month" Value Zone.
Confirmation is Key: The DVZO is a powerful tool, but it should not be used in isolation. Always combine its signals with other forms of analysis, such as market structure, support/resistance levels, and candlestick patterns, for confirmation.
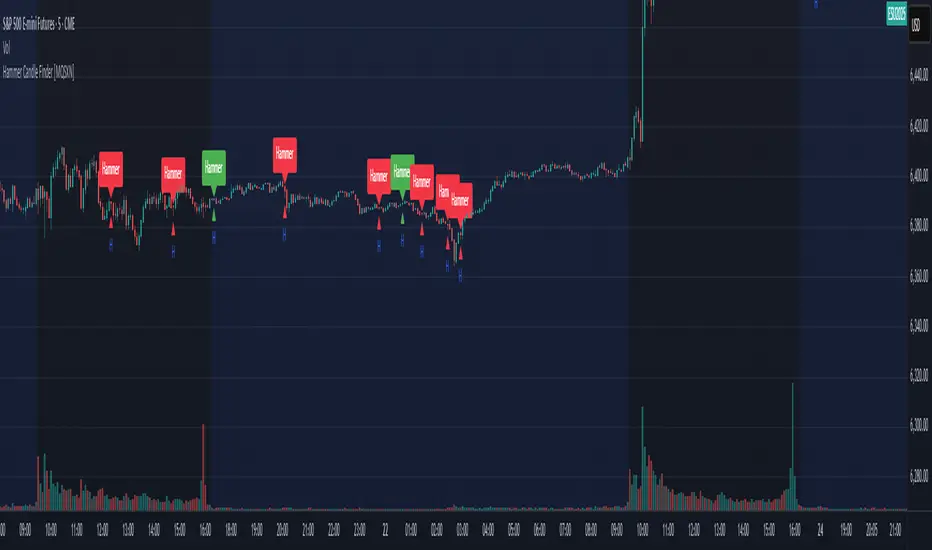
Hammer Candle Finder [MQSXN]This script automatically scans your chart for hammer candlestick patterns and highlights them with fully customizable labels and markers. Hammers are classic price action signals that can suggest potential reversals or exhaustion in the current trend.
How it works:
- Detects candles with a small body near the top of the range, a long lower wick, and minimal upper wick.
- Separates bullish hammers (green close above open) from bearish hammers (red close below open).
- You can choose to display either type—or both—depending on your trading style.
Customizable options:
- Adjustable detection sensitivity (body % of range, wick-to-body ratio, top wick allowance).
- Toggle to show/hide bullish or bearish signals.
- Custom text, colors, label style, and positioning for the markers.
- Option to anchor labels above bars automatically or offset them by a set number of ticks.
Usage:
This tool is designed for traders who want a clear, visual way to spot hammer candles in real time or during historical chart analysis. Combine it with your own support/resistance zones, volume analysis, or confirmation indicators to build complete strategies.
Note:
This indicator does not provide buy/sell signals on its own—it’s meant to assist with candlestick recognition. Always confirm with your broader trading plan and risk management rules.
Reverse RSI Signals [AlgoAlpha]🟠 OVERVIEW
This script introduces the Reverse RSI Signals system, an original approach that inverts traditional RSI values back into price levels and then overlays them directly on the chart as dynamic bands. Instead of showing RSI in a subwindow, the script calculates the exact price thresholds that correspond to common RSI levels (30/70/50) and displays them as upper, lower, and midline bands. These are further enhanced with an adaptive Supertrend filter and divergence detection, allowing traders to see overbought/oversold zones translated into actionable price ranges and trend signals. The script combines concepts of RSI inversion, volatility envelopes, and divergence tracking to provide a context-driven tool for spotting reversals and regime shifts.
🟠 CONCEPTS
The script relies on inverting RSI math: by solving for the price that would yield a given RSI level, it generates real chart levels tied to oscillator conditions. These RSI-derived price bands act like support/resistance, adapting each bar as RSI changes. On top of this, a Supertrend built around the RSI midline introduces directional bias, switching regimes when the midline is breached. Regular bullish and bearish divergences are detected by comparing RSI pivots against price pivots, highlighting early reversal conditions. This layered approach means the indicator is not just RSI on price but a hybrid of oscillator translation, volatility-tracking midline envelopes, and divergence analysis.
🟠 FEATURES
Inverted RSI bands: upper (70), lower (30), and midline (50), smoothed with EMA for noise reduction.
Supertrend overlay on the RSI midline to confirm regime direction (bullish or bearish).
Gradient-filled zones between outer and inner RSI bands to visualize proximity and exhaustion.
Non-repainting bullish and bearish divergence markers plotted directly on chart highs/lows.
🟠 USAGE
Apply the indicator to any chart and use the plotted RSI price bands as adaptive support/resistance. The midline defines equilibrium, while upper and lower bands represent classic RSI thresholds translated into real price action. In bullish regimes (green candles), long trades are stronger when price approaches or bounces from the lower band; in bearish regimes (red candles), shorts are favored near the upper band. Divergence markers (▲ for bullish, ▼ for bearish) flag potential reversal points early. Traders can combine the band proximity, divergence alerts, and Supertrend context to time entries, exits, or to refine ongoing trend trades. Adjust smoothing and Supertrend ATR settings to match the volatility of the instrument being analyzed.

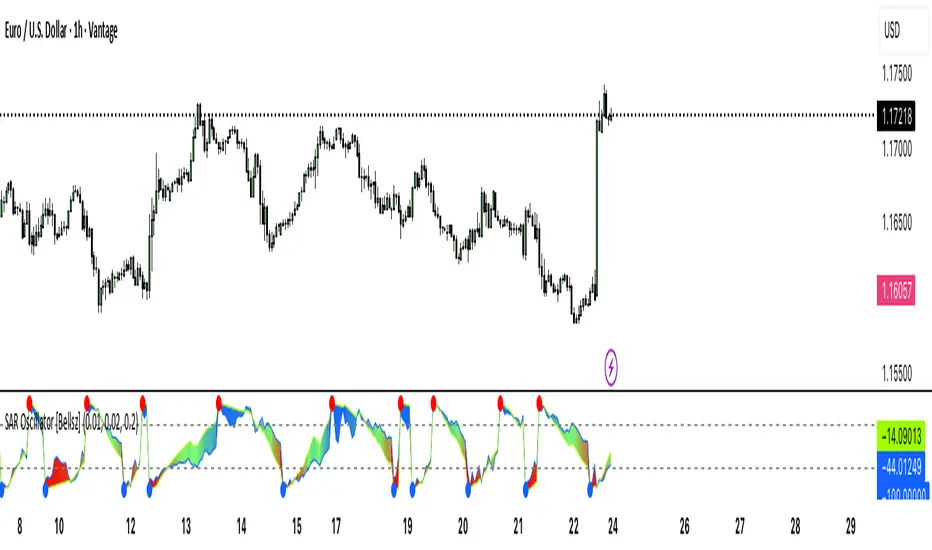
SAR Oscillator [Bellsz]Converts Parabolic SAR into a normalized oscillator with crossover signals, gradient fills, and trend strength levels. A cleaner way to read SAR momentum. Making it easier to read momentum shifts, trend strength, and reversals directly in the sub-chart. Instead of dots on price only, this tool converts SAR dynamics into a smooth oscillator that highlights bias and turning points.
What it shows
Normalized Price Line — scaled view of price relative to SAR.
Normalized SAR Line — SAR value normalized across the high/low range.
SAR Dots — visual cue when crossovers occur (potential reversal or trend acceleration).
Gradient Fill — color-coded background for quick read of momentum direction/intensity.
Guide Levels — ±50 baseline to track trend strength and overextension.
Why use it
Converts SAR into an oscillator format, easier to compare across instruments & timeframes.
Highlights momentum shifts early (crossovers, gradient flips).
Adds structure with gradient fill and baselines, making SAR more actionable than standard dot plots.
Works as a trend bias filter or confirmation tool alongside other indicators.
Inputs
Acceleration / Increment / Maximum — adjust SAR sensitivity.
Custom Colors — choose your scheme for price, SAR, and gradients.
Best practices
Use on intraday or swing TFs as a trend bias filter.
Look for Normalized Price crossing Normalized SAR as potential entry signals.
Watch how SAR dots cluster near ±100 for exhaustion or reversal signals.
Notes
This is a visual enhancement of SAR; it does not repaint.
Combine with volume, FVGs, or session models for added context.
CVD Absorption + Confirmation [Orderflow & Volume]This indicator detects bullish and bearish absorption setups by combining Cumulative Volume Delta (CVD) with price action, candlestick, and volume confirmations.
🔹 What is Absorption?
Absorption happens when aggressive buyers/sellers push CVD to new highs or lows, but price fails to follow through.
Bearish absorption: CVD makes a higher high, but price does not.
Bullish absorption: CVD makes a lower low, but price does not.
This often signals that limit orders are absorbing aggressive market orders, creating potential reversal points.
🔹 Confirmation Patterns
Absorption signals are only shown if they are validated by one of the following patterns:
Engulfing candle with low volume → reversal faces little resistance.
Engulfing candle with high volume → strong aggressive participation.
Pin bar with high volume → absorption visible in the wick.
CVD flattening / slope reversal → shift in aggressive order flow.
🔹 Signals
✅ Bullish absorption confirmed → Green label below the bar.
❌ Bearish absorption confirmed → Red label above the bar.
Each label represents a potential reversal setup after orderflow absorption is validated.
🔹 Alerts
Built-in alerts are included for both bullish and bearish confirmations, so you can track setups in real-time without watching the chart 24/7.
📌 How to Use:
Best applied at key levels (supply/demand, VWAP, OR, liquidity zones).
Look for confluence with your trading strategy before taking entries.
Works on all markets and timeframes where volume is reliable.

Trendlines Oscillator [LuxAlgo]The Trendlines Oscillator helps traders identify trends and momentum based on the normalized distances between the current price and the most recently detected bullish and bearish trend lines.
The indicator features bullish and bearish momentum, a signal line with crossings, and multiple smoothing options.
🔶 USAGE
The indicator displays three lines: two for momentum and one for the signal. When one of the momentum lines (bullish or bearish) crosses the signal line, the tool displays a dot to indicate which momentum is gaining strength.
As a general rule, when the green bullish momentum line is above the red bearish momentum line, it indicates buyer strength. This means that the actual prices are farther from the support trend lines than the resistance trend lines. The opposite is true for seller strength.
To calculate bullish momentum, the tool first identifies bullish trend lines acting as support below the price. Then, it measures the delta between the price and those trend lines and normalizes the reading into the displayed momentum values.
The same process is used for bearish momentum, but with bearish trendlines acting as resistance above the price.
🔹 Length & Memory
Modifying the Length and Memory values will cause the tool to display different momentum values.
Traders can adjust the length to detect larger trendlines and adjust the memory to indicate how many trendlines the tool should consider.
As the chart above shows, smaller values make the tool more responsive, while larger values are useful for detecting larger trends.
🔹 Smoothing
By default, the data is not smoothed, and the signal uses a triangular moving average with a length of 10. Traders can smooth both the data and the signal line.
Traders can choose from up to ten different methods, or none. Some examples are shown on the chart above.
🔶 DETAILS
The steps for the calculations are as follows:
1. Gather the pivots, highs, and lows.
ph = fixnan(ta.pivothigh(lengthInput, lengthInput))
pl = fixnan(ta.pivotlow(lengthInput, lengthInput))
2. Calculate the slope and y-intercept for each trendline between contiguous lower highs (resistance) or higher lows (support).
if ph < ph
slope = (ph - ph )/(n-lengthInput - phx1)
res.unshift(l.new(ph - slope * phx1, slope))
if pl > pl
slope = (pl - pl )/(n-lengthInput - plx1)
sup.unshift(l.new(pl - slope * plx1, slope))
3. Calculate the value of each trendline on the current bar, then calculate the difference with the current price (delta). To calculate the relative sum of deltas, only consider trendlines below the price for support or above the price for resistance.
method get_point(l id, x)=>
id.slope * x + id.intercept
for element in sup
point = element.get_point(n)
if sourceInput > point
sup_sum += sourceInput - point
sup_den += math.abs(sourceInput - point)
for element in res
point = element.get_point(n)
if sourceInput < point
res_sum += point - sourceInput
res_den += math.abs(point - sourceInput)
4. Normalize the value from 0 to 100 by taking the sum of the relative values of the deltas divided by the sum of the absolute values of the deltas.
float supportLine = sup_sum / sup_den * 100
float resistanceLine = res_sum / res_den * 100
5. Smooth both values, then calculate the signal line as the difference between them.
float smoothSupport = smooth(supportLine,dataSmoothingInput,dataSmoothingLengthInput)
float smoothResistance = smooth(resistanceLine,dataSmoothingInput,dataSmoothingLengthInput)
float signal = math.abs(smoothSupport - smoothResistance)
float signalLine = smooth(signal,smoothingInput,smoothingLengthInput)
6. Calculate the crossing signals against the signal line, using only the first signal from each series of bullish or bearish crossings.
bullSignal = smoothSupport > signalLine and smoothSupport < signalLine
bearSignal = smoothResistance > signalLine and smoothResistance < signalLine
lastSignal := bullSignal and lastSignal == BEAR ? BULL : bearSignal and lastSignal == BULL ? BEAR : lastSignal
firstBull = ta.change(lastSignal) > 0
firstBear = ta.change(lastSignal) < 0
🔶 SETTINGS
Length: The size of the market structure used for trendline detection.
Memory: The number of trendlines used in calculations.
Source: The source for the calculations is closing prices by default.
🔹 Smoothing
Data Smoothing: Choose the smoothing method and length
Signal Smoothing: Choose the smoothing method and length

Smarter Money Concepts - Wyckoff Springs & Upthrusts [PhenLabs]📊Smarter Money Concepts - Wyckoff Springs & Upthrusts
Version: PineScript™v6
📌Description
Discover institutional manipulation in real-time with this advanced Wyckoff indicator that detects Springs (accumulation phases) and Upthrusts (distribution phases). It identifies when price tests support or resistance on high volume, followed by a strong recovery, signaling potential reversals where smart money accumulates or distributes positions. This tool solves the common problem of missing these subtle phase transitions, helping traders anticipate trend changes and avoid traps in volatile markets.
By combining volume spike detection, ATR-normalized recovery strength, and a sigmoid probability model, it filters out weak signals and highlights only high-confidence setups. Whether you’re swing trading or day trading, this indicator provides clear visual cues to align with institutional flows, improving entry timing and risk management.
🚀Points of Innovation
Sigmoid-based probability threshold for signal filtering, ensuring only statistically significant Wyckoff patterns trigger alerts
ATR-normalized recovery measurement that adapts to market volatility, unlike static recovery checks in traditional indicators
Customizable volume spike multiplier to distinguish institutional volume from retail noise
Integrated dashboard legend with position and size options for personalized chart visualization
Hidden probability plots for advanced users to analyze underlying math without chart clutter
🔧Core Components
Support/Resistance Calculator: Scans a user-defined lookback period to establish dynamic levels for Spring and Upthrust detection
Volume Spike Detector: Compares current volume to a 10-period SMA, multiplied by a configurable factor to identify significant surges
Recovery Strength Analyzer: Uses ATR to measure price recovery after breaks, normalizing for different market conditions
Probability Model: Applies sigmoid function to combine volume and recovery data, generating a confidence score for each potential signal
🔥Key Features
Spring Detection: Spots accumulation when price dips below support but recovers strongly, helping traders enter longs at potential bottoms
Upthrust Detection: Identifies distribution when price spikes above resistance but falls back, alerting to possible short opportunities at tops
Customizable Inputs: Adjust lookback, volume multiplier, ATR period, and probability threshold to match your trading style and market
Visual Signals: Clear + (green) and - (red) labels on charts for instant recognition of accumulation and distribution phases
Alert System: Triggers notifications for signals and probability thresholds, keeping you informed without constant monitoring
🎨Visualization
Spring Signal: Green upward label (+) below the bar, indicating strong recovery after support break for accumulation
Upthrust Signal: Red downward label (-) above the bar, showing failed breakout above resistance for distribution
Dashboard Legend: Customizable table explaining signals, positioned anywhere on the chart for quick reference
📖Usage Guidelines
Core Settings
Support/Resistance Lookback
Default: 20
Range: 5-50
Description: Sets bars back for S/R levels; lower for recent sensitivity, higher for stable long-term zones – ideal for spotting Wyckoff phases
Volume Spike Multiplier
Default: 1.5
Range: 1.0-3.0
Description: Multiplies 10-period volume SMA; higher values filter to significant spikes, confirming institutional involvement in patterns
ATR for Recovery Measurement
Default: 5
Range: 2-20
Description: ATR period for recovery strength; shorter for volatile markets, longer for smoother analysis of post-break recoveries
Phase Transition Probability Threshold
Default: 0.9
Range: 0.5-0.99
Description: Minimum sigmoid probability for signals; higher for strict filtering, ensuring only high-confidence Wyckoff setups
Display Settings
Dashboard Position
Default: Top Right
Range: Various positions
Description: Places legend table on chart; choose based on layout to avoid overlapping price action
Dashboard Text Size
Default: Normal
Range: Auto to Huge
Description: Adjusts legend text; larger for visibility, smaller for minimal space use
✅Best Use Cases
Swing Trading: Identify Springs for long entries in downtrends turning to accumulation
Day Trading: Catch Upthrusts for short scalps during intraday distribution at resistance
Trend Reversal Confirmation: Use in conjunction with other indicators to validate phase shifts in ranging markets
Volatility Plays: Spot signals in high-volume environments like news events for quick reversals
⚠️Limitations
May produce false signals in low-volume or sideways markets where volume spikes are unreliable
Depends on historical data, so performance varies in unprecedented market conditions or gaps
Probability model is statistical, not predictive, and cannot account for external factors like news
💡What Makes This Unique
Probability-Driven Filtering: Sigmoid model combines multiple factors for superior signal quality over basic Wyckoff detectors
Adaptive Recovery: ATR normalization ensures reliability across assets and timeframes, unlike fixed-threshold tools
User-Centric Design: Tooltips, customizable dashboard, and alerts make it accessible yet powerful for all trader levels
🔬How It Works
Calculate S/R Levels:
Uses the highest high and the lowest low over the lookback period to set dynamic zones
Establishes baseline for detecting breaks in Wyckoff patterns
Detect Breaks and Recovery:
Checks for price breaking support/resistance, then recovering on volume
Measures recovery strength via ATR for volatility adjustment
Apply Probability Model:
Combines volume spike and recovery into a sigmoid function for confidence score
Triggers signal only if above threshold, plotting visuals and alerts
💡Note:
For optimal results, combine with price action analysis and test settings on historical charts. Remember, Wyckoff patterns are most effective in trending markets – use lower probability thresholds for practice, then increase for live trading to focus on high-quality setups.

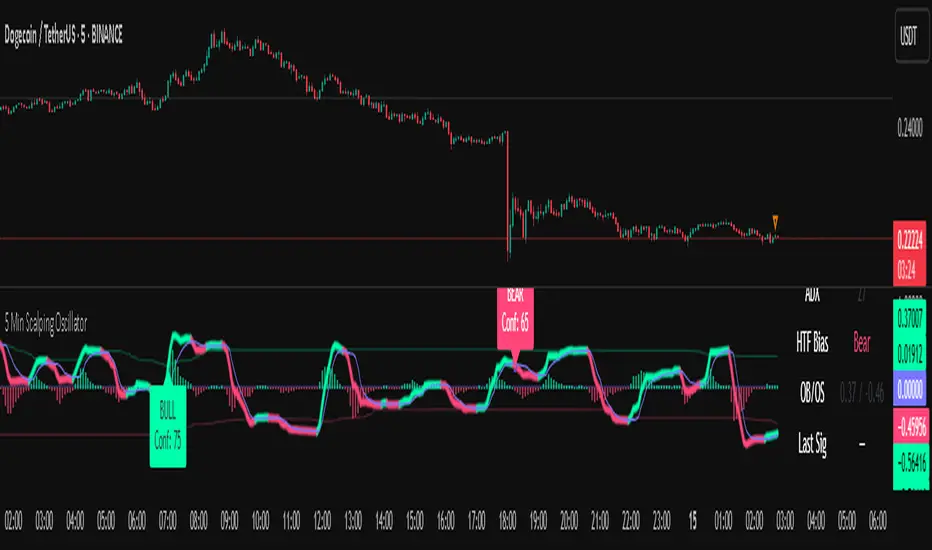
5 Min Scalping Oscillator### Overview
The 5 Min Scalping Oscillator is a custom oscillator designed to provide traders with a unified momentum signal by fusing normalized versions of the Relative Strength Index (RSI), Stochastic RSI, and Commodity Channel Index (CCI). This combination creates a more balanced view of market momentum, overbought/oversold conditions, and potential reversals, while incorporating adaptive smoothing, dynamic thresholds, and market condition filters to reduce noise and false signals. Unlike standalone oscillators, the 5 Min Scalping Oscillator adapts to trending or sideways regimes, volatility levels, and higher timeframe biases, making it particularly suited for short-term charts like 5-minute timeframes where quick, filtered signals are valuable.
### Purpose and Originality of the Fusion
Traditional oscillators like RSI measure momentum but can lag in volatile markets; Stochastic RSI adds sensitivity to RSI extremes but often generates excessive noise; and CCI identifies cyclical deviations but may overreact to minor price swings. The 5 Min Scalping Oscillator addresses these limitations by weighting and blending their normalized outputs (RSI at 45%, Stochastic RSI at 35%, and CCI at 20%) into a single raw oscillator value. This weighted fusion creates a hybrid signal that balances lag reduction with noise filtering, resulting in a more robust indicator for identifying reversal opportunities.
The originality lies in extending this fusion with:
- **Adaptive Smoothing via KAMA (Kaufman's Adaptive Moving Average):** Adjusts responsiveness based on market efficiency, speeding up in trends and slowing in ranges—unlike fixed EMAs, this helps preserve signal integrity without over-smoothing.
- **Dynamic Overbought/Oversold Thresholds:** Calculated using rolling percentiles over a user-defined lookback (default 200+ periods), these levels adapt to recent oscillator behavior rather than relying on static values like 70/30, making the indicator more responsive to asset-specific volatility.
- **Multi-Factor Filters:** Integrates ADX for trend detection, ATR percentiles for volatility confirmation, and optional higher timeframe RSI bias to ensure signals align with broader market context. This layered approach reduces false positives (e.g., ignoring low-volatility crossovers) and adds a confidence score based on filter alignment, which is not typically found in simple mashups.
This design justifies the combination: it's not a mere overlay of indicators but a purposeful integration that enhances usefulness by providing context-aware signals, helping traders avoid common pitfalls like trading against the trend or in low-volatility chop. The result is an original tool that performs better in diverse conditions, especially on 5-minute charts for intraday trading, where rapid adaptations are key.
### How It Works
The 5 Min Scalping Oscillator processes price data through these steps:
1. **Normalization and Fusion:**
- RSI (default length 10) is normalized to a -1 to +1 scale using a tanh transformation for bounded output.
- Stochastic RSI (default length 14) is derived from RSI highs/lows and scaled similarly.
- CCI (default length 14) is tanh-normalized to align with the others.
- These are weighted and summed into a raw value, emphasizing RSI for core momentum while using Stochastic RSI for edge sensitivity and CCI for cycle detection.
2. **Smoothing and Signal Line:**
- The raw value is smoothed (default KAMA with fast/slow periods 2/30 and efficiency length 10) to reduce whipsaws.
- A shorter signal line (half the smoothing length) is added for crossover detections.
3. **Filters and Enhancements:**
- **Trend Regime:** ADX (default length 14, threshold 20) classifies markets as trending (ADX > threshold) or sideways, allowing signals in both but prioritizing alignment.
- **Volatility Check:** ATR (default length 14) percentile (default 85%) ensures signals only trigger in above-average volatility, filtering out flat markets.
- **Higher Timeframe Bias:** Optional RSI (default length 14 on 60-minute timeframe) provides bull/neutral/bear bias (above 55, 45-55, below 45), requiring signal alignment (e.g., bullish signals only if bias is neutral or bull).
- **Dynamic Levels:** Percentiles (default OB 85%, OS 15%) over recent oscillator values set adaptive overbought/oversold lines.
4. **Signal Generation:**
- Bullish (B) signals on upward crossovers of the smoothed line over the signal line, filtered by conditions.
- Bearish (S) signals on downward crossunders.
- Each signal includes a confidence score (0-100) based on factors like trend alignment (25 points), volatility (15 points), and bias (20 points if strong, 10 if neutral).
The output includes a glowing oscillator line, histogram for divergence spotting, dynamic levels, shapes/labels for signals, and a dashboard table summarizing regime, ADX, bias, levels, and last signal.
### How to Use It
This indicator is easy to apply and interpret, even for beginners:
- **Adding to Chart:** Apply the 5 Min Scalping Oscillator to a clean chart (no other indicators unless explained). It's non-overlay, so it appears in a separate pane. For 5-minute timeframes, keep defaults or tweak lengths shorter for faster response (e.g., RSI 8-12).
- **Interpreting Signals:**
- Look for green upward triangles labeled "B" (bullish) at the bottom for potential entry opportunities in uptrends or reversals.
- Red downward triangles labeled "S" (bearish) at the top signal potential exits or shorts.
- Higher confidence scores (e.g., 70+) indicate stronger alignment—use these for priority trades.
- Watch the histogram for divergences (e.g., price higher highs but histogram lower highs suggest weakening momentum).
- Dynamic OB (green line) and OS (red line) help gauge extremes; signals near these are more reliable.
- **Dashboard:** At the bottom-right, it shows real-time info like "Trending" or "Sideways" regime, ADX value, HTF bias (Bull/Neutral/Bear), OB/OS levels, and last signal—use this for quick context.
- **Customization:** Adjust inputs via the settings panel:
- Toggle KAMA for adaptive vs. EMA smoothing.
- Set HTF to "60" for 1-hour bias on 5-min charts.
- Increase ADX threshold to 25 for stricter trend filtering.
- **Best Practices:** Combine with price action (e.g., support/resistance) or volume for confirmation. On 5-min charts, pair with a 1-hour HTF for intraday scalping. Always use stop-losses and risk no more than 1-2% per trade.
### Default Settings Explanation
Defaults are optimized for 5-minute charts on volatile assets like stocks or forex:
- RSI/Stoch/CCI lengths (10/14/14): Shorter for quick momentum capture.
- Signal smoothing (5): Responsive without excessive lag.
- ADX threshold (20): Balances trend detection.
- ATR percentile (0.85): Filters ~15% of low-vol signals.
- HTF RSI (14 on 60-min): Aligns with hourly trends.
- Percentiles (OB 85%, OS 15%): Adaptive to recent data.
If changing, test on historical data to ensure fit—e.g., longer lengths for less noisy assets.
### Disclaimer
The 5 Min Scalping Oscillator is an educational tool to visualize momentum and does not guarantee profits or predict future performance. All signals are based on historical calculations and should not be used as standalone trading advice. Past results are not indicative of future outcomes. Traders must conduct their own analysis, use proper risk management, and consider market conditions. No claims are made about accuracy, reliability, or performance.
DTLLC Time & PriceDTLLC Time and Price with Signals
This indicator is built for traders who understand ICT concepts and want a structured, visual way to align time-based price action with key market levels. By combining customizable trading windows, breakout logic, and daily reference points, it helps you identify high-probability trade opportunities while filtering out market noise.
Key Features
1. Dual Custom Time Ranges (Kill Zones)
Set two independent time ranges per day (start/end hour and minute).
Each range identifies the highest high and lowest low within its window.
Built-in breakout detection generates buy/sell signals when price moves beyond these levels.
2. Volatility Filtering
Adjustable volatility threshold based on True Range relative to ATR.
Filters out low-quality signals during choppy, low-volatility conditions.
3. ATR-Based Stop Loss
Custom ATR length and stop-loss multiplier settings.
Automatically plots ATR-based stop levels for triggered trades.
4. Daily Key Levels
Plots Previous Day High, Previous Day Low, and Midnight Open continuously on the chart.
Useful for spotting breakout and reversal opportunities in line with ICT market structure concepts.
5. Liquidity & Engulfing Candle Highlights
Highlights potential liquidity grab zones (yellow candles) when significant highs/lows are set within your lookback period.
Detects bullish (green) and bearish (red) engulfing patterns for added confluence.
6. Visual & Signal Tools
Buy/Sell signals plotted directly on chart (separate colors for Range 1 and Range 2). Continuous plotting of reference levels to maintain market context throughout the session.
Example Use Case:
A common ICT-inspired reversal setup:
Wait for price to sweep the Previous Day’s High or Low during your chosen time range.
Look for a buy or sell signal with volatility confirmation.
Manage risk using the ATR-based stop-loss plot.
Disclaimer: This script is for educational purposes only and is not financial advice. Trade responsibly and always test strategies before applying them in live markets.

Mayfair Reversal Change✅ Mayfair Reversal Change — By EastWave Capital
Description:
The Mayfair Reversal Change indicator is a tool designed to help traders identify potential market turning points using Stochastic Oscillator behavior and filtered price action logic. It acts as a reversal signal filter and is particularly effective when the market is overextended (overbought/oversold) and about to revert from exhaustion zones.
🔍 How It Works:
This script monitors the Stochastic %K and %D crossovers and adds a custom logic layer to filter only high-quality reversal points:
Stochastic Filter Conditions:
Uses smoothed stochastic settings:
%K smoothing = 3
%D smoothing = 3
Only shows signals after %K crosses back below 80 (for Sell) or above 20 (for Buy)
This prevents signals from appearing too early during an active overbought or oversold phase.
Directional Confirmation Logic:
Bullish signal is printed only when %K re-enters below 20 after a confirmed stochastic crossover.
Bearish signal appears only when %K re-enters above 80.
This reduces false signals that occur during continued trending moves.
Toggle Switch:
A user-toggle input is included to enable or disable the reversal filter logic.
This gives flexibility for traders who want to test signals with or without the stochastic condition.
📈 How to Use:
Timeframes: Recommended for 5M, 15M, and 30M
Markets: Compatible with any market — FX, Gold, Indices, Crypto
Entry Approach:
Wait for signal after price has reached a potential extreme area.
Confirm with chart structure, support/resistance, or SMC zone.
Enter on confirmation, placing stop loss beyond the swing high/low.
Combine with trendline breaks or price imbalances (FVG) for extra confluence.
Can be used in combination with the Mayfair FX Scalper script for dual-layer confirmation.
⚠️ Important Notes:
Signals are visual only and should be confirmed with proper strategy.
This indicator does not execute or manage trades automatically.
Designed to assist with reversal setups but should not be used in isolation.
Always manage risk, use SL/TP, and avoid over-leveraging.

Mayfair Fx Scalper✅ Mayfair FX Scalper — By EastWave Capital
The Mayfair FX Scalper is a precision-focused, closed-source indicator designed for short-term intraday trading, particularly scalping on lower timeframes such as 1-minute, 3-minute, and 5-minute charts. This tool is developed by EastWave Capital and is based on a combination of Relative Strength Index (RSI) extremes and specific candlestick structure patterns to detect potential exhaustion and reversal points in the market.
🔍 How It Works:
The algorithm operates by evaluating three core elements:
RSI Extremes:
RSI is calculated using default settings.
Buy signals are considered only when the RSI on the previous candle is below 22 (oversold), and the current candle is bullish, while the previous one was bearish.
Sell signals are considered when the RSI on the previous candle is above 78 (overbought), and the current candle is bearish, while the previous one was bullish.
Candle Confirmation Logic:
The system waits for candle confirmation (e.g., shift in bullish/bearish structure) rather than triggering signals based on RSI alone.
This avoids false triggers in strong trends and filters weak entries.
SL/TP Estimation (Visual):
While not automatically placing orders, the indicator can optionally display lines or small labels showing a Stop Loss at the previous swing high/low (±0.5) and TP levels at 1R, 2R, and 3R based on that stop.
These visual aids help traders plan risk/reward and exits manually.
📈 How to Use:
Timeframes: Best suited for 1M, 3M, and 5M charts
Markets: Works well on Gold (XAU/USD), Forex majors, Indices, and Crypto
Session: Performs best during high volatility sessions (London & NY)
Use Case:
Wait for a signal label to appear after a clear momentum move.
Confirm price action and trend context.
Use provided visual SL/TP labels or apply your manual RR planning.
Combine with structure breaks, FVG zones, or liquidity sweeps for confluence.
⚠️ Important Notes:
This indicator does not repaint.
No automatic trades are executed. Signals are visual.
Not intended for use in isolation; best when combined with proper trade management and confirmation tools.
Past performance does not guarantee future results. Always manage risk appropriately

NQ Climax Signals - Chart OverlayThis specialized overlay indicator identifies extreme volume exhaustion points (climaxes) in NQ1! (Nasdaq 100 E-mini futures) that often signal major market reversals. By analyzing volume spikes relative to historical patterns, it helps traders spot potential turning points before they become obvious to the broader market.
Key Features
🎯 Climax Detection Technology
Selling Climax: Extreme red candle volume indicating selling exhaustion (potential reversal UP)
Buying Climax: Extreme green candle volume indicating buying exhaustion (potential reversal DOWN)
Volume Ratio Analysis: Compares current volume to 30-day historical averages
Dynamic Thresholds: Adjustable sensitivity for different market conditions
📍 Precision Signal Placement
Chart Overlay: Signals appear directly on price bars where they occur
Fixed Positioning: Signals remain stable regardless of chart scaling or zoom level
Clear Visual Hierarchy: Purple for selling climax, blue for buying climax
Dual Display Options: Text labels or clean diamond shapes
⚡ Real-Time Analysis
Live Calculations: Updates with each new candle
30-Day Lookback: Analyzes recent volume patterns for context
Smart Filtering: Only triggers on true volume extremes
Background Highlighting: Subtle chart tinting during climax events
Trading Applications
🔄 Reversal Trading
Selling Climax at Support: High probability bounce setup
Buying Climax at Resistance: High probability rejection setup
Counter-trend Entries: Fade extreme moves with volume confirmation
Risk Management: Clear invalidation levels based on climax bars
📊 Market Structure Analysis
Volume Exhaustion Points: Identify where trends may pause or reverse
Institutional Activity: Spot large player capitulation or distribution
Market Sentiment Extremes: Recognize panic selling or euphoric buying
Confirmation Tool: Validate other technical analysis signals
How Volume Climaxes Work
🔴 Selling Climax (Purple Signals)
Definition: Extremely high volume on red candles
Psychology: Panic selling, forced liquidation, capitulation
Opportunity: Often marks short-term or intermediate bottoms
Action: Consider long positions with proper risk management
🔵 Buying Climax (Blue Signals)
Definition: Extremely high volume on green candles
Psychology: FOMO buying, euphoria, exhaustion buying
Opportunity: Often marks short-term or intermediate tops
Action: Consider short positions with proper risk management
Technical Specifications
📈 Algorithm Details
Volume Multiplier: Default 2.5x average (customizable 2.0-5.0x)
Ratio Threshold: Default 1.5 for trend confirmation
Lookback Period: 30 days (customizable 1-250 days)
Update Frequency: Real-time with each tick
🎛️ Customization Options
Show/Hide Labels: Toggle between text and diamond displays
Sensitivity Adjustment: Fine-tune trigger thresholds
Background Effects: Optional chart highlighting
Alert System: Comprehensive notification setup
Best Practices
✅ Optimal Usage
Combine with Support/Resistance: Climaxes near key levels are most reliable
Confirm with Price Action: Look for reversal candlestick patterns
Use Proper Position Sizing: Climax trades can be volatile
Set Clear Stops: Define risk before entering any position
⚠️ Important Considerations
Not Every Climax Reverses: Some lead to continuation after brief pause
Context Matters: Consider overall trend and market structure
Volume Quality: Higher timeframe confirmation strengthens signals
Risk Management: Always use appropriate stop losses
Educational Value
This indicator teaches traders to:
Recognize Volume Patterns: Understand how volume reveals market psychology
Identify Exhaustion: Spot when trends may be running out of steam
Time Market Entries: Enter near potential turning points
Develop Market Feel: Build intuition for volume-price relationships
Installation & Setup
Add this overlay indicator directly to your NQ futures chart
Adjust volume multiplier based on recent market volatility
Enable alerts for automatic climax notifications
Combine with the companion "NQ Volume Analysis" oscillator for complete analysis
Disclaimer
This indicator is for educational and informational purposes only. Volume climax signals do not guarantee reversals and should be used as part of a comprehensive trading strategy. Past performance does not predict future results. Trading futures involves substantial risk of loss and is not suitable for all investors.
💡 Developed by ProfitGang Trading Community
Advanced volume analysis tools for serious traders
🔔 Enable alerts to catch every climax signal!
⭐ Rate and review if this tool improves your trading!
Companion Tools
NQ Volume Analysis: Complete multi-timeframe volume oscillator
Works Best Together: Use both indicators for comprehensive volume analysis
Professional Trading Suite: Part of ProfitGang's advanced indicator collection
#NQFutures #VolumeClimax #ReversalTrading #VolumeAnalysis #FuturesTrading #TechnicalAnalysis #ProfitGang #TradingSignals

Internal Pivot Pattern [LuxAlgo]The Internal Pivot Pattern indicator is a novel method allowing traders to detect pivots without excessive delay on the chart timeframe, by using the lower timeframe data from a candle.
It features custom colors for candles and zigzag lines to help identify trends. A dashboard showing the accuracy of the pattern is also included.
🔶 USAGE
We define a pivot as the occurrence where the middle candle over a specific interval (for example, the most recent 21 bars) is the highest (pivot high) or the lowest (pivot low). This method commonly allows for identifying swing highs/lows on a trader's chart; however, this pattern can only be identified after a specific number of bars has been formed, rendering this pattern useless for real-time detection of swing highs/lows.
This indicator uses a different approach, removing the need to wait for candles to form on the user chart; instead, we check the lower timeframe data of the current candle and evaluate for the presence of a pivot given the internal data, effectively providing pivot confirmation at the candle close.
An internal pivot low pattern is indicative of a potential uptrend, while an internal pivot high is indicative of a potential downtrend.
Candles are colored based on the last internal pivot detected, with blue candle colors indicating that the most recent internal pivot is a pivot low, indicating an uptrend, while an orange candle color indicates that the most recent internal pivot is a pivot high, indicating a downtrend.
🔹 Timeframes
The timeframe setting allows controlling the amount of lower timeframe data to consider for the internal pivot detection. This setting must be lower than the user's chart timeframe.
Using a timeframe significantly lower than the user chart timeframe will evaluate a larger amount of data for the pivot detection, making it less frequent, while using a timeframe closer to the chart timeframe can make the internal pivot detection more frequent, and more prone to false positives.
🔹 Accuracy Dashboard
The Accuracy Dashboard allows evaluating how accurate the detected patterns are as a percentage, with a pattern being judged accurate if subsequent patterns are detected higher or lower than a previous one.
For example, an internal pivot low is judged accurate if the following internal pivot is higher than it, indicating that higher highs have been made.
This dashboard can be useful to determine the timeframe setting to maximize the respective internal pivot accuracy.
🔶 SETTINGS
Timeframe: Timeframe for detecting internal swings
Accuracy Dashboard: Enable or disable the Accuracy Dashboard.
🔹 Style
Internal Pivot High: Color of the dot displayed upon the detection of an internal pivot high
Internal Pivot Low: Color of the dot displayed upon the detection of an internal pivot low
Zig-Zag: Color of the zig-zag segments connecting each internal pivot
Candles: Enable candle coloring, with control over the color of the candles highlighting the detected trend
