Best Supertrend CCI StrategyHello traders
Someone requested the strategy version of the Supertrend CCI indicator
It's a Supertrend not based on candle close but based on a CCI ( Commodity Channel Index )
How does it work?
Bull event: CCI crossing over the 0 line
Bear event: CCI crossing below the 0 line
When the event is triggered, the script will plot the Supertrend as follow
UP Trend = High + ATR * Factor
DOWN Trend = Low - ATR * Factor
This is an alternative of the classical Supertrend based on candle close being above/beyond the previous Supertrend level.
Hope you'll enjoy it and it will improve your trading making you a better trader
Dave
Cerca negli script per "CCI"

Combo Strategy 123 Reversal & CCI This is combo strategies for get a cumulative signal.
First strategy
This System was created from the Book "How I Tripled My Money In The
Futures Market" by Ulf Jensen, Page 183. This is reverse type of strategies.
The strategy buys at market, if close price is higher than the previous close
during 2 days and the meaning of 9-days Stochastic Slow Oscillator is lower than 50.
The strategy sells at market, if close price is lower than the previous close price
during 2 days and the meaning of 9-days Stochastic Fast Oscillator is higher than 50.
Second strategy
The Commodity Channel Index (CCI) is best used with markets that display cyclical or
seasonal characteristics, and is formulated to detect the beginning and ending of these
cycles by incorporating a moving average together with a divisor that reflects both possible
and actual trading ranges. The final index measures the deviation from normal, which indicates
major changes in market trend.
To put it simply, the Commodity Channel Index (CCI) value shows how the instrument is trading
relative to its mean (average) price. When the CCI value is high, it means that the prices are
high compared to the average price; when the CCI value is down, it means that the prices are low
compared to the average price. The CCI value usually does not fall outside the -300 to 300 range
and, in fact, is usually in the -100 to 100 range.
WARNING:
- For purpose educate only
- This script to change bars colors.

Steroid CCI w/ Overbought & Oversold Alert//@version=2
//By Tantamount
//Channel Commodity Index (CCI) with overbought and oversold alert features! Highly configurable indicator that includes a Topography map feature, used to detect & show minute threshold crosses.
//CCI is a momentum based technical trading tool used to help determine when an asset is reaching an overbought or oversold condition and is an great alternative to RSI.
//This CCI tool comes loaded with features and is easily configurable back to standard CCI or with your own preferences.
Customize to your liking:
Simple alert signals
The full enchilada, with Topo map view!
Stand alone CCI oscillator

multi Stoch + MACD + CCI strategy (J)The Stochastic Oscillator (STOCH) is a range bound momentum oscillator. The Stochastic indicator is designed to display the location of the close compared to the high/low range over a user defined number of periods. Typically, the Stochastic Oscillator is used for three things; Identifying overbought and oversold levels, spotting divergences and also identifying bull and bear set ups or signals.
www.tradingview.com(STOCH)
MACD is an extremely popular indicator used in technical analysis. MACD can be used to identify aspects of a security's overall trend. Most notably these aspects are momentum, as well as trend direction and duration. What makes MACD so informative is that it is actually the combination of two different types of indicators. First, MACD employs two Moving Averages of varying lengths (which are lagging indicators) to identify trend direction and duration. Then, MACD takes the difference in values between those two Moving Averages (MACD Line) and an EMA of those Moving Averages (Signal Line) and plots that difference between the two lines as a histogram which oscillates above and below a center Zero Line. The histogram is used as a good indication of a security's momentum.
www.tradingview.com(Moving_Average_Convergence/Divergence)
The Commodity Channel Index (CCI) is a momentum oscillator used in technical analysis primarily to identify overbought and oversold levels by measuring an instrument's variations away from its statistical mean. CCI is a very well-known and widely-used indicator that has gained level of popularity in no small part of its versatility. Besides overbought/oversold levels, CCI is often used to find reversals as well as divergences. Originally, the indicator was designed to be used for identifying trends in commodities, however it is now used in a wide range of financial instruments.
www.tradingview.com(CCI)

Seve AltCoin CCI / EMA IndicatorCustom CCI and EMA alert script developed as a service. Published for verification and acceptance.
CCI / EMA Indicator
Full inputs for all Indicators
Inputs to control plotting
Flag CCI Crossing a threshold with price closing above EMA1 and EMA1 > EMA2
Flag CCI Crossing a threshold with price closing
CCI Crossing a upper / lower boundaries and price closing above EMA
Opposite markers for shorts

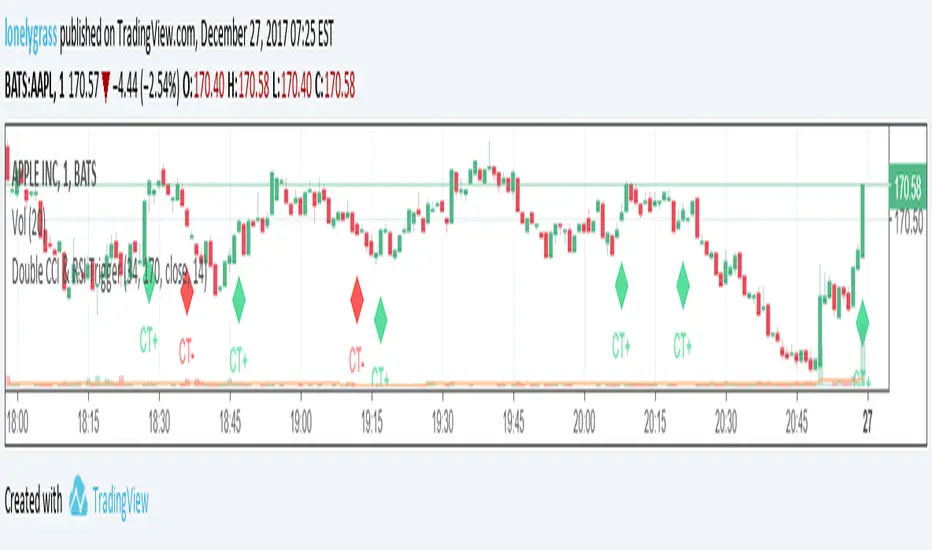
Double CCI & RSI TriggerWarning : This strategy can only be implemented with 1 minute timeframe chart
With the help of 2 CCI and 1 RSI, it is much easier to identify the market trend. The main idea of this EA is looking at a longer CCI (170 periods) and RSI (14 periods) and finding some possible bullish and bearish trends.
Bullish Conditions: 170 CCI has a value of above 0 and RSI 14 is larger than 30 (oversold)
Bearish Conditions: 170 CCI has a value of below 0 and RSI 14 is lower than 70 (overbought)
When conditions are met, CT+ (bullish) and CT- (bearish) signals will be shown on the graph.
To effectively adopt the system, users have to incorporate "Double CCI & RSI Alert" , my another script, into this and can decide whether or not to hold onto positions. Happy trading! Appreciate support and comments!
Coloured CCI Histogram V2.0 by JustUncleLThis is a requested update of this script. This is a standard CCI indicator that shows a coloured histogram of important CCI levels, giving a good visual of the CCI levels. Added to this version is an extra coloured level +/-200 and an option to calculate CCI with EMA instead of the standard SMA.
CCI LEVELS:
Light Green - Greater than 0 and less than 100.
Green - Greater than 100 and less than 200.
Aqua - Greater than 200.
Light Red - Less than 0 and greater than -100.
Red - Less than -100 and greater than -200.
Magenta - Less than -200.
If you would like different colour arrangement just change them in the "Style" settings of the indicator.
This study calculates CCI strategy The Commodity Channel Index (CCI) is best used with markets that display cyclical or
seasonal characteristics, and is formulated to detect the beginning and ending of these
cycles by incorporating a moving average together with a divisor that reflects both possible
and actual trading ranges. The final index measures the deviation from normal, which indicates
major changes in market trend.
To put it simply, the Commodity Channel Index (CCI) value shows how the instrument is trading
relative to its mean (average) price. When the CCI value is high, it means that the prices are
high compared to the average price; when the CCI value is down, it means that the prices are low
compared to the average price. The CCI value usually does not fall outside the -300 to 300 range
and, in fact, is usually in the -100 to 100 range.

ATR+CCI Monetary Risk Tool - TP/SL⚙️ ATR+CCI Monetary Risk Tool — Volatility-aware TP/SL & Position Sizing
Exact prices (no rounding), ATR-percentile dynamic stops, and risk-budget sizing for consistent execution.
🧠 What this indicator is
A risk-first planning tool. It doesn’t generate orders; it gives you clean, objective levels (Entry, SL, TP) and position size derived from your risk budget. It shows only the latest setup to keep charts readable, and a compact on-chart table summarizing the numbers you actually act on.
✨ What makes it different
Dynamic SL by regime (ATR percentile): Instead of a fixed multiple, the SL multiplier adapts to the current volatility percentile (low / medium / high). That helps avoid tight stops in noisy markets and over-wide stops in quiet markets.
Risk budgeting, not guesswork: Size is computed from Account Balance × Max Risk % divided by SL distance × point value. You risk the same dollars across assets/timeframes.
Precision that matches your instrument: Entry, TP, SL, and SL Distance are displayed as exact prices (no rounding), truncated to syminfo.mintick so they align with broker/exchange precision.
Symbol-aware point value: Uses syminfo.pointvalue so you don’t maintain tick tables.
Non-repaint option: Work from closed bars to keep the plan stable.
🔧 How to use (quick start)
Add to chart and pick your timeframe and symbol.
In settings:
Set Account Balance (USD) and Max Risk per Trade (%).
Choose R:R (1:1 … 1:5).
Pick ATR Period and CCI Period (defaults are sensible).
Keep Dynamic ATR ON to adapt SL by regime.
Keep Use closed-bar values ON to avoid repaint when planning.
Read the labels (Entry/TP/SL) and the table (SL Distance, Position Size, Max USD Risk, ATR Percentile, effective SL Mult).
Combine with your entry trigger (price action, levels, momentum, etc.). This indicator handles risk & targets.
📐 How levels are computed
Bias: CCI ≥ 0 ⇒ long, otherwise short.
ATR Percentile: Percent rank of ATR(atrPeriod) over a lookback window.
Effective SL Mult:
If percentile < Low threshold ⇒ use Low SL Mult (tighter).
If between thresholds ⇒ use Base SL Mult.
If percentile > High threshold ⇒ use High SL Mult (wider).
Stop-Loss: SL = Entry ± ATR × SL_Mult (minus for long, plus for short).
Take-Profit: TP = Entry ± (Entry − SL) × R (R from the R:R dropdown).
Position Size:
USD Risk = Balance × Risk%
Contracts = USD Risk ÷ (|Entry − SL| × PointValue)
For futures, quantity is floored to whole contracts.
Exact prices: Entry/TP/SL and SL Distance are not rounded; they’re truncated to mintick so what you see matches valid price increments.
📊 What you’ll see on chart
Latest Entry (blue), TP (green), SL (red) with labels (optional emojis: ➡️ 🎯 🛑).
Info Table with:
Bias, Entry, TP, SL (exact, truncated to mintick)
SL Distance (exact, truncated)
Position Size (contracts/units)
Max USD Risk
Point Value
ATR Percentile and effective SL Mult
🧪 Practical examples
High-volatility session (e.g., XAUUSD, 1H): ATR percentile is high ⇒ wider SL, smaller size. Reduces churn from normal noise during macro events.
Range-bound market (e.g., EURUSD, 4H): ATR percentile low ⇒ tighter SL, better R:R. Helps you avoid carrying unnecessary risk.
Index swing planning (e.g., ES1!, Daily): Non-repaint levels + risk budgeting = consistent sizing across days/weeks, easier to review and journal.
🧭 Why traders should use it
Consistency: Same dollar risk regardless of instrument or volatility regime.
Clarity: One-trade view forces focus; you see the numbers that matter.
Adaptivity: Stops calibrated to the market’s current behavior, not last month’s.
Discipline: A visible checklist (SL distance, size, USD risk) before you hit buy/sell.
🔧 Input guide (practical defaults)
CCI Period: 100 by default; use as a bias filter, not an entry signal.
ATR Period: 14 by default; raise for smoother, lower for more reactive.
ATR Percentile Lookback: 200 by default (stable regime detection).
Percentile thresholds: 33/66 by default; widen the gap to change how often regimes switch.
SL Mults: Start ~1.5 / 2.0 / 2.5 (low/base/high). Tune by asset.
Risk % per trade: Common pro ranges are 0.25–1.0%; adjust to your risk tolerance.
R:R: Start with 1:2 or 1:3 for balanced skew; adapt to strategy edge.
Closed-bar values: Keep ON for planning/live; turn OFF only for exploration.
💡 Best practices
Combine with your entry logic (structure, momentum, liquidity levels).
Review ATR percentile and effective SL Mult across sessions so you understand regime shifts.
For futures, remember size is floored to whole contracts—safer by design.
Journal trades with the table snapshot to improve risk discipline over time.
⚠️ Notes & limitations
This is not a strategy; it does not place orders or alerts.
No slippage/commissions modeled here; build a strategy() version for backtests that mirror your broker/exchange.
Displayed non-price metrics use two decimals; prices and SL Distance are exact (truncated to mintick).
📎 Disclaimer
For educational purposes only. Not financial advice. Markets involve risk. Test thoroughly before trading live.

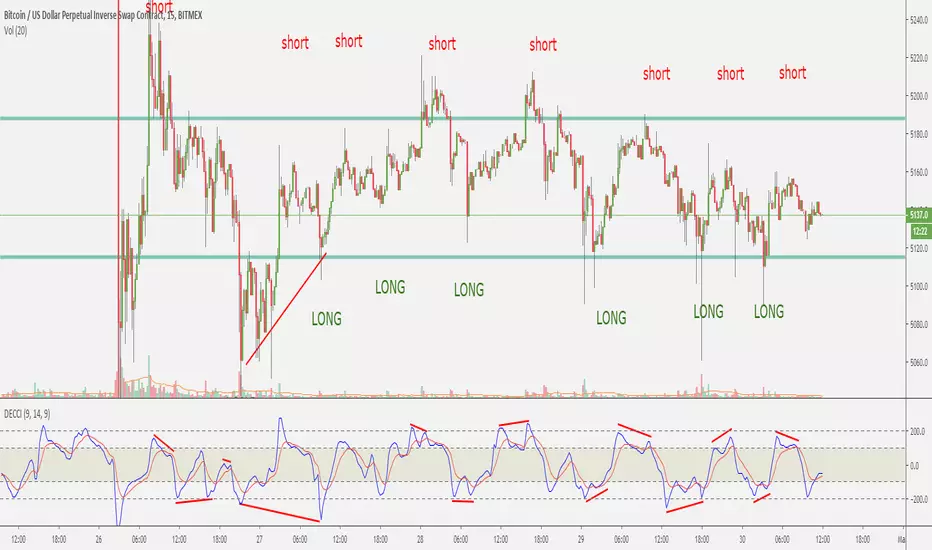
Supertrend & CCI Strategy ScalpThis strategy is based on 2 Super Trend Indicators along with CCI .
The longer factor length gives you the current trend and the deviation in the short factor length gives us the opportunity to enter in the trade .
CCI indicator is used to determine the overbought and oversold levels.
Setup :
Long : When atrLength1 > close and atrLength2 < close and CCI < -100 we look for long trades as the longer factor length will be bullish .
Short : When atrLength1 < close and atrLength2 > close and CCI > 100 we look for short trades as the longer factor length will be bearish .
Please tune the settings according to your use .
Trade what you see not what you feel .
Please consult with your financial advisor before you deploy any real money for trading .

GKD-E CCI [Loxx]The Giga Kaleidoscope GKD-E CCI is an exit module included in Loxx's "Giga Kaleidoscope Modularized Trading System."
█ GKD-E CCI
The Commodity Channel Index (CCI) is a technical analysis indicator developed by Donald Lambert in the 1980s. It is used to determine overbought and oversold conditions in a security or market. By comparing the current price to its average price over a specified period, the CCI helps traders identify potential price reversals and new trends. Typically, readings above +100 are considered overbought, while readings below -100 are seen as oversold, though these thresholds can be adjusted based on market conditions.
█ Giga Kaleidoscope Modularized Trading System
Core components of an NNFX algorithmic trading strategy
The NNFX algorithm is built on the principles of trend, momentum, and volatility. There are six core components in the NNFX trading algorithm:
1. Volatility - price volatility; e.g., Average True Range, True Range Double, Close-to-Close, etc.
2. Baseline - a moving average to identify price trend
3. Confirmation 1 - a technical indicator used to identify trends
4. Confirmation 2 - a technical indicator used to identify trends
5. Continuation - a technical indicator used to identify trends
6. Volatility/Volume - a technical indicator used to identify volatility/volume breakouts/breakdown
7. Exit - a technical indicator used to determine when a trend is exhausted
8. Metamorphosis - a technical indicator that produces a compound signal from the combination of other GKD indicators*
*(not part of the NNFX algorithm)
What is Volatility in the NNFX trading system?
In the NNFX (No Nonsense Forex) trading system, ATR (Average True Range) is typically used to measure the volatility of an asset. It is used as a part of the system to help determine the appropriate stop loss and take profit levels for a trade. ATR is calculated by taking the average of the true range values over a specified period.
True range is calculated as the maximum of the following values:
-Current high minus the current low
-Absolute value of the current high minus the previous close
-Absolute value of the current low minus the previous close
ATR is a dynamic indicator that changes with changes in volatility. As volatility increases, the value of ATR increases, and as volatility decreases, the value of ATR decreases. By using ATR in NNFX system, traders can adjust their stop loss and take profit levels according to the volatility of the asset being traded. This helps to ensure that the trade is given enough room to move, while also minimizing potential losses.
Other types of volatility include True Range Double (TRD), Close-to-Close, and Garman-Klass
What is a Baseline indicator?
The baseline is essentially a moving average, and is used to determine the overall direction of the market.
The baseline in the NNFX system is used to filter out trades that are not in line with the long-term trend of the market. The baseline is plotted on the chart along with other indicators, such as the Moving Average (MA), the Relative Strength Index (RSI), and the Average True Range (ATR).
Trades are only taken when the price is in the same direction as the baseline. For example, if the baseline is sloping upwards, only long trades are taken, and if the baseline is sloping downwards, only short trades are taken. This approach helps to ensure that trades are in line with the overall trend of the market, and reduces the risk of entering trades that are likely to fail.
By using a baseline in the NNFX system, traders can have a clear reference point for determining the overall trend of the market, and can make more informed trading decisions. The baseline helps to filter out noise and false signals, and ensures that trades are taken in the direction of the long-term trend.
What is a Confirmation indicator?
Confirmation indicators are technical indicators that are used to confirm the signals generated by primary indicators. Primary indicators are the core indicators used in the NNFX system, such as the Average True Range (ATR), the Moving Average (MA), and the Relative Strength Index (RSI).
The purpose of the confirmation indicators is to reduce false signals and improve the accuracy of the trading system. They are designed to confirm the signals generated by the primary indicators by providing additional information about the strength and direction of the trend.
Some examples of confirmation indicators that may be used in the NNFX system include the Bollinger Bands, the MACD (Moving Average Convergence Divergence), and the MACD Oscillator. These indicators can provide information about the volatility, momentum, and trend strength of the market, and can be used to confirm the signals generated by the primary indicators.
In the NNFX system, confirmation indicators are used in combination with primary indicators and other filters to create a trading system that is robust and reliable. By using multiple indicators to confirm trading signals, the system aims to reduce the risk of false signals and improve the overall profitability of the trades.
What is a Continuation indicator?
In the NNFX (No Nonsense Forex) trading system, a continuation indicator is a technical indicator that is used to confirm a current trend and predict that the trend is likely to continue in the same direction. A continuation indicator is typically used in conjunction with other indicators in the system, such as a baseline indicator, to provide a comprehensive trading strategy.
What is a Volatility/Volume indicator?
Volume indicators, such as the On Balance Volume (OBV), the Chaikin Money Flow (CMF), or the Volume Price Trend (VPT), are used to measure the amount of buying and selling activity in a market. They are based on the trading volume of the market, and can provide information about the strength of the trend. In the NNFX system, volume indicators are used to confirm trading signals generated by the Moving Average and the Relative Strength Index. Volatility indicators include Average Direction Index, Waddah Attar, and Volatility Ratio. In the NNFX trading system, volatility is a proxy for volume and vice versa.
By using volume indicators as confirmation tools, the NNFX trading system aims to reduce the risk of false signals and improve the overall profitability of trades. These indicators can provide additional information about the market that is not captured by the primary indicators, and can help traders to make more informed trading decisions. In addition, volume indicators can be used to identify potential changes in market trends and to confirm the strength of price movements.
What is an Exit indicator?
The exit indicator is used in conjunction with other indicators in the system, such as the Moving Average (MA), the Relative Strength Index (RSI), and the Average True Range (ATR), to provide a comprehensive trading strategy.
The exit indicator in the NNFX system can be any technical indicator that is deemed effective at identifying optimal exit points. Examples of exit indicators that are commonly used include the Parabolic SAR, the Average Directional Index (ADX), and the Chandelier Exit.
The purpose of the exit indicator is to identify when a trend is likely to reverse or when the market conditions have changed, signaling the need to exit a trade. By using an exit indicator, traders can manage their risk and prevent significant losses.
In the NNFX system, the exit indicator is used in conjunction with a stop loss and a take profit order to maximize profits and minimize losses. The stop loss order is used to limit the amount of loss that can be incurred if the trade goes against the trader, while the take profit order is used to lock in profits when the trade is moving in the trader's favor.
Overall, the use of an exit indicator in the NNFX trading system is an important component of a comprehensive trading strategy. It allows traders to manage their risk effectively and improve the profitability of their trades by exiting at the right time.
What is an Metamorphosis indicator?
The concept of a metamorphosis indicator involves the integration of two or more GKD indicators to generate a compound signal. This is achieved by evaluating the accuracy of each indicator and selecting the signal from the indicator with the highest accuracy. As an illustration, let's consider a scenario where we calculate the accuracy of 10 indicators and choose the signal from the indicator that demonstrates the highest accuracy.
The resulting output from the metamorphosis indicator can then be utilized in a GKD-BT backtest by occupying a slot that aligns with the purpose of the metamorphosis indicator. The slot can be a GKD-B, GKD-C, or GKD-E slot, depending on the specific requirements and objectives of the indicator. This allows for seamless integration and utilization of the compound signal within the GKD-BT framework.
How does Loxx's GKD (Giga Kaleidoscope Modularized Trading System) implement the NNFX algorithm outlined above?
Loxx's GKD v2.0 system has five types of modules (indicators/strategies). These modules are:
1. GKD-BT - Backtesting module (Volatility, Number 1 in the NNFX algorithm)
2. GKD-B - Baseline module (Baseline and Volatility/Volume, Numbers 1 and 2 in the NNFX algorithm)
3. GKD-C - Confirmation 1/2 and Continuation module (Confirmation 1/2 and Continuation, Numbers 3, 4, and 5 in the NNFX algorithm)
4. GKD-V - Volatility/Volume module (Confirmation 1/2, Number 6 in the NNFX algorithm)
5. GKD-E - Exit module (Exit, Number 7 in the NNFX algorithm)
6. GKD-M - Metamorphosis module (Metamorphosis, Number 8 in the NNFX algorithm, but not part of the NNFX algorithm)
(additional module types will added in future releases)
Each module interacts with every module by passing data to A backtest module wherein the various components of the GKD system are combined to create a trading signal.
That is, the Baseline indicator passes its data to Volatility/Volume. The Volatility/Volume indicator passes its values to the Confirmation 1 indicator. The Confirmation 1 indicator passes its values to the Confirmation 2 indicator. The Confirmation 2 indicator passes its values to the Continuation indicator. The Continuation indicator passes its values to the Exit indicator, and finally, the Exit indicator passes its values to the Backtest strategy.
This chaining of indicators requires that each module conform to Loxx's GKD protocol, therefore allowing for the testing of every possible combination of technical indicators that make up the six components of the NNFX algorithm.
What does the application of the GKD trading system look like?
Example trading system:
Backtest: Multi-Ticker CC Backtest
Baseline: Hull Moving Average
Volatility/Volume: Hurst Exponent
Confirmation 1: Advance Trend Pressure as shown on the chart above
Confirmation 2: uf2018
Continuation: Coppock Curve
Exit: Rex Oscillator
Metamorphosis: Baseline Optimizer
Each GKD indicator is denoted with a module identifier of either: GKD-BT, GKD-B, GKD-C, GKD-V, GKD-M, or GKD-E. This allows traders to understand to which module each indicator belongs and where each indicator fits into the GKD system.
█ Giga Kaleidoscope Modularized Trading System Signals
Standard Entry
1. GKD-C Confirmation gives signal
2. Baseline agrees
3. Price inside Goldie Locks Zone Minimum
4. Price inside Goldie Locks Zone Maximum
5. Confirmation 2 agrees
6. Volatility/Volume agrees
1-Candle Standard Entry
1a. GKD-C Confirmation gives signal
2a. Baseline agrees
3a. Price inside Goldie Locks Zone Minimum
4a. Price inside Goldie Locks Zone Maximum
Next Candle
1b. Price retraced
2b. Baseline agrees
3b. Confirmation 1 agrees
4b. Confirmation 2 agrees
5b. Volatility/Volume agrees
Baseline Entry
1. GKD-B Baseline gives signal
2. Confirmation 1 agrees
3. Price inside Goldie Locks Zone Minimum
4. Price inside Goldie Locks Zone Maximum
5. Confirmation 2 agrees
6. Volatility/Volume agrees
7. Confirmation 1 signal was less than 'Maximum Allowable PSBC Bars Back' prior
1-Candle Baseline Entry
1a. GKD-B Baseline gives signal
2a. Confirmation 1 agrees
3a. Price inside Goldie Locks Zone Minimum
4a. Price inside Goldie Locks Zone Maximum
5a. Confirmation 1 signal was less than 'Maximum Allowable PSBC Bars Back' prior
Next Candle
1b. Price retraced
2b. Baseline agrees
3b. Confirmation 1 agrees
4b. Confirmation 2 agrees
5b. Volatility/Volume agrees
Volatility/Volume Entry
1. GKD-V Volatility/Volume gives signal
2. Confirmation 1 agrees
3. Price inside Goldie Locks Zone Minimum
4. Price inside Goldie Locks Zone Maximum
5. Confirmation 2 agrees
6. Baseline agrees
7. Confirmation 1 signal was less than 7 candles prior
1-Candle Volatility/Volume Entry
1a. GKD-V Volatility/Volume gives signal
2a. Confirmation 1 agrees
3a. Price inside Goldie Locks Zone Minimum
4a. Price inside Goldie Locks Zone Maximum
5a. Confirmation 1 signal was less than 'Maximum Allowable PSVVC Bars Back' prior
Next Candle
1b. Price retraced
2b. Volatility/Volume agrees
3b. Confirmation 1 agrees
4b. Confirmation 2 agrees
5b. Baseline agrees
Confirmation 2 Entry
1. GKD-C Confirmation 2 gives signal
2. Confirmation 1 agrees
3. Price inside Goldie Locks Zone Minimum
4. Price inside Goldie Locks Zone Maximum
5. Volatility/Volume agrees
6. Baseline agrees
7. Confirmation 1 signal was less than 7 candles prior
1-Candle Confirmation 2 Entry
1a. GKD-C Confirmation 2 gives signal
2a. Confirmation 1 agrees
3a. Price inside Goldie Locks Zone Minimum
4a. Price inside Goldie Locks Zone Maximum
5a. Confirmation 1 signal was less than 'Maximum Allowable PSC2C Bars Back' prior
Next Candle
1b. Price retraced
2b. Confirmation 2 agrees
3b. Confirmation 1 agrees
4b. Volatility/Volume agrees
5b. Baseline agrees
PullBack Entry
1a. GKD-B Baseline gives signal
2a. Confirmation 1 agrees
3a. Price is beyond 1.0x Volatility of Baseline
Next Candle
1b. Price inside Goldie Locks Zone Minimum
2b. Price inside Goldie Locks Zone Maximum
3b. Confirmation 1 agrees
4b. Confirmation 2 agrees
5b. Volatility/Volume agrees
Continuation Entry
1. Standard Entry, 1-Candle Standard Entry, Baseline Entry, 1-Candle Baseline Entry, Volatility/Volume Entry, 1-Candle Volatility/Volume Entry, Confirmation 2 Entry, 1-Candle Confirmation 2 Entry, or Pullback entry triggered previously
2. Baseline hasn't crossed since entry signal trigger
4. Confirmation 1 agrees
5. Baseline agrees
6. Confirmation 2 agrees

DB CCI Breakout MTFDB CCI Breakout MTF
What does the indicator do?
The indicator will display crypto breakout and fallouts based on 4 timeframe CCI values. By default the current chart timeframe is used and the user may chose 3 other timeframes in the settings. Additionally, the symbol may be configured in the indicator settings. Default is Coinbase:ETHUSD.
The indicator will monitor the CCI levels on 4 timeframes and will alert to any CCI activity over 100 or under -100 which would indicate a breakout or fallout is present.
A green diamond is displayed when a breakout is detected on one or more of the timeframes for the selected symbol.
How should this indicator be used?
The indicator is a secondary alert system for the presence of breakouts or fallout conditions as under those scenarios position exit or entry strategies may be different.
Does the indicator include any alerts?
Not in this version. But I could add some if desired.
Use at your own risk and do your own diligence.
Enjoy!

Rajiv Patel Strategy with ATR RSI CCI MACD EMA IchimokuRajiv Patel Strategy with alerts helps to identify entry and exit levels based on following Indicators.
1. ATR Trailing Stoploss
2. RSI
3. CCI
4. MACD
5. EMA
6. SMA
7. Ichimoku
This Strategy is fully customizable as per your trading style. Below are some examples of how once can use the Strategy.
Options Based on Each Indicator Individually.
1. ATR Trailing Stoploss – When price is above ATR Trailing Stoploss line its in buy zone and when below its in sell zone. The setting of ATR Trailing Stoploss are customizable like ATR Periods and ATR Multiplier. Suggest increasing ATR Multiplier with lower timeframe. Aggressive buyers can decrease ATR Period in higher timeframe as per trade plan.
2. RSI – RSI above EMA Length is buy zone and below is sell zone. Conservative buyers can increase the RSI & EMA Length period while aggressive and reduce. Higher the timeframe gives better results.
3. CCI – Similar to RSI the buy zone is when CCI crosses above EMA Length. Again CCI & EMA Length can be customised as per trade plan. Higher timeframe is advised.
4. MACD – MACD parameters default settings are based on trying to get early entry. One can change to 26, 13 and 9 in lower timeframe. When MACD crosses above Signal line its buy zone and when below its sell zone.
5. EMA – 5 EMA lines and 2 SMA lines can be plotted. The settings of both EMA lines and SMA lines can be adjusted based on timeframe and trade plan.
6. EMA – EMA line 1 and 2 can be used as buy when EMA1 crosses above EMA2 and sell when below. The length of EMA1 & 2 is adjustable. Suggest modifying based on timeframe and trade plan.
7. SMA – SMA1 can also be used as solo indicator. If price is below SMA1 then its no buy area and if above, then in buy area. SMA2 can be used to identify if trend is upward or downward based on user settings.
8. Ichimoku – It predicts price movements bit like moving averages. Offers a unique perspective of support and resistance levels.
Conversion Line (Tenkan Sen)
- Measures Short Term Trend
- Signals an area of minor support and resistance
Base Line (Kijun Sen)
- Measures Medium term trend
- Used as Trailing Stop Level
Lagging Span (Chikou Span)
- Used for confirmation of signals
- Can also serve as Support and Resistance Level
Kumo Cloud
- Formed of two lines: Senkou Span A (Green Line) and Senkou Span B (Red Line)
- Dynamic Support and Resistance
HOW TO READ ICHIMOKU INDICATOR
Conversion Line (Tenkan Sen)
- If Price is above the Conversion Line = Short term upward movement
- If Price is below the Conversion Line = Short term downward movement
- Increasing Conversion Line = Short term uptrend
- Decreasing Conversion Line = Short term downtrend
Base Line (Kijun Sen)
- If Price is above the baseline = Medium term uptrend
- If the Market price is below the baseline = Medium term downtrend
- Increasing Base Line = Medium term uptrend
- Decreasing Base Line = Medium term downtrend
Lagging Span
- The Evolution of the current price action in relation to previous price action
- If the Lagging span is above the current price = Bullish Bias
- If the Lagging span is below the current price = Bearish Bias
- Lagging span near the current price = Trading range
Kumo Cloud
- Dynamic Support and Resistance based upon price action.
- The longer the price stays below/above the Kumo cloud, stronger the trend
- When the cloud is wide, the expected support or resistance is strong
- When the cloud is thin, the expected support or resistance is weak
- Never trade when price is inside Kumo Cloud
HOW TO TRADE WITH ICHIMOKU CLOUD
1. Baseline and conversion Line crossover (Lagging Span as a Filter)
crossover (conversion line, baseline) = Buy
crossunder (conversion line, baseline) = Sell
FILTER
Crossover (conversion line, baseline) and lagging span is Bullish (i.e above the price) = Buy
Crossunder (conversion line, baseline) and lagging span is Bearish (i.e below the price) = Sell
2. Baseline - Conversion line crossover (Kumo cloud Filter)
Crossover (conversion line, baseline) above the Kumo Cloud = Strong Buy
Crossover (conversion line, baseline) below the Kumo cloud = Weak Buy
Crossunder (conversion line, baseline) below the Kumo Cloud = Strong Sell
Crossunder (conversion line, baseline) above the Kumo Cloud = Weak Sell
3. Kumo Cloud Breakout
When the price enters the Kumo Cloud, and breaks its Upper wall upward = Bullish Signal
When the price enters the Kumo Cloud, and breaks its Lower wall downward = Bearish Signal
4. Kumo Cloud Crossover
When Span A crosses the Span B from below to the upside and prices are positioned above the Kumo Cloud = Strong Buy Signal
When Span A crosses the Span B from upside to the bottom and the prices are positioned below the Kumo Cloud = Strong Sell
When Span A crosses Span B from bottom to the upside and prices are positioned below the Kumo Cloud = Weak Buy Signal
When Span A crosses Span B from the upside to the bottom and the prices are positioned above the Kumo Cloud = Weak Sell Signal
Options Based on Combining Multiple Indicators.
One can select and combine multiple conditions based on above understanding of individual indicator to create a strong Long Entry, Short Entry, Long Exit and Short Exit. This Strategy also provides Alert signal for all entry and exit based on the combinations of conditions selected.
Since this is a strategy one can use STRATEGY TESTER to understand how the strategy has performed over the selected time span. This however does not guarantee similar results in present or future trades.
Please enter commission or total charges charged by your broker in “Properties” Tab of the strategy. Modify all parameters of “Properties” Tab as needed. Note, this can affect the performance results of the strategy.
Need to be very careful in selecting conditions as it becomes very complex with many options available.
Note:
Triangles at the top and bottom indicates the zone. Can be turned on / off using condition “Show Conditions Visually”.
1. Red triangle at top pointing down with ‘S’ indicates in Long Exit zone.
2. Red triangle at top pointing down with ‘EnS’ indicates in Enter Short zone.
3. Green triangle at bottom pointing up with ‘B’ indicates in Long Entry zone.
4. Green triangle at bottom pointing up with ‘ExS’ indicates in Exit Short zone.
5. When the is no triangle either at top or bottom means there is no zone.
Send me your suggestions, will try to incorporate the same in next revision.

MTF CCI BarOVERVIEW
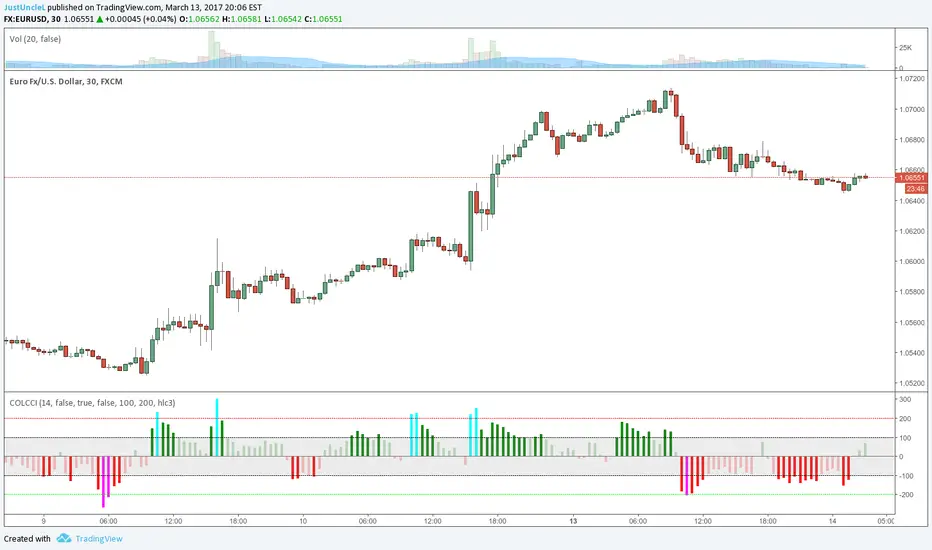
This indicator shows whether Commodity Channel Index (CCI) is above or below 0, represented by a bar. This indicator is compatible with MTF.
CONCEPTS
What do you want to know about market analysis?
Do you want a hard analysis? You can look for it.
All I want to know is whether the commonly known technical analysis is 'UP' or 'DOWN'.
All I want to know is whether the current market price is going up or down. Not only for the current, but also for the monthly, weekly, and daily status.
I want to make a decision in a moment. Without even thinking about it.
That is why I created a color-coded bar indicator to show the status.
No need to frown anymore.
DETAILS
CCI is a momentum oscillator used in technical analysis primarily to identify overbought and oversold levels by measuring an instrument's variations away from its statistical mean. For this indicator, I have removed the concept of overbought and oversold.
0 <= CCI green
0 > CCI red
However, with future upgrades, I would like to color-code it for overbought and oversold conditions as well.

Moon Phases Strategy with CCI EXTRIME TPHELLO TO ALL ASTROLGY TRADING LOVERS
***im not a native english speaker and im not going to google translte it so soory for mastakes ****
this is an amzing script of moon cycle strategy
for long -
price need to be above MA
it will buy in full moon and will sell at new moon
i added an extrime CCI TP that if cci is over bought above 200 line it will close position- it cant be edited out so enjoy it.
for short-
price need to be below MA
it will short when new moon and buy back when fullmoon
i added an extrime CCI tp that if cci is oversold under -200 line it will close position - it cant be edited out so enjoy it.
just edit the new moon Reference date by your UTC TIME!!! ׂ( GOOGLE 'NEW MOON DATE')
לכל אוהבי האסטרולוגיה ומסחר בכוכבים
סקריפט פשוט מעולה!
ללונג- האסטרטגיה קונה כאשר המחיר מעל הממוצע ויש ירח מלא-היא מוכרת כאשר יש ירח חדש או כאשרס.ס.י חוצה את קו ה200
בשורט היא עושה ההפך ומוכרת כאשר יש ירח חדש והמחיר מתחת לממוצע-היא סוגרת את הפוזציה כאשר יש ירח מלא או כאשר ס.ס.י חוצה מטה את רמת המינוס 200
אנא ערכו את התאריך רפרנס לירח לפי אזור הזמן שלכם חפשו בגוגל ''תאריך ירח חדש'.
BACKTEST RETURNS SOOOOOO GOOOOD !
הבאק טסטים חוזרים מושלמים
trade with the stars and rip markets

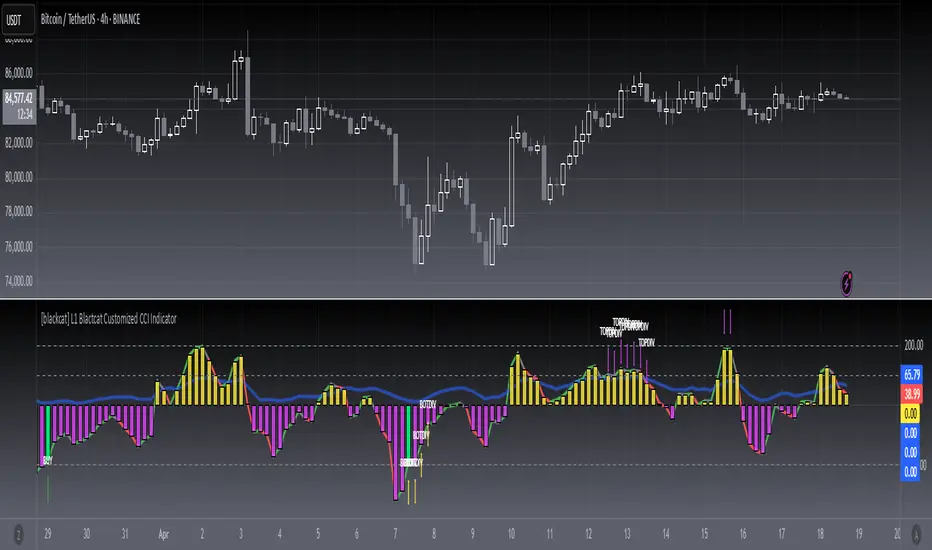
[blackcat] L1 Blackcat Customized CCI IndicatorLevel: 1
Background
This CCI indicator is blackcat customized version with enhanced features.
Function
This CCI use green line to indicate strong long trend with cci values > 0 and red line to indicate weak long trend with cci values <0. It also use yellow and fuchsia candles to present the strong and weak long trend. A green candle is used to indicate long entry, while a red candle is usded to indicate long flatten signal.
Key Signal
green line --> strong long trend
red line --> weak long trend
blue line --> trend strength indicator
SELL label --> flatten long or short entry
BUY label --> long entry
TOPDIV label --> top divergence indicator
BOTDIV label --> bottom divergence indicator
Remarks
Feedbacks are appreciated.
Readme
In real life, I am a prolific inventor. I have successfully applied for more than 60 international and regional patents in the past 12 years. But in the past two years or so, I have tried to transfer my creativity to the development of trading strategies. Tradingview is the ideal platform for me. I am selecting and contributing some of the hundreds of scripts to publish in Tradingview community. Welcome everyone to interact with me to discuss these interesting pine scripts.
The scripts posted are categorized into 5 levels according to my efforts or manhours put into these works.
Level 1 : interesting script snippets or distinctive improvement from classic indicators or strategy. Level 1 scripts can usually appear in more complex indicators as a function module or element.
Level 2 : composite indicator/strategy. By selecting or combining several independent or dependent functions or sub indicators in proper way, the composite script exhibits a resonance phenomenon which can filter out noise or fake trading signal to enhance trading confidence level.
Level 3 : comprehensive indicator/strategy. They are simple trading systems based on my strategies. They are commonly containing several or all of entry signal, close signal, stop loss, take profit, re-entry, risk management, and position sizing techniques. Even some interesting fundamental and mass psychological aspects are incorporated.
Level 4 : script snippets or functions that do not disclose source code. Interesting element that can reveal market laws and work as raw material for indicators and strategies. If you find Level 1~2 scripts are helpful, Level 4 is a private version that took me far more efforts to develop.
Level 5 : indicator/strategy that do not disclose source code. private version of Level 3 script with my accumulated script processing skills or a large number of custom functions. I had a private function library built in past two years. Level 5 scripts use many of them to achieve private trading strategy.
EMA20 MA50 MA200 + T3-CCIEMA20 MA50 MA200 + T3-CCI
This combination of triple Moving Average and CCI is a strategy to be used in conjunction with Harmonical Patterns and Fibonacci Rations .
Heikin Ashi price can be used as the price source for the Moving Averages and the T3-CCI, instead of the real price.
Two instances of the indicator can be spawned to have both the triple MAs and the T3-CCI on the chart (L-Click on the Indicator > Move To > New Pane Below).
Alerts are available to warn of possible opportunities in the markets .
A single alert that can fire on both conditions can be set. It can also be used by other indicators, such as the Risk Management Wrapper .
Additional Technical Analysis is required to confirm the signals before opening a position.
This indicator is an update to MA50 EMA20 MA200 .

DOUBLE EMA CCI
This script is based on Commodity Channel Index and double EMA - one based on price, the second one based on CCI with some modifications and calculation method to reduce and filter wrong signals.
The script was made based my own researches and trade experience on cryptocurrency market.
Recommended timeframe is 15 minutes. But you can use it on bigger timeframes as well.
For 15 minute tf recommended configuration is 9-14-9.
How to use:
There are +-100 and +-200 levels, blue line - CCI , red line - EMA on CCI indicator.
1. Long/short signals are generated when CCI and EMA lines go down/up +-100 level, reverse and cross up/down +-100 level.
2. You may see on the chart that before crossing +-100 level, the indicator makes specific double tops/bottoms and small divergences.
Use it in combination with other indicators to make your entry more accurate.
Also you can use it with my other script - TRSI .
Use it carefully.
Will be glad to see your feedback.
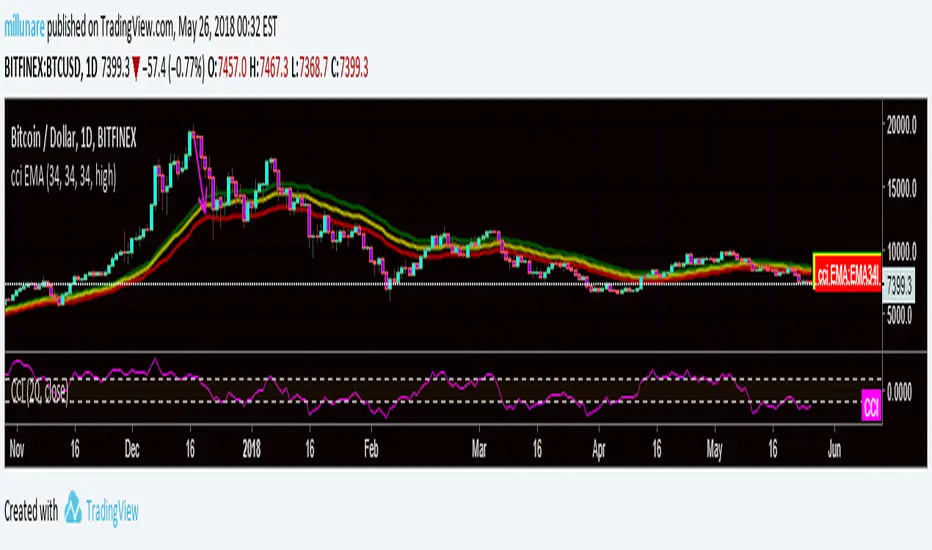
CMR CCI WAVEThe Funnel consists of 3 EMA's all set at the 34 EMA ( 1 on 34 Close, 1 on 34 Low and 1 on 34 High )
We couple this with a CCI of +100 / 0 / -100 ( The CCI is used as an RSI would be to determining crossings and overbought and oversold)
The Funnel should not be used as your primary entries, it is more of a verification process to show where the market is heading and where it has been. Best couple with the Elliott Wave of Swing Trading Fibs.
The Wave Funnel moves in clock angles ( remember to always think of a clock when working with the wave)
* 12-2 = A North Move
* 4-6 = A South Move
* A 9-3 = A Flat Move signaling Consolidation / Market Stall
* A 2-4 = When the wave is not steep enough to be a 12-2 or 4-6 and not flat enough to be a Consolidation of the 9-3.. We can verify this by looking at the CCI to confirm.
Wave confirms Direction, CCI confirms 2-4 ( We only range trade a 2-4 or Stay out of the Market if volume is non existent.
Add a MACD for a Flat 9-3 clock angle.
* Congestion/Consolidation is evident we look for other chart patterns to form in this angle. ( Triangles/ Rectangles/ Flags etc)
* Only use the MACD on Sideways markets
* If and when it breaks the Flat Angle we then look at the MACD for entry.
* If MACD is over 0 we BUY the Break
* If MACD is under the 0 we Sell
A 2-4 angle we trade the range of the emas, it will poke through the bottom and back out the top and repeat until we see a breakout to the north or south.
So if it is a 2-4 oclock angle we trade based off the macd's -100 we buy, 100 we sell. Repeat as the funnel continues the clock angle.
We trade with a Stop Loss on the other side of the Wave.
Do Not jump the gun on the trades. Wait for Pull Backs into the Wave
Pivots and Fibs will help determine the pullback ranges
The price always pullback to the Wave ( No different than any other ema, they act as magnets to price action)
ANy Questions hit up mill in CMR
CryptoVN - Commodity Channel Index (CCI) - BacktestHere is a backtest the CryptoVN - Commodity Channel Index (CCI) has published :
With condition for Buy/Sell:
Buy signals: the CCI for movement above +100
Sell signals:the CCI for movements below -100
- The Trend Is Your Friend. TRADE WHAT YOU SEE, NOT WHAT YOU THINK.

CM_Enhanced CCI V2Added 0 Line, + - 200 lines
Added a line that hi-lights the outside of the CCI
Updated 8/12/2014 by request for christian.david.75457
Added Ability To Plot 2nd CCI - !!!
Added ability to turn On/Off the +-200 lines.
Added Ability to Turn On/Off Show Area of CCI
Added Ability To Turn On/Off Show The Outer CCI Line

Combined: RSI Swing + Div + Sentiment + CCI — v6RSI Swing Structure (LL, LH, HH, HL)
✅ RSI Sentiment Direction (Up / Down)
✅ CCI Steroid Direction (Up / Down)
✅ Buy Signal when:
RSI Swing makes LL or HL, AND
RSI Sentiment trending UP, AND
CCI trending UP
✅ Sell Signal when:
RSI Swing makes HH or LH, AND
RSI Sentiment trending DOWN, AND
CCI trending DOWN
