CCI Highlighted [ankit4349]>> This script is purely based on Commodity Channel Index (CCI) with multiple CCI instances being used within one oscillator.
>> User can use as much as 5 CCI instances/plot within one oscillator.
> How to use :
1. When Bullish :
Whenever CCI length 14 crosses above -100(negative 100) that means bullish momentum is supported.
Best bullish/long entry would be when CCI length 14 crosses above -100(negative 100) as mentioned above and at the same time CCI length
200 is bouncing on top of +100(positive 100).
2. When Bearish :
Whenever CCI length 14 crosses below +100(positive 100) that means bearish momentum is supported .
Best bearish/short entry would be when CCI length 14 crosses below +100(positive 100) as mentioned above and at the same time CCI length
200 is bouncing at bottom of -100(negative 100) .
> Color Clarity :
a. Bullish support is highlighted GREEN and bearish support is highlighted RED within the oscillator background with respect to
Length 1 (i.e 14 by default) .
b. PURPLE is highhighted when Length 5(i.e 200 by default) is bouncing either on top of +100(for bullish) or at bottom of -100(for bearish).
c. AQUA is highlighted when Length 3(i.e 50 by default) is bouncing on top or at bottom of 0 from either side respectively.
d. Best entry in both cases i.e bullish or bearish as mentioned above('How to use') is highlighted WHITE by default.
> Tip:
Just observe the color outputs on any timeframe in a chart as it works fractally on every timeframe , it will help you understand better with
clarity.
> You are always free to experiment with the CCI lengths, change highlighted color and hide/unhide the Lengths as per your requirements in
setting/format .
Cerca negli script per "CCI"

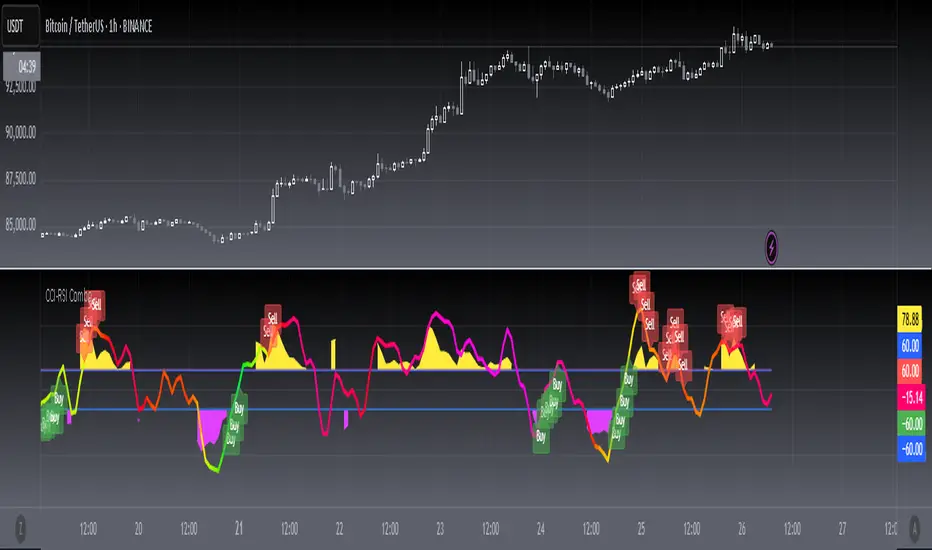
[blackcat] L3 CCI-RSI ComboCCI-RSI Combo indicator is a combination indicator that includes CCI and RSI. It uses some parameters to calculate the values of CCI and RSI, and generates corresponding charts based on these values. On the chart, when CCI exceeds 100 or falls below -100, yellow or magenta filling areas are displayed. Additionally, gradient colors are used on the RSI chart to represent different value ranges. Based on the values of CCI and RSI, buying or selling signals can be identified and "B" or "S" labels are displayed at the corresponding positions. It utilizes some technical indicators and logic to generate buying and selling signals, and displays the corresponding labels on the chart.
Here are the main parts of the code:
1. Definition of some variables:
- `N`, `M`, `N1`: Parameters used to calculate CCI and RSI.
- `xcn(cond, len)` and `xex(cond, len)`: Two functions used to calculate the number of times a condition is met.
2. Calculation of CCI (Commodity Channel Index):
- Calculate the CCI value based on the formula `(TYP - ta.sma(TYP, M)) / (0.015 * ta.stdev(TYP, M))`.
- Use the `plot()` function to plot CCI on the chart and set the color based on its value.
3. Calculation of RSI (Relative Strength Index):
- First calculate RSI1 by taking the average of positive differences between closing prices and the average of all absolute differences, and then multiplying by 100.
- Then use the ALMA function to transform RSI1 into a smoother curve.
- Use the `plot()` function to plot RSI on the chart and select gradient colors for shading based on its value.
4. Setting up the gradient color array:
- Create a color array using `array.new_color()` and add a series of color values to it.
5. Generating buying and selling signals based on conditions:
- Use logical operators and technical indicator functions to determine the conditions for buying and selling.
- Use the `label.new()` function to draw the corresponding labels on the chart to represent buying or selling signals.
CCI colored RSIKnowing how to write code will hopefully be my saving grace with trading. Regardless, I have things to learn yet and the CCI indicator seems to get a lot of respect from chart-art minimalists.
On Investopedia, it says, “The CCI compares the current price to an average price over a period of time. The indicator fluctuates above or below zero, moving into positive or negative territory. While most values, approximately 75%, fall between -100 and +100, about 25% of the values fall outside this range, indicating a lot of weakness or strength in the price movement”
So I decided to have the regular RSI colored with information from the CCI that I just learned about. RSI color changes depending on whether or not the CCI was extended beyond the –100 and 100 extremities, as this indicates trend strength, and helps to not exit a trade early. Arrows are drawn for when the CCI crosses the 0 point of the CCI, which if overlaid, is the 50 on the RSI.
I have also added the option of having the background shaded according to CCI signals. Crosses OVER the –100 and 100 are the early and late bullish signals, while crosses UNDER the –100 and 100 are early and late bearish. I added to the RSI according to how Investopedia says to trade the CCI here.
www.investopedia.com
I added lines to the RSI to delineate the zones that Constance Brown talks about in her work with the RSI.
I kept the code simple to demonstrate my process, editing out lines instead of deleting, etc. I hope it helps somebody new to programming in Pine Script be able to hop right in.
Happy Turkey Day! Gobble Gobble. Say “Gobble Gobble” out loud. Do it.
Edit: Gratuity options removed. Try not to support terrorism this holiday season. And ffs turn off that race-baiting fact-destroying humanity threatening trash on your tv. We fight terrorism all day up in this mf. Savin stupid hoes and everything. Because it's the right thing to do. Not because Soros said so and paid TradingView enough.
CCI [Hash Adaptive]Adaptive CCI Pro: Professional Technical Analysis Indicator
The Commodity Channel Index is a momentum oscillator developed by Donald Lambert in 1980. CCI measures the relationship between an asset's price and its statistical average, identifying cyclical turns and overbought/oversold conditions. The indicator oscillates around zero, with values above +100 indicating overbought conditions and values below -100 suggesting oversold conditions.
Standard CCI Formula: (Typical Price - Moving Average) / (0.015 × Mean Deviation)
This indicator transforms the traditional CCI into a sophisticated visual analysis tool through several key enhancements:
Implements dual exponential moving average smoothing to eliminate market noise
Preserves signal integrity while reducing false signals
Adaptive smoothing responds to market volatility conditions
Dynamic Color Visualization System
Continuous gradient transitions from red (bearish momentum) to green (bullish momentum)
Real-time color intensity reflects momentum strength
Eliminates discrete color jumps for fluid visual interpretation
Adaptive Intelligence Features
Dynamic overbought/oversold thresholds adapt to market conditions
Reduces false signals during high volatility periods
Maintains sensitivity during low volatility environments
Momentum Vector Analysis
Incorporates velocity calculations for early trend identification
Crossover detection with momentum confirmation
Advanced signal filtering reduces market noise
Extreme Level Analysis
Values above +100: Strong overbought conditions, potential reversal zones
Values below -100: Strong oversold conditions, potential buying opportunities
Zero-line crossovers: Momentum shift confirmation
Optimization Parameters
CCI Period (Default: 14)
Shorter periods (10-12): Increased sensitivity, more signals
Standard periods (14-20): Balanced responsiveness and reliability
Longer periods (21-30): Reduced noise, stronger signal confirmation
Smoothing Factor (Default: 5)
Lower values (1-3): Maximum responsiveness, suitable for scalping
Medium values (4-6): Balanced approach for swing trading
Higher values (7-10): Institutional-grade smoothness for position trading
Signal Sensitivity (Default: 6)
Conservative (7-10): High-probability signals, reduced frequency
Balanced (5-6): Optimal risk-reward ratio
Aggressive (1-4): Maximum signal generation, requires additional confirmation
Strategic Implementation
Oversold reversals in red zones with momentum confirmation
Zero-line breaks with sustained color transitions
Extreme readings followed by momentum divergence
Risk Management
Use extreme levels (+100/-100) for position sizing decisions
Monitor color intensity for momentum strength assessment
Combine with price action analysis for comprehensive market view
Market Context Application
Trending markets: Focus on momentum direction and extreme readings
Range-bound markets: Utilize overbought/oversold levels for mean reversion
Volatile markets: Increase smoothing parameters and signal sensitivity
Professional Advantages
Instantaneous momentum assessment through color visualization
Reduced cognitive load compared to traditional oscillators
Professional presentation suitable for client reporting
Adaptive Technology
Self-adjusting parameters reduce manual optimization requirements
Consistent performance across varying market conditions
Advanced mathematics eliminate common CCI limitations
The Adaptive CCI Pro represents the evolution of momentum analysis, combining Lambert's foundational CCI concept with modern computational techniques to deliver institutional-grade market intelligence through an intuitive visual interface.

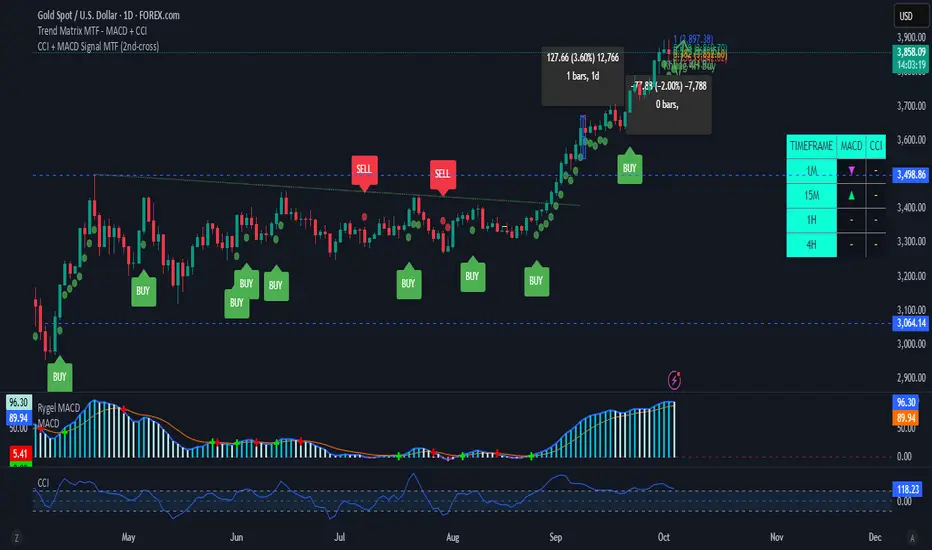
CCI + MACD Signal MTF (2nd-cross)This custom indicator combines the Commodity Channel Index (CCI) and the MACD to generate trading signals.
Basic signals (dots):
A green dot is plotted when CCI is above +100 and MACD is positive.
A red dot is plotted when CCI is below –100 and MACD is negative.
These dots help visualize momentum alignment between the two indicators.
Second-cross signals (text + alert):
The indicator also tracks cycles of the CCI.
When CCI first moves above +100 and later falls back below +100, this is counted as one completed cycle.
The next time CCI crosses back above +100 (the second cross), if MACD is still positive, a “BUY” label is plotted and a buy alert is triggered.
Conversely, when CCI first moves below –100 and later rises back above –100, that is one completed cycle.
The next time CCI crosses back below –100 (the second cross), if MACD is negative, a “SELL” label is plotted and a sell alert is triggered.
Alerts:
Alerts are only fired on the second-cross events (BUY or SELL), making them rarer but potentially more reliable than the basic dot conditions.
Timeframe flexibility:
Both the CCI and the MACD can be calculated on custom timeframes independently of the chart’s timeframe.
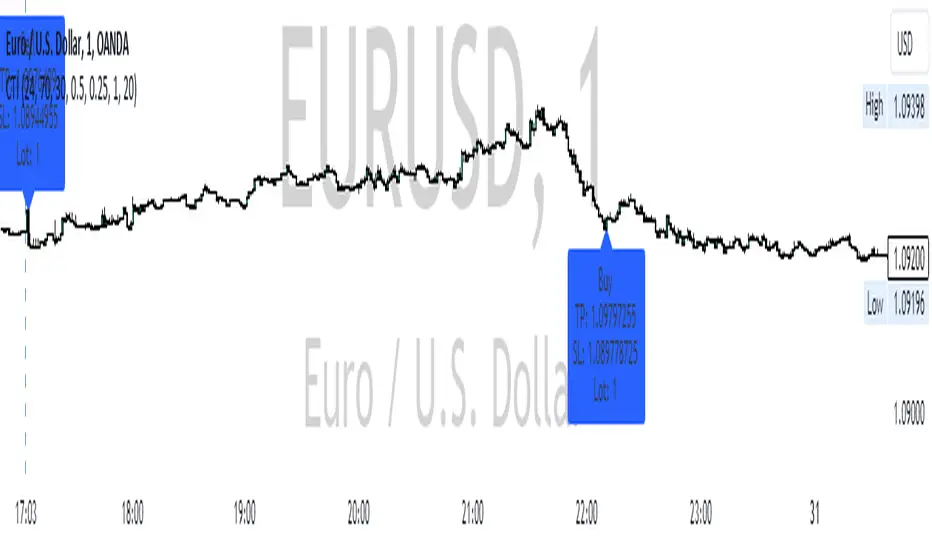
CCI RSI Trading SignalThe "CCI RSI Trading Signal" indicator combines the Commodity Channel Index (CCI) and Relative Strength Index (RSI) to provide buy and sell signals for trading. The CCI identifies potential trend reversals, while the RSI helps confirm overbought and oversold conditions.
How It Works:
The indicator generates a buy signal when the CCI crosses above -100 (indicating a potential bullish reversal) and the RSI is below the specified oversold level. On the other hand, a sell signal is produced when the CCI crosses below 100 (indicating a potential bearish reversal) and the RSI is above the specified overbought level.
Customization:
Traders can adjust the RSI and CCI periods, RSI oversold and overbought levels, as well as take profit, stop loss, and lot size settings to suit their trading preferences.
Usage:
The "CCI RSI Trading Signal" indicator can be used on various timeframes and markets to aid in decision-making, providing potential entry and exit points based on the combined analysis of CCI and RSI.
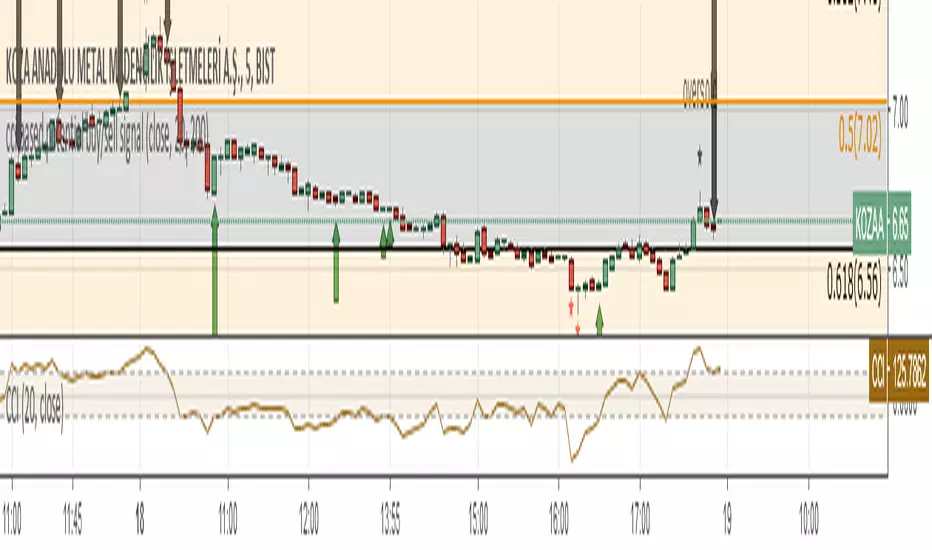
cci based potential buy/sell signal
Commodity Channel Index Potential Buy Signal
Commodity Channel Index (CCI) is below oversold line (-200).
CCI then crosses above -100 line
Commodity Channel Index Potential Sell Signal
Commodity Channel Index (CCI) is above overbought line (+200).
CCI then crosses below +100 line.
Türkçe Açıklama;
CCI Potansiyel Al Sinyali
CCI indikatörünün -200 altında bulunduğu bölgeler aşırı satış bölgeleri,
Sonrasında aşağıdan gelerek -100 çizgisinin üzerine çıktığı yada çıkmak üzere olduğu noktalar al sinyali
CCI Potansiyel Satl Sinyali
CCI indikatörünün +200 üzerinde bulunduğu bölgeler aşırı alım bölgeleri,
Sonrasında yukarıdan inerek +100 çizgisinin altına indiği yada inmek üzere olduğu noktalar sat sinyali
Not: Tek başına kullanılması son derece hatalı sonuçlar verebilir. Sadece olabilirlik potansiyeli taşımaktadır.
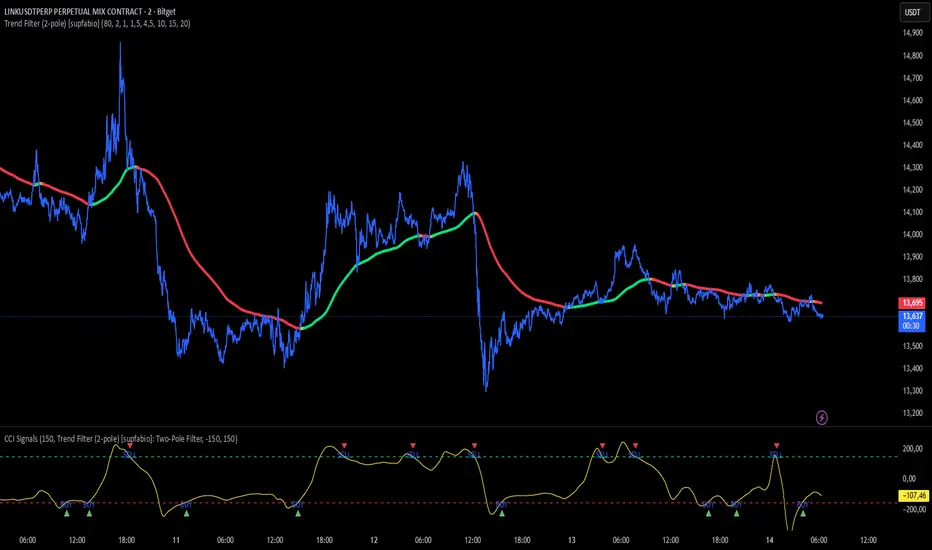
CCI + Buy/Sell Cross (supfabio)This indicator is an enhanced version of the Commodity Channel Index (CCI) designed to generate clear BUY and SELL signals based on customizable level crossovers, with built-in support for webhook automation and external trade execution.
🔹 Signal Logic
BUY Signal:
Triggered when the CCI crosses upward (from below to above) the user-defined BUY level (red line).
SELL Signal:
Triggered when the CCI crosses downward (from above to below) the user-defined SELL level (green line).
Signals can optionally be configured to trigger only on candle close, reducing real-time noise and false signals.
🔹 Key Features
✅ Original CCI calculation (standard formula preserved)
✅ Fully configurable BUY and SELL levels
✅ Optional display of signal level lines
✅ Visual BUY / SELL markers plotted on the CCI panel
✅ Support for moving average smoothing and Bollinger Bands applied to the CCI
✅ Dynamic alerts using alert(), ideal for:
Webhook integrations
Trading bots
External servers and automated execution systems
🔹 Alerts & Webhook Integration
The indicator sends dynamic alert messages containing:
Action type (BUY / SELL)
Symbol
Closing price
Timestamp
To use:
Add the indicator to your chart
Create an alert and select “Any alert() function call”
Enable Webhook URL and configure your endpoint
Done — signals will be sent automatically
🔹 Best Use Cases
Traders who use CCI as a primary entry trigger
Momentum or mean-reversion strategies
Automated trading systems
Visual backtesting and signal validation
⚠️ Disclaimer
This indicator is not a complete trading system and does not replace proper risk management. Always use it in combination with market context, confirmation tools, and sound position sizing.
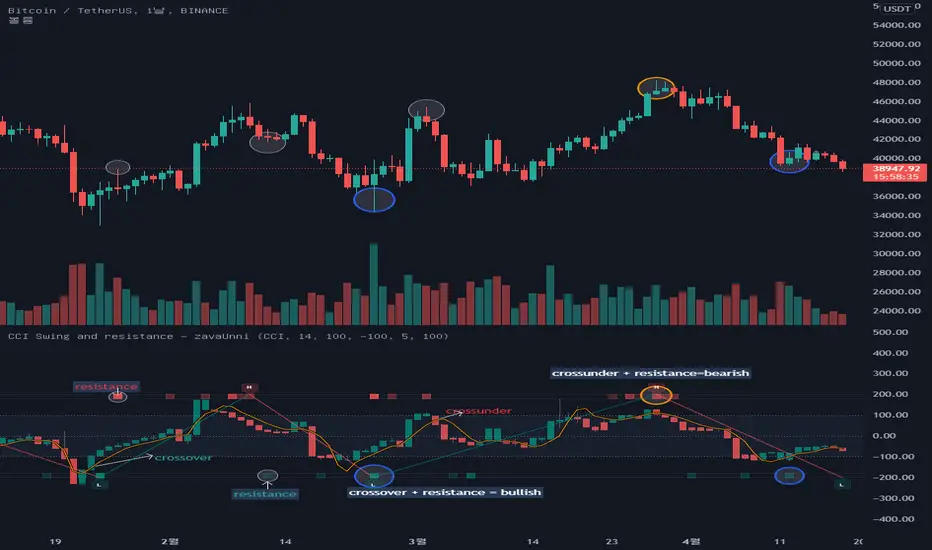
CCI Swing and resistance [zavaUnni] The candles you see on this indicator is the value open price, closing price, high, and low is converted to a selected index value.
Select from selectable settings: rsi , cci , mfi , or stochstic
The default indicator is set to cci .
O_ = ta. cci (open,i_length)
H_ = ta. cci (high,i_length)
L_ = ta. cci (low,i_length)
C_ = ta. cci (close,i_length)
Like the close, open, high, low price, the MA value is converted to the selected index and displayed as a yellow line
short_A = ta. sma (close, short_lenA)
short = ta. cci (short_A,i_length2)
The MA length can be converted from the set value and is defaulted to 5 days.
If C_ is above short, it looks like a teal color, and if C_ is below, it looks like a red color.
-High and low -
When the selected index reaches the oversold value, it finds a high value, and when it reaches the oversold value, it finds a low value.
Oversold and overbought values can be changed in the setting, and the default setting is 100 and -100.
The default setting is recommended unless otherwise noted.
The method of finding the low value is to find the lowest value (var) when the index crosses from 100 to reach -100, until it rises to 100.
The same is true of finding high values.
It was marked with a teal color when going from oversold to oversold, and red color when going down from oversold to oversold.
-os, ob and resistances-
The bar at the top and bottom of the index shows resistance, over-buying, and over-selling values
Over-buying and over-selling values are hidden, so you can change them to be seen if necessary.
1. The volume is large, but if the change rate of candlestic(spred_rate) is not large, resistance has occurred.
2. If thespred_rate is excessively large compared to the volume , oversold or oversold occurs.
Based on the above two basic theories, we created the following formula to derive the strength of the resistance.
Resistance Index = spred_rate / volume
We find the average value of the resistance Index,
If the spred_rate is higher than the predicted value, it is oversold or oversold.
If the spred_rate value is lower than the predicted value, the resistance was derived as the issuance signal.
The larger the deviation from the predicted value, the higher the saturation.
The presence of bright red can be seen as a result of greater resistance.
The same goes for over-buying and over-selling prices
The brighter the gray, the more spread without trading volume , and it can be judged that it is not a true bull or a true bear.
CCI Overbought & OversoldThe Commodity Channel Index (CCI) is a momentum-based oscillator used to help determine when an investment vehicle is reaching a condition of being overbought or oversold
Developed by Donald Lambert, this technical indicator assesses price trend direction and strength, allowing traders to determine if they want to enter or exit a trade, refrain from taking a trade, or add to an existing position. In this way, the indicator can be used to provide trade signals when it acts in a certain way.
KEY TAKEAWAYS
The Commodity Channel Index (CCI) is a technical indicator that measures the difference between the current price and the historical average price.
When the CCI is above zero, it indicates the price is above the historic average. Conversely, when the CCI is below zero, the price is below the historic average.
The CCI is an unbounded oscillator, meaning it can go higher or lower indefinitely. For this reason, overbought and oversold levels are typically determined for each individual asset by looking at historical extreme CCI levels where the price reversed from
This script calculates Commodity Channel Index (CCI) value and fills background of price action chart with colors:
Green zone indicates oversold zone where you can enter position
Red zone indicates overbought zone where a positions should be closed

CCI Stochastic and a quick lesson on Scalping & Trading SystemsHello traders
Still on holidays but I don't and will never forget you <3
I realize more and more that you guys don't only want some indicators and learn about pinescript. You also want some guidance and get some mentors providing you with comprehensive and simple trading methods and tricks.
I'm against those posting many scripts a day that in the end will make you lose your money because they don't give you the methodology to use them
It might look nice on the charts but we're not here to do some painting.... but to improve our lifestyle right :)
The today indicator is based on an indicator that I used for scalping : Fxcodebase CCI Stochastic
A CCI stochastic is very reactive and allows us to take many scalps trades per day with a few pips/USD gain for each trade. I don't recommend novice traders to use it and I strongly recommend everyone reading my disclaimer below basically saying "I'm not a financial advisor, don't be dumb, stay safe"
(I also recommend the few scripts copy-pasters to read my disclaimer as well)
What's a novice trader, sir? Well... thanks for asking. A novice trader is any trader with less than 5 years of live trading experience
From a pinescript perspective, this script will be however interesting for everyone :)
How to use it?
The indicator gives 3 possible entries for Longs and Shorts:
- Arrows at Enter - Will give signals whenever the Stoch CCI will enter in the BUY/SELL zone
- Arrows at Exit - Will give signals whenever the Stoch CCI will exit the BUY/SELL zone
- Arrows at Center - Signals whenever the Stoch CCI will cross the mid-line (50)
All arrows have different colors because ... painting is cool and nice.... kidding.... it gives clearer and more readable signals on the chart (but painting sir...)
A possible trading method could be to use the 3 modes at the same time to get the maximum of opportunities.
The safer bet is to use the "Arrows at Exit" only mode but for those who want to accumulate more scalping positions, adding the "Arrows at Enter" mode is an option as well. In other words, you accumulate a few scalping positions whenever the Stoch CCI get in the BUY/SELL zone and will stop accumulating whenever it will exit the BUY/SELL zone
You can add a few extra positions whenever the Stoch CCI will cross the mid-line as it often translates in a trend continuation
Life hack
Very important note : (probably the most important gem I shared until now) The inputs set by default will have to be changed for your asset/timeframe and can't be generic for everything. You have to play with the inputs until the signals will make sense to you
The indicator/strategy with a unique configuration that you'll never check or update according to the market condition DOES NOT exit.
If you find such a tool and prove me that you're making constant gains with it over a year, please patent it and then show it to me as I'd like to study it to replicate :) But most likely this is a myth/unicorn
Who I am to say this? Well, I worked in a Bank with real traders and I have a good sense of what works and what will certainly not work
My guru said scalping crypto in 1 second timeframe was the way to get rich quick. Do you agree sir?
But in trading, this is not because you take the maximum of trades possible that your gains will increase. This is the contrary.
There is a strong and proven inverse correlation between the number of trades taken and how fast you'll burn your capital. A swing trader taking 2/3 trades a month is more likely to beat 99% of the scalpers out there trying to predict all market movements. (and I'm not even talking about how dangerous it is to scalp with leverage)
You're starting to know me a bit more right now. I prefer to tell you what you need to hear vs what you want to hear because the second option doesn't allow to stay in the game very long.
I might lose some futures clients along the way by saying that but for my own conscience and ethics, I prefer to warn about the true risks of trading and to select who you listen very carefully (the advice also works for me, if you feel what I said doesn't make sense, this is totally your right but I hope this is because I'm french and not because of the content ^^).
See you tomorrow for another indicator or idea
Love you all
Dave
____________________________________________________________
Be sure to hit the thumbs up. Building those indicators take a lot of time and likes are always rewarding for me :) (tips are accepted too)
- If you want to suggest some indicators that I can develop and share with the community, please use my personal TRELLO board
- I'm an officially approved PineEditor/LUA/MT4 approved mentor on codementor. You can request a coaching with me if you want and I'll teach you how to build kick-ass indicators and strategies
Jump on a 1 to 1 coaching with me
- You can also hire for a custom dev of your indicator/strategy/bot/chrome extension/python
Disclaimer:
Trading involves a high level of financial risk, and may not be appropriate because you may experience losses greater than your deposit. Leverage can be against you.
Do not trade with capital that you can not afford to lose. You must be aware and have a complete understanding of all the risks associated with the market and trading. We can not be held responsible for any loss you incur.
Trading also involves risks of gambling addiction.
Please notice I do not provide financial advice - my indicators, strategies, educational ideas are intended to provide only some source code for anyone interested in improving their trading
The proprietary indicators and strategies developed by Best Trading Indicator, the object of intellectual property rights are and remain the exclusive property of Best Trading Indicator, at the exclusion of images and videos and texts free of rights or provided by the Company or external legal or physical person.
No assignment of intellectual property rights is carried out through these Terms and Conditions.
Any total or partial reproduction, modification or use of these properties for any reason whatsoever is strictly prohibited without the express written authorization of the Company.

CCI-MACD Strategy 4.2
I cerchi si basano sull'oscillatore CCI (Commodity Channel Index).
L’indicatore CCI ci permette di osservare se il livello attuale del prezzo è particolarmente al di sopra o al di sotto di una certa media mobile, avente un numero di periodi scelto da noi.
Più la deviazione dal prezzo medio nel breve termine è forte, e maggiormente l’indicatore si allontanerà dallo 0: verso l’alto in caso di uptrend, o verso il basso in caso di downtrend.
Il segnale viene dato quando il valore del CCI supera la linea dello zero.
Il tutto è filtrato con un altro indicatore, il MACD, acronimo di "Moving Average Convergence Divergence", usato per identificare cambiamenti nel momentum del prezzo.
The circles are based on the CCI (Commodity Channel Index) oscillator.
The CCI indicator allows us to observe whether the current price level is significantly above or below a certain moving average, with a number of periods chosen by us.
The greater the deviation from the short-term average price, the further the indicator will deviate from 0: upwards in the case of an uptrend, or downwards in the case of a downtrend.
The signal is given when the CCI value crosses the zero line.
This is all filtered through another indicator, the MACD, which stands for "Moving Average Convergence Divergence," used to identify changes in price momentum.

CCI, RSI, Volume & ATR Buy Signal - Go with the herd!📌 CCI, RSI, Volume & ATR Buy Signal Indicator
🚀 Identify Smart Entry Opportunities with a Multi-Confirmation Approach
This indicator combines CCI (Commodity Channel Index), RSI (Relative Strength Index), Volume, and ATR (Average True Range) to provide a reliable buy signal by ensuring the market conditions are favorable before entering a trade.
📊 How Does It Work?
This script evaluates market momentum, volatility, and trading volume to generate a clear entry decision:
✅ (Green Check) → Favorable entry conditions
❌ (Red Cross) → Not an ideal entry point
The indicator displays all the relevant metrics in one compact label, positioned above the most recent candle for quick and easy reference.
📈 Components of the Indicator
Each metric is visually represented using traffic light colors (🟢 Green, 🟡 Yellow, 🔴 Red) for intuitive decision-making:
1️⃣ CCI (Commodity Channel Index) – Momentum Strength
🟢 Strong: Market momentum is high (CCI above the entry threshold).
🟡 Moderate: Market is showing some movement, but not strong enough.
🔴 Weak: No significant momentum (CCI is low).
2️⃣ RSI (Relative Strength Index) – Trend Confirmation
If RSI is above the user-defined threshold, the momentum is considered positive for entry.
3️⃣ Volume – Market Participation
🟢 High: Trading volume is above the moving average, confirming strong participation.
🟡 Moderate: Volume is near its average, signaling indecisiveness.
🔴 Low: Weak participation, indicating potential false signals.
4️⃣ ATR (Average True Range) – Volatility Indicator
🟢 High: The market is moving with sufficient volatility for a strong trade setup.
🟡 Moderate: Acceptable volatility but with some caution.
🔴 Low: Market is slow, and price movements may be weak.
🔧 Customizable Settings
You can fine-tune the indicator to match your trading strategy by adjusting:
CCI Threshold for Entry (default: 100)
RSI Threshold for Entry (default: 50)
Volume Multiplier for Confirmation (default: 1.0)
ATR Multiplier for Confirmation (default: 1.0)
🖥️ How to Use
1️⃣ Add the indicator to your TradingView chart.
2️⃣ Look for the label above the most recent candle.
Example output:
✅ Vola: 🟢 Mom: 🟢 Volu: 🟢 → Strong confirmation for entry.
❌ Vola: 🟡 Mom: 🔴 Volu: 🟡 → Entry conditions are not favorable.
3️⃣ Only enter trades when ✅ appears and all or most indicators are green.
4️⃣ Avoid trading when ❌ is displayed or when multiple indicators are yellow/red.
⚡ Why Use This Indicator?
✅ Multi-Factor Confirmation – Ensures you enter only high-probability setups.
✅ Customizable for Any Strategy – Adjust thresholds based on your risk tolerance.
✅ Traffic Light System – Easily interpret trade conditions at a glance.
✅ Real-Time Updates – The label dynamically updates based on the latest price action.
📌 Final Notes
This indicator is not a standalone trading system but a powerful confirmation tool. Always use proper risk management and combine it with price action analysis for best results. 📊📈

CCI and MACD Auto Trading Strategy with Risk/RewardOverview:
This strategy combines the Commodity Channel Index (CCI) and the Moving Average Convergence Divergence (MACD) indicators to automate trading decisions. It dynamically sets stop-loss and take-profit levels based on recent lows and highs, ensuring a risk/reward ratio of 1:1.5. This script aims to leverage trend and momentum signals while maintaining effective risk management.
Originality and Usefulness:
This script is not just a simple mashup of CCI and MACD indicators; it incorporates dynamic risk management by setting stop-loss and take-profit levels based on recent price action. This approach helps traders to:
・Identify potential trend reversals using the combination of CCI and MACD signals.
・Manage trades effectively by setting realistic stop-loss and take-profit levels based on recent market data.
・Maintain a balanced risk/reward ratio, which is essential for sustainable trading.
Indicators Used:
・CCI (Commodity Channel Index):
・Measures the deviation of the price from its average over a specified period, typically ranging from -100 to +100.
・Helps identify overbought and oversold conditions.
・MACD (Moving Average Convergence Divergence):
・Utilizes the difference between short-term and long-term moving averages to indicate trend strength and direction.
・Provides momentum signals that can be used for timing entries and exits.
How It Works:
Entry Conditions:
Long Entry:
・The MACD histogram is above zero.
・The CCI crosses above the -100 line.
Short Entry:
・The MACD histogram is below zero.
・The CCI crosses below the +100 line.
Exit Conditions:
Long Positions:
・The stop-loss is set at the recent low.
・The take-profit is set at 1.5 times the distance between the entry price and the stop-loss.
Short Positions:
・The stop-loss is set at the recent high.
・The take-profit is set at 1.5 times the distance between the entry price and the stop-loss.
Risk Management:
・The script dynamically adjusts stop-loss and take-profit levels based on recent market data, ensuring that the risk/reward ratio is maintained at 1:1.5.
・This approach helps in managing the risk effectively while aiming for consistent profits.
Strategy Properties:
・Account Size: Configured for a realistic account size suitable for the average trader.
・Commission and Slippage: Includes settings for realistic commission and slippage to reflect real market conditions.
・Risk per Trade: Designed to risk no more than 5-10% of equity per trade, aligning with sustainable trading practices.
・Backtesting Results: Configured to generate a sufficient sample size (ideally more than 100 trades) for reliable backtesting results.
Revised Backtesting Settings
Ensure that your backtesting settings are realistic:
・Account Size: Set a realistic initial capital suitable for the average trader.
・Commission and Slippage: Include realistic commission fees and slippage.
・Risk Management: Ensure that each trade risks no more than 5-10% of the account equity.
・Sufficient Sample Size: Choose a dataset that will generate more than 100 trades to provide a robust sample size.

CCI OBV 4Kmod of lazy bear's OBV coded CCI , which indicates CCI state by changing the color of the OBV. now it shows you when CCI is overbought or oversold, not just one or the other
when CCI > 100, that's an oversold signal and OBV line turns green
when CCO -0.54% < -100, that's an undersold signal and OBV line turns red
CCI threshold can be changed (ex. 200 and -200)
EMA is overlaid, too, in orange, and that period can be changed

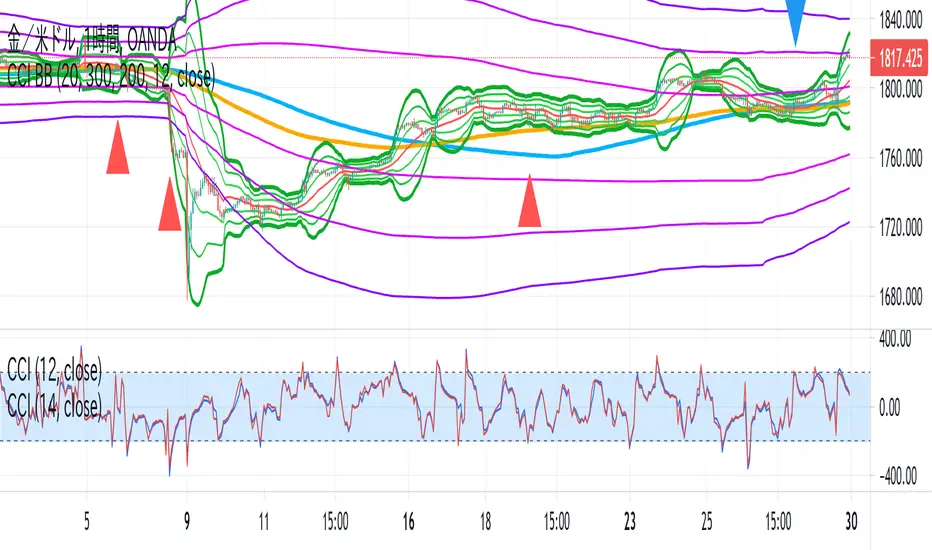
CCI BBThis indicator is the idea of giorno_4_16 .
It shows some indicator lines in your main chart as following:
SMA300, EMA200
BB 20 1,2,3sigma and middle
BB 300 1,2,3sigma and middle
You should put CCI (12, 14) into your separated chart to use the idea.
It shows arrows for registance trading when:
CCI(12) crossovers -200 or corssunders 200 in recent 6bars,
and the price crosses indicator line of SMA200, EMA200 and BB300 1,2,3sigma.
When CCI crossovers -200, you can condisider buying.
When CCI crossunders 200, you can condisider selling.
You should use this indicator in 1H or 4H.
When an arrow appears in 1H, change timeframe to 4H and check the slope of BB20.
If the slope is gentle, take-profit target is MA20 of 1H.
If the slope is steep(ex. CCI crossovers -200 and 4H BB20 go up steeply), take-profit target is BB20 2sigma of 1H.
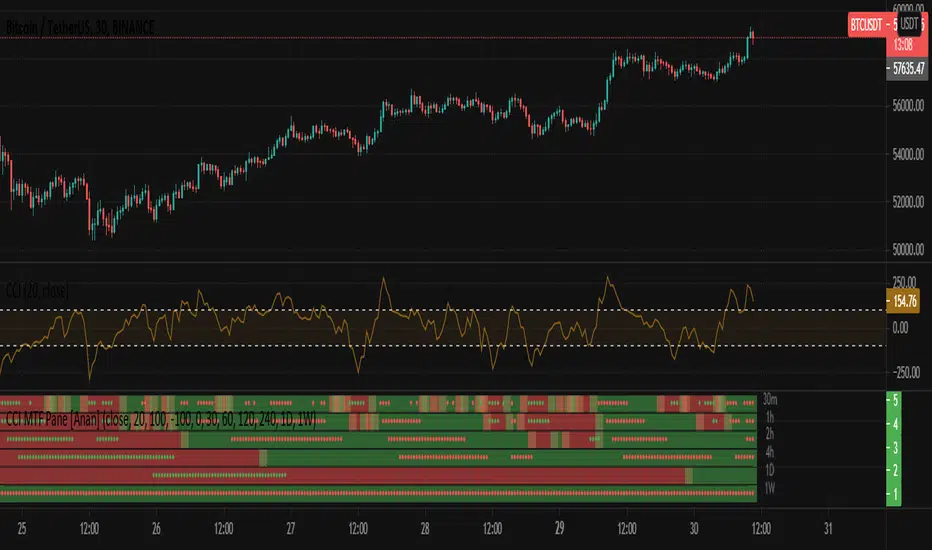
CCI MTF Pane [Anan]Hello friends,
This is CCI MTF Pane:
Green Line : CCI >= 0
RED Line : CCI < 0
Green Dot : CCI Oversold >= 100
Red Dot : CCI Overbought <= -100
You can modify these values from indicator settings.
CCI Strategy Reversed Backtest The Commodity Channel Index (CCI) is best used with markets that display cyclical or
seasonal characteristics, and is formulated to detect the beginning and ending of these
cycles by incorporating a moving average together with a divisor that reflects both possible
and actual trading ranges. The final index measures the deviation from normal, which indicates
major changes in market trend.
To put it simply, the Commodity Channel Index (CCI) value shows how the instrument is trading
relative to its mean (average) price. When the CCI value is high, it means that the prices are
high compared to the average price; when the CCI value is down, it means that the prices are low
compared to the average price. The CCI value usually does not fall outside the -300 to 300 range
and, in fact, is usually in the -100 to 100 range.
You can change long to short in the Input Settings
Please, use it only for learning or paper trading. Do not for real trading.

CCI strategy The Commodity Channel Index (CCI) is best used with markets that display cyclical or
seasonal characteristics, and is formulated to detect the beginning and ending of these
cycles by incorporating a moving average together with a divisor that reflects both possible
and actual trading ranges. The final index measures the deviation from normal, which indicates
major changes in market trend.
To put it simply, the Commodity Channel Index (CCI) value shows how the instrument is trading
relative to its mean (average) price. When the CCI value is high, it means that the prices are
high compared to the average price; when the CCI value is down, it means that the prices are low
compared to the average price. The CCI value usually does not fall outside the -300 to 300 range
and, in fact, is usually in the -100 to 100 range.

CCI/RSI + Smoothed Heiken Ashi Filter + SMA Exit (paired)Logic Summary (English Version)
Long Condition (Blue)
• CCI(34) > 0
• CCI(174) > 0
• RSI > 55
→ As long as all three conditions remain true, display blue continuously.
→ If any one of the conditions fails, the blue signal disappears.
⸻
Short Condition (Red)
• CCI(34) < 0
• CCI(174) < 0
• RSI < 45
→ As long as all three conditions remain true, display red continuously.
→ If any one of the conditions fails, the red signal disappears.

CCI Threshold HistogramSynopsis
The Custom CCI Indicator by Simon20cent enhances traditional CCI analysis with adjustable smoothing and a momentum-based histogram. The histogram highlights key thresholds, turning green above +100 and red below –100 to clearly identify strong bullish or bearish momentum. Both the CCI and smoothed CCI lines can be toggled for a cleaner view, making this tool effective for spotting momentum shifts, breakout conditions, and potential entry zones with improved clarity.

CCI ±100 Price Deviation with SMA & VWAP Trend ColorIndicator Synopsis: CCI ±100 Price Deviation with SMA & VWAP
Purpose:
This indicator combines trend filtering, momentum smoothing, and dynamic price bands to help identify intraday trading opportunities. It’s designed for:
15-minute chart → trend identification
1–2 minute chart → precise entries based on dynamic bands
Components:
SMA of Typical Price (smaTP)
Smooth average of the current bar’s typical price (hlc3).
Acts as a dynamic midpoint for the ±100 deviation bands.
±100 Deviation Bands
Calculated using a modified CCI formula:
Upper = SMA TP + 0.015 × MAD × 100
Lower = SMA TP - 0.015 × MAD × 100
Works as dynamic support/resistance and potential reversal zones.
SMA of CCI length (scaled to price)
Smooths the CCI momentum signal to the price scale.
Acts as a confirmation filter for trade direction near bands.
Optional toggle and customizable color/line width.
VWAP (Volume Weighted Average Price)
Optional overlay with trend-based coloring:
Price above VWAP → bullish → green
Price below VWAP → bearish → red
Acts as primary trend filter.
How to Use the Indicator
Step 1: Determine Trend (15-minute chart)
Check VWAP trend:
Price > VWAP → bullish trend → only consider long trades
Price < VWAP → bearish trend → only consider short trades
Confirm with SMA TP slope:
Rising SMA → bullish bias
Falling SMA → bearish bias
This ensures you only trade in the direction of the intraday trend.
