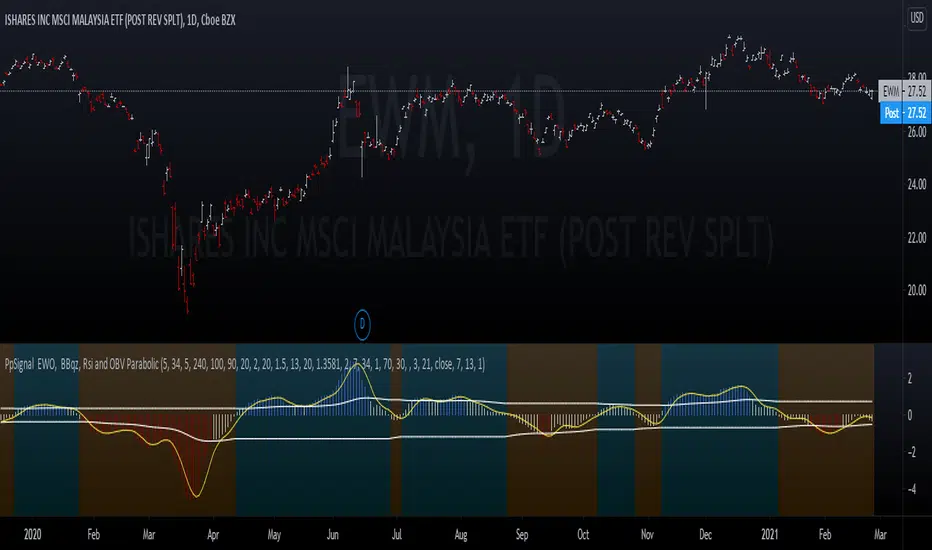
PpSignal EWO, macd, BBqz, Rsi, wodie cci & tigger trend V 2.0EWO break band, macd, bbsqeeze, trigger trend factory, rsi, and woodie cci all in one.
Buy when the price cross up ) line and sell when the price crosstown the )line...
Cerca negli script per "CCI"
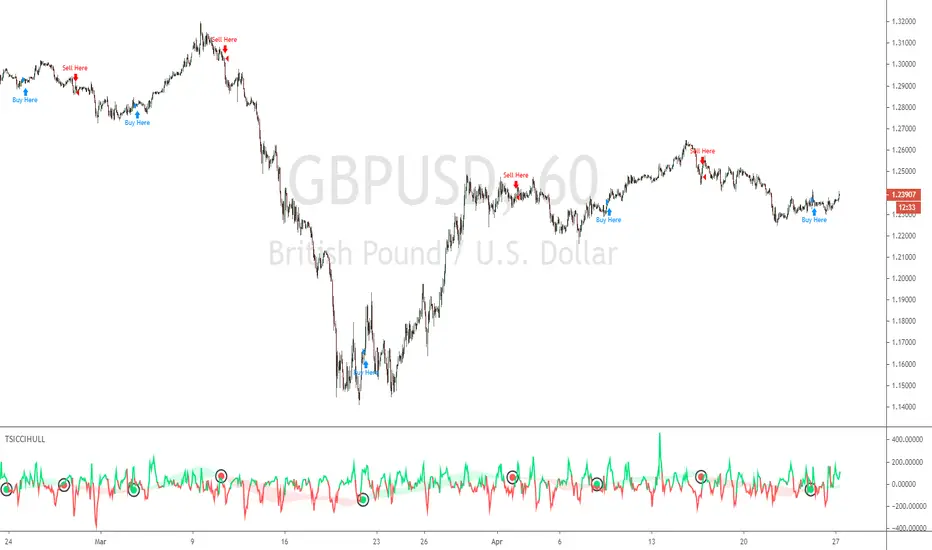
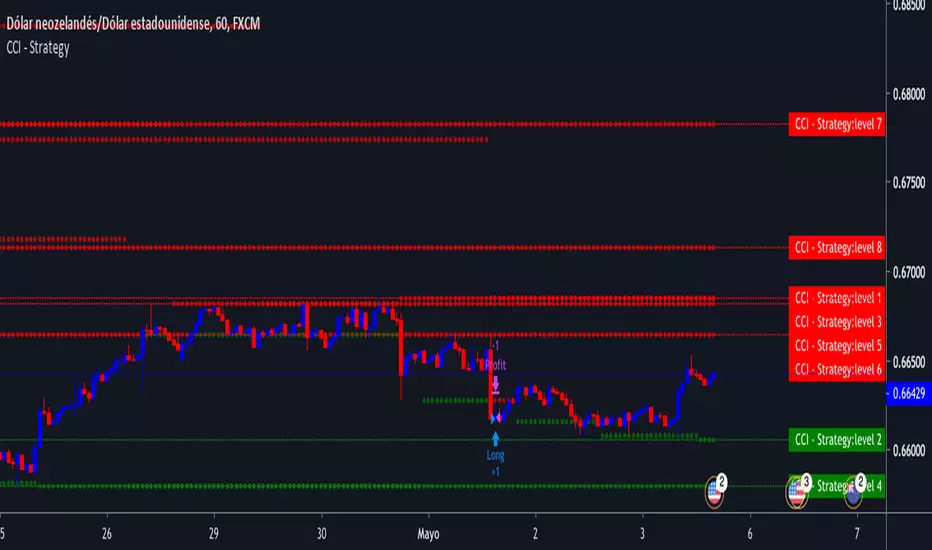
TSI CCI HullThis Strategy is Using TSI and CCI and Hull Moving Average to make swing trades on 1H chart but can be used on any pair and timeframe just change settings to suit (Hull Period mostly)
Divergence CCI [mado]Divergence screener for CCI
Regular Bullish: "D" navy label
Hidden Bullish: "H" navy label
Regular Bearish: "D" red label
Hidden Bearish: "H" red label

MA 12, MA 24, RSI OB-OS, CCI by WP@SITechDeveloped by Worachart Pirunruk, MD - Siam Intelligence Technology
This is the signal that generates based on 4 Technical Analysis Tools:
1. SMA 12,
2. SMA 26,
3. RSI 14,3,3
4. CCI
Signal to Buy/Long when the RSI below Dynamic oversold line based on close price back 60 bars.
Parameter. This signal doesn't have to best TP point, I'm working on improvement, now. Btw, don't forget to calculate you Margin Level. I'll teach you guys later of how to calculate.
Have fun Trading guys, and don't forget to give back to others. Because, Giving is Receiving."
WP@SITech

Indicator Panel MTF (MACD, RSI, Momentum, Stoch, CCI)This script shows the values of MACD, RSI, Momentum, Stoch, CCI for current and higher time frames in a panel. if higher time frame is equal or smaller than current time frame and it doesn't show the values for HTF.
And also it shows if their values are increasing, decreasing or equal to last value with "▲", "▼", "="
The signal length for all indicators is 9 and used EMA.
histogram value is indicator value - it's signal value. with this value you can see that indicator and its signal getting closer or not. you may think it's as momentum.
Some functions and idea is used from following scripts:
Thanks to Lucf for the following script:
Thanks to Ricardo Santos for the following script:


CL Multi CCI Trend Visualization v2 CleanFour CCI for trend visualization, cleaner version of previous one.


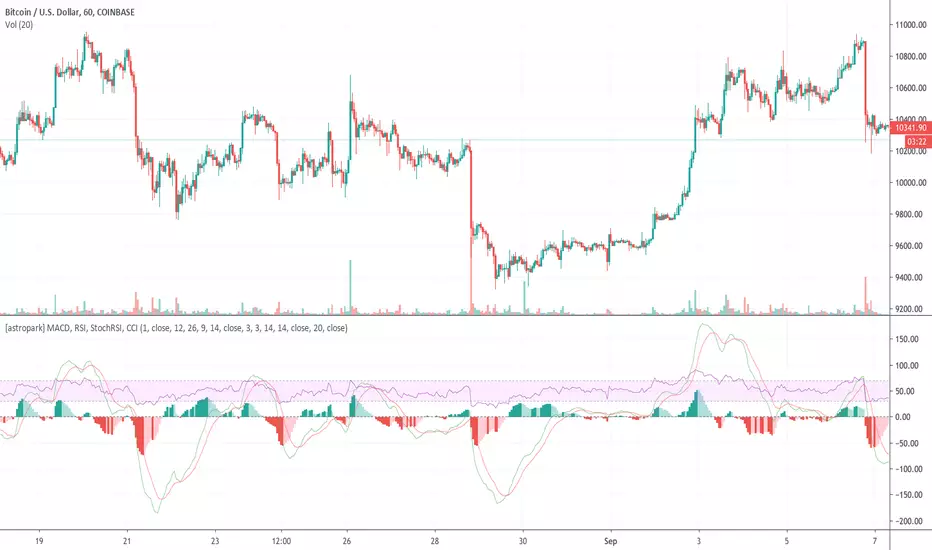
[astropark] MACD, RSI, StochRSI, CCIHi Followers,
here it is a new script, which unifies many very useful oscillator just in one: RSI + MACD + Stochastic RSI + CCI
This is not a public indicator, so send me a private message in order to get access to this script.
Do you like my scripts? Offer me a coffee , a beer, a pizza or whatever :)
BTC jar: 1K5kuYQPEqoNo6GRmJbHWMPmqwKM5S3oRR
ETH jar: 0x091b541a6dd6fe08c4e7bd909baafb2fce9b975e
LTC jar: LSVoAChsZrVsvbNyUfdpxtFpDAUSaUTUig
XRP jar: (XRP deposit tag) 103997763 (XRP deposit address) rEb8TK3gBgk5auZkwc6sHnwrGVJH8DuaLh
PS: Do you need a customization or do you need a dev who implements your strategy? send me a private message ;-)

Divergence RSI STOCH MACD CCI OBV CMF [PlungerMen]
Indicators seek divergence of prices
It graphs a few lines showing the divergence or convergence of the market
take signals from RSI, MACD, MACD Histogram, Stochastic, CCI, Momentum, OBV, Diosc, VWMACD and CMF
you can choose to take individual signal signals
** that's test versio n** have many not exactly =))
i will update soon when solving the algorithm


The four Kings MFI OBV CCI MACD [MesattoCapital]MFI OBV CCI MACD Combo Indicator by MesattoCapital
Version 2.0
Enjoy, check screenshot for more info!
BR/PT Version:


RSI-Stoch-CCI with S/RThe script works with RSI and Stoch to make sure the price is oversold or overbought, but also use CCI to identify the cyclical trends. If the price is on support or resistance and the indicators are oversold or overbought and alert there's an option to buy or sell.
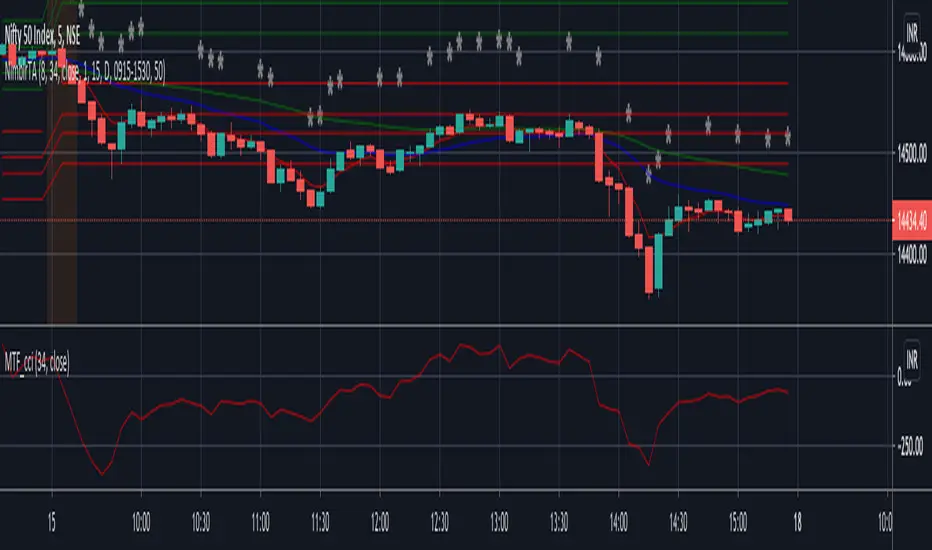
Multi Timeframe CCI(KK)Multi CCI Indicator as per NimblrTA Template
Courtesy KRISHNAKHANNA
For Educational Use

Multi Timeframe CCI by KKThis indicator plots the MTF CCI as per the NIMBLRTA Template
Indicator Courtesy:- KRISHNAKHANNA
Quad CCI4 CCI periods stacked as described by Mark Whistler in his book Volatility Illuminated.
Imagine that +100 and -100 are the upper and lower bands of a Bollinger Band and 0 is the mean. Price is the oscillating length for that relative period of BB. You can see when the price enters and exits the relevant bollinger band and act accordingly.
While default values are provided, the shortest period (default 14) should be adjust to reflect 1/10th of the currently longest overexpanded period of any given chart.