52SIGNAL RECIPE CME Gap Support & Resistance Detector═══ 52SIGNAL RECIPE CME Gap Support & Resistance Detector ═══
◆ Overview
The 52SIGNAL RECIPE CME Gap Support & Resistance Detector is an advanced technical indicator that automatically detects and visualizes all types of price gaps occurring in the CME Bitcoin futures market on trading charts. It captures not only gaps formed during weekend and holiday closures, but also those created during the daily 1-hour maintenance period on weekdays, and sudden price gaps resulting from economic indicator releases or news events.
The core value of this indicator lies beyond simply displaying gaps; it visualizes how these price discontinuities act as powerful support and resistance zones that influence future price movements. In real markets, these CME gaps have a high probability of either being "filled" or functioning as important reaction zones, providing traders with valuable entry and exit signals.
─────────────────────────────────────
◆ Key Features
• Comprehensive Gap Detection: Detects gaps in all market conditions
- Weekend/holiday closure gaps
- Weekday 1-hour maintenance period gaps
- Gaps from economic indicators/news events causing rapid price changes
• Intuitive Color Coding:
- Blue: When gaps act as support (price is above the gap)
- Red: When gaps act as resistance (price is below the gap)
- Gray: Filled gaps (price has completely passed through the gap area)
• Real-time Role Switching: Automatically changes colors as price moves above/below gaps, visualizing support↔resistance role transitions
• Status Tracking System: Automatically tracks whether gaps are "Filled" or "Unfilled"
• Dynamic Boxes: Clearly marks gap areas with boxes and dynamically changes colors based on price movement
• Precise Labeling: Accurately displays the price range of each gap to support trader decision-making
• Smart Filtering: Improved algorithm that solves consecutive gap detection issues for complete gap tracking
• Key Usage Points:
- Pay special attention when price approaches gap areas
- Color changes in gaps signal important market sentiment shifts
- Areas with multiple clustered gaps are particularly strong reaction zones
─────────────────────────────────────
◆ User Guide: Understanding Gap Roles Through Colors
■ Color System Interpretation
• Blue Gaps (Support Role):
▶ Meaning: Current price is above the gap, making the gap act as support
▶ Trading Application: Consider buying opportunities when price approaches blue gap areas
▶ Psychological Meaning: Buying pressure likely to increase at this price level
• Red Gaps (Resistance Role):
▶ Meaning: Current price is below the gap, making the gap act as resistance
▶ Trading Application: Consider selling opportunities when price approaches red gap areas
▶ Psychological Meaning: Selling pressure likely to increase at this price level
• Gray Gaps (Filled Gaps):
▶ Meaning: Price has completely passed through the gap area, filling the gap
▶ Reference Value: Still valuable as reference for past important reaction zones
▶ Trading Application: Used to confirm trend strength and identify key psychological levels
■ Understanding Color Transitions
• Blue → Red Transition:
▶ Meaning: Price has fallen below the gap, changing its role from support to resistance
▶ Market Interpretation: Breakdown of previous support strengthens bearish signals
▶ Trading Application: Consider potential further decline; check gap bottom as resistance during bounces
• Red → Blue Transition:
▶ Meaning: Price has risen above the gap, changing its role from resistance to support
▶ Market Interpretation: Breakout above previous resistance strengthens bullish signals
▶ Trading Application: Consider potential further rise; check gap top as support during pullbacks
─────────────────────────────────────
◆ Practical Application Guide
■ Basic Trading Scenarios
• Blue Gap Support Strategy:
▶ Entry Point: When price approaches the top of a blue gap and forms a bounce candle
▶ Stop Loss: Below the gap bottom (if price completely breaks down through the gap)
▶ Take Profit: Previous swing high or next resistance level above
▶ Probability Enhancers: Gap aligned with major moving averages, oversold RSI, strong bounce candle pattern
• Red Gap Resistance Strategy:
▶ Entry Point: When price approaches the bottom of a red gap and forms a rejection candle
▶ Stop Loss: Above the gap top (if price completely breaks up through the gap)
▶ Take Profit: Previous swing low or next support level below
▶ Probability Enhancers: Gap aligned with major moving averages, overbought RSI, strong rejection candle pattern
■ Advanced Pattern Applications
• Multiple Gap Cluster Identification:
▶ Several gaps in close price proximity form extremely powerful support/resistance zones
▶ Same-color gap clusters: Very strong single-direction reaction zones
▶ Mixed-color gap clusters: High volatility zones with bidirectional reactions expected
• Gap Sequence Analysis:
▶ Consecutive same-direction gaps: Strong trend confirmation signal
▶ Increasing gap size pattern: Trend acceleration signal
▶ Decreasing gap size pattern: Trend weakening signal
• News/Indicator Release Gap Utilization:
▶ Gaps formed immediately after economic indicators: Measure market shock intensity
▶ Gap color change observation: Track market reinterpretation of news
▶ Gap filling speed analysis: Evaluate news impact duration
• Key Attention Points:
▶ Pay special attention to the chart whenever price approaches gap areas
▶ Gap color changes signal important market sentiment shifts
▶ Areas with multiple concentrated gaps are likely to show strong price reactions
─────────────────────────────────────
◆ Technical Foundation
■ CME Gap Formation Principles
• Key Gap Formation Scenarios:
▶ Weekend Closures (Friday close → Monday open): Most common CME gap formation point
▶ Holiday Closures: Gaps occurring due to CME closures on US holidays
▶ Weekday 1-hour Maintenance: Gaps during daily CME maintenance period (16:00-17:00 CT)
▶ Major Economic Indicator Releases: Gaps from rapid price changes during US employment reports, FOMC decisions, CPI releases, etc.
▶ Significant News Events: Gaps from regulatory announcements, geopolitical events, market shocks, etc.
• Psychological Importance of Gaps:
▶ Zones where price formation did not occur, representing imbalance between buying/selling forces
▶ Gap areas have no actual trading, resulting in accumulated potential orders
▶ Reflect institutional investor positions and liquidity distribution in the CME futures market
■ Support/Resistance Mechanism
• Psychological Level Formation Mechanism:
▶ Unexecuted order accumulation in gap areas: Loss of ordering opportunity at those price levels
▶ Liquidity imbalance: No trading occurred in gap areas, creating liquidity voids
▶ Institutional activity: Institutional participants in CME futures markets pay attention to these gap areas
• Evidence of Support/Resistance Function:
▶ Statistical gap fill phenomenon: Most gaps eventually "fill" (price returns to gap area)
▶ Gap-based reactions: Increased frequency of price reactions (bounces/rejections) when reaching gap areas
▶ Market psychology impact: Influences traders' perceived value and fair price assessment
─────────────────────────────────────
◆ Advanced Configuration Options
■ Visualization Settings
• Show Gap Labels (Default: On)
▶ On: Displays price ranges of each gap numerically for precise support/resistance level identification
▶ Off: Hides labels for visual cleanliness
• Color Settings
▶ Filled Gap Color: Gray tones, shows gaps already traversed by price
▶ Unfilled Gap Color - Support: Blue, shows gaps currently acting as support
▶ Unfilled Gap Color - Resistance: Red, shows gaps currently acting as resistance
■ Data Management Settings
• Filled Gap Storage Limit (Default: 10)
▶ Sets maximum number of filled gaps to retain on chart
▶ Recommended settings: Short-term traders (5-8), Swing traders (8-12), Position traders (10-15)
• Maximum Gap Retention Period (Default: 12 months)
▶ Sets period after which old unfilled gaps are automatically removed
▶ Recommended settings: Short-term analysis (3-6 months), Medium-term analysis (6-12 months), Long-term analysis (12-24 months)
─────────────────────────────────────
◆ Synergy with Other Indicators
• Volume Profile: Greatly increased reaction probability when CME gaps align with Volume Profile value areas
• Fibonacci Retracements: Formation of powerful reaction zones when major Fibonacci levels coincide with gap areas
• Moving Averages: Areas where major moving averages overlap with CME gaps act as "composite support/resistance"
• Horizontal Support/Resistance: Very strong price reactions expected when historical key price levels align with CME gaps
• Market Sentiment Indicators (RSI/MACD): Assess reaction probability by checking oversold/overbought conditions when price approaches gap areas
─────────────────────────────────────
◆ Conclusion
The 52SIGNAL RECIPE CME Gap Support & Resistance Detector is not merely a gap display tool, but an advanced analytical tool that visualizes important support/resistance areas where price may strongly react, using intuitive color codes (blue=support, red=resistance). It detects all types of gaps without omission, whether from weekend and holiday closures, weekday 1-hour maintenance periods, important economic indicator releases, or market shock situations.
The core value of this indicator lies in clearly expressing through intuitive color coding that gaps are not simple price discontinuities, but psychological support/resistance areas that significantly influence future price action. Traders can instantly identify areas where blue gaps act as support and red gaps act as resistance, enabling quick and effective decision-making.
By referencing the color codes when price approaches gap areas to predict possible price reactions, and especially interpreting color transition moments (blue→red or red→blue) as signals of important market sentiment changes and integrating them into trading strategies, traders can capture higher-probability trading opportunities.
─────────────────────────────────────
※ Disclaimer: Like all trading tools, the CME Gap Detector should be used as a supplementary indicator and not relied upon alone for trading decisions. Past gap reaction patterns cannot guarantee the same behavior in the future. Always use appropriate risk management strategies.
═══ 52SIGNAL RECIPE CME Gap Support & Resistance Detector ═══
◆ 개요
52SIGNAL RECIPE CME Gap Support & Resistance Detector는 CME 비트코인 선물 시장에서 발생하는 모든 유형의 가격 갭(Gap)을 자동으로 감지하여 트레이딩 차트에 시각화하는 고급 기술적 지표입니다. 주말과 공휴일 휴장은 물론, 평일 1시간 휴장 시간, 그리고 중요 경제지표 발표나 뉴스 이벤트 시 발생하는 급격한 가격 갭까지 누락 없이 포착합니다.
이 인디케이터의 핵심 가치는 단순히 갭을 표시하는 것을 넘어, 이러한 가격 불연속성이 미래 가격 움직임에 영향을 미치는 강력한 지지(Support)와 저항(Resistance) 영역으로 작용한다는 원리를 시각화하는 데 있습니다. 실제 시장에서 이러한 CME 갭은 높은 확률로 미래에 "매꿔지거나" 중요한 반응 구간으로 기능하여 트레이더에게 귀중한 진입/퇴출 신호를 제공합니다.
─────────────────────────────────────
◆ 주요 특징
• 전방위 갭 감지: 모든 시장 조건에서 발생하는 갭을 감지
- 주말/공휴일 휴장 갭
- 평일 1시간 휴장 시간 갭
- 경제지표/뉴스 이벤트 시 급격한 가격 변동 갭
• 직관적 색상 구분:
- 파란색: 갭이 지지 역할을 할 때(가격이 갭 위에 있을 때)
- 빨간색: 갭이 저항 역할을 할 때(가격이 갭 아래에 있을 때)
- 회색: 이미 매꿔진 갭(가격이 갭 영역을 완전히 통과)
• 실시간 역할 전환: 가격이 갭 위/아래로 이동함에 따라 지지↔저항 역할 전환을 자동으로 색상 변경으로 시각화
• 상태 추적 시스템: 갭이 "매꿔짐(Filled)" 또는 "매꿔지지 않음(Unfilled)" 상태를 자동 추적
• 다이나믹 박스: 갭 영역을 명확한 박스로 표시하고 가격 움직임에 따라 동적으로 색상 변경
• 정밀 레이블링: 각 갭의 가격 범위를 정확히 표시하여 트레이더의 의사결정 지원
• 스마트 필터링: 연속적 갭 감지 문제를 해결하는 개선된 알고리즘으로 누락 없는 갭 추적
• 핵심 활용 포인트:
- 가격이 갭 영역에 접근할 때 특별히 주목하세요
- 갭 색상 변경 시점은 중요한 시장 심리 변화 신호입니다
- 여러 갭이 밀집된 영역은 특히 강한 반응이 예상되는 구간입니다
─────────────────────────────────────
◆ 사용 가이드: 색상으로 이해하는 갭 역할
■ 색상 시스템 해석법
• 파란색 갭 (지지 역할):
▶ 의미: 현재 가격이 갭 위에 있어 갭이 지지선으로 작용
▶ 트레이딩 응용: 가격이 파란색 갭 영역으로 하락 접근 시 매수 기회 고려
▶ 심리적 의미: 매수세력이 이 가격대에서 수요 증가 가능성
• 빨간색 갭 (저항 역할):
▶ 의미: 현재 가격이 갭 아래에 있어 갭이 저항선으로 작용
▶ 트레이딩 응용: 가격이 빨간색 갭 영역으로 상승 접근 시 매도 기회 고려
▶ 심리적 의미: 매도세력이 이 가격대에서 공급 증가 가능성
• 회색 갭 (매꿔진 갭):
▶ 의미: 가격이 갭 영역을 완전히 통과하여 갭이 매꿔진 상태
▶ 참조 가치: 과거 중요 반응 구간으로 여전히 참고 가치 있음
▶ 트레이딩 응용: 추세 강도 확인 및 주요 심리적 레벨 식별에 활용
■ 색상 전환 이해하기
• 파란색 → 빨간색 전환:
▶ 의미: 가격이 갭 아래로 하락하여 갭이 지지에서 저항으로 역할 변경
▶ 시장 해석: 이전 지지선 붕괴로 약세 신호 강화
▶ 트레이딩 응용: 추가 하락 가능성 고려, 반등 시 갭 하단 저항 확인
• 빨간색 → 파란색 전환:
▶ 의미: 가격이 갭 위로 상승하여 갭이 저항에서 지지로 역할 변경
▶ 시장 해석: 이전 저항선 돌파로 강세 신호 강화
▶ 트레이딩 응용: 추가 상승 가능성 고려, 조정 시 갭 상단 지지 확인
─────────────────────────────────────
◆ 실전 활용 가이드
■ 기본 트레이딩 시나리오
• 파란색 갭 지지 전략:
▶ 진입 시점: 가격이 파란색 갭 상단에 접근하여 반등 캔들 형성 시
▶ 손절 위치: 갭 하단 아래(갭 완전히 하향 돌파 시)
▶ 이익실현: 이전 스윙 고점 또는 상방 다음 저항선
▶ 확률 증가 조건: 갭과 주요 이동평균선 일치, 과매도 RSI, 강한 반등 캔들
• 빨간색 갭 저항 전략:
▶ 진입 시점: 가격이 빨간색 갭 하단에 접근하여 거부 캔들 형성 시
▶ 손절 위치: 갭 상단 위(갭 완전히 상향 돌파 시)
▶ 이익실현: 이전 스윙 저점 또는 하방 다음 지지선
▶ 확률 증가 조건: 갭과 주요 이동평균선 일치, 과매수 RSI, 강한 거부 캔들
■ 고급 패턴 활용법
• 다중 갭 클러스터 식별:
▶ 여러 갭이 근접한 가격대에 있다면 더욱 강력한 지지/저항 존
▶ 동일 색상 갭 클러스터: 매우 강력한 단일 방향 반응 구간
▶ 색상 혼합 갭 클러스터: 심한 변동성과 양방향 반응 예상 구간
• 갭 시퀀스 분석:
▶ 연속적인 동일 방향 갭: 강한 추세 확인 신호
▶ 갭 크기 증가 패턴: 추세 가속화 신호
▶ 갭 크기 감소 패턴: 추세 약화 신호
• 뉴스/지표 발표 후 갭 활용:
▶ 경제지표 발표 직후 형성된 갭: 시장 충격 강도 측정
▶ 갭 색상 변화 관찰: 시장의 뉴스 재해석 과정 파악
▶ 갭 매꿈 속도 분석: 뉴스 임팩트의 지속성 평가
• 핵심 주목 포인트:
▶ 가격이 갭 영역에 접근할 때마다 차트를 특별히 주목하세요
▶ 갭 색상이 변경되는 시점은 중요한 시장 심리 변화를 의미합니다
▶ 여러 갭이 밀집된 영역은 가격이 강하게 반응할 가능성이 높습니다
─────────────────────────────────────
◆ 기술적 기반
■ CME 갭의 발생 원리
• 주요 갭 발생 상황:
▶ 주말 휴장 (금요일 종가 → 월요일 시가): 가장 일반적인 CME 갭 형성 시점
▶ 공휴일 휴장: 미국 공휴일에 따른 CME 휴장 시 발생
▶ 평일 1시간 휴장: CME 시장의 일일 정비 시간(16:00~17:00 CT) 동안 발생
▶ 주요 경제지표 발표: 미 고용지표, FOMC 결정, CPI 등 발표 시 급격한 가격 변동으로 인한 갭
▶ 중요 뉴스 이벤트: 규제 발표, 지정학적 이벤트, 시장 충격 등으로 인한 급격한 가격 변화
• 갭의 심리적 중요성:
▶ 가격 형성이 이루어지지 않은 구간으로, 매수/매도 세력의 불균형 영역
▶ 갭 구간에는 실제 거래가 없었기 때문에 잠재적 주문이 누적되는 영역
▶ 기관 투자자들의 선물 포지션과 유동성 분포가 반영된 중요한 가격 레벨
■ 지지/저항으로 작용하는 원리
• 심리적 레벨 형성 메커니즘:
▶ 갭 구간의 미실행 주문 축적: 갭 발생 시 해당 가격대에 대한 주문 기회 상실
▶ 유동성 불균형: 갭 구간에는 거래가 없었으므로 유동성 공백 발생
▶ 기관 투자자 활동: CME 선물 시장의 기관 참여자들은 이러한 갭 영역에 관심
• 지지/저항 작용 증거:
▶ 통계적 갭 필 현상: 대부분의 갭은 미래에 "매꿔짐"(가격이 갭 구간으로 회귀)
▶ 갭 기반 반응: 갭 영역에 도달 시 가격 반응(반등/거부) 발생 빈도 증가
▶ 시장 심리 영향: 트레이더들의 인지된 가치와 공정가격 평가에 영향
─────────────────────────────────────
◆ 고급 설정 옵션
■ 시각화 설정
• 라벨 표시 설정 (Show Gap Labels) (기본값: 켜짐)
▶ 켜짐: 각 갭의 가격 범위를 숫자로 표시하여 정확한 지지/저항 레벨 확인
▶ 꺼짐: 시각적 깔끔함을 위해 라벨 숨김
• 색상 설정
▶ 매꿔진 갭 색상(Filled Gap Color): 회색 계열, 이미 가격이 통과한 갭 표시
▶ 미매꿔진 갭 색상 - 지지(Support): 파란색, 현재 지지 역할을 하는 갭
▶ 미매꿔진 갭 색상 - 저항(Resistance): 빨간색, 현재 저항 역할을 하는 갭
■ 데이터 관리 설정
• 매꿔진 갭 저장 한도 (Filled Gap Storage Limit) (기본값: 10)
▶ 이미 매꿔진 갭을 최대 몇 개까지 차트에 유지할지 설정
▶ 권장 설정: 단기 트레이더(5-8), 스윙 트레이더(8-12), 포지션 트레이더(10-15)
• 최대 갭 보관 기간 (Maximum Gap Retention Period) (기본값: 12개월)
▶ 오래된 미매꿔진 갭을 자동으로 제거하는 기간 설정
▶ 권장 설정: 단기 분석(3-6개월), 중기 분석(6-12개월), 장기 분석(12-24개월)
─────────────────────────────────────
◆ 다른 지표와의 시너지
• 볼륨 프로파일: CME 갭과 볼륨 프로파일의 밸류 영역 일치 시 반응 확률 크게 증가
• 피보나치 리트레이스먼트: 주요 피보나치 레벨과 갭 영역 일치 시 강력한 반응 존 형성
• 이동평균선: 주요 이동평균선과 CME 갭이 겹치는 영역은 "복합 지지/저항"으로 작용
• 수평 지지/저항: 과거 중요 가격대와 CME 갭 일치 시 매우 강력한 가격 반응 예상 가능
• 시장 심리 지표(RSI/MACD): 갭 영역 접근 시 과매수/과매도 확인으로 반응 가능성 판단
─────────────────────────────────────
◆ 결론
52SIGNAL RECIPE CME Gap Support & Resistance Detector는 단순한 갭 표시 도구가 아닌, 가격이 강하게 반응할 수 있는 중요한 지지/저항 영역을 직관적인 색상 코드(파란색=지지, 빨간색=저항)로 시각화하는 고급 분석 도구입니다. 주말과 공휴일 휴장 시간뿐만 아니라, 평일 1시간 휴장 시간, 중요 경제지표 발표, 그리고 시장 충격 상황에서 발생하는 모든 유형의 갭을 누락 없이 감지합니다.
인디케이터의 핵심 가치는 갭이 단순한 가격 불연속성이 아닌, 미래 가격 행동에 중요한 영향을 미치는 심리적 지지/저항 영역임을 직관적인 색상 코드로 명확히 표현하는 데 있습니다. 파란색 갭은 지지 역할을, 빨간색 갭은 저항 역할을 하는 영역을 즉각적으로 식별할 수 있어 트레이더가 빠르고 효과적인 의사결정을 내릴 수 있도록 도와줍니다.
갭 영역에 접근할 때마다 색상 코드를 참고하여 가능한 가격 반응을 예측하고, 특히 색상 전환이 일어나는 순간(파란색→빨간색 또는 빨간색→파란색)은 중요한 시장 심리 변화 신호로 해석하여 트레이딩 전략에 통합한다면, 더 높은 확률의 거래 기회를 포착할 수 있을 것입니다.
─────────────────────────────────────
※ 면책 조항: 모든 트레이딩 도구와 마찬가지로, CME Gap Detector는 보조 지표로 사용되어야 하며 단독으로 거래 결정을 내리는 데 사용해서는 안 됩니다. 과거의 갭 반응 패턴이 미래에도 동일하게 작용한다고 보장할 수 없습니다. 항상 적절한 리스크 관리 전략을 사용하세요.
Cerca negli script per "averages"

Volume MAs Oscillator | Lyro RSVolume MAs Oscillator | Lyro RS
Overview
The Volume MAs Oscillator is a powerful volume‑adjusted momentum tool that combines custom‑weighted moving averages on volume‑weighted price with smoothed deviation bands. It offers dynamic insights into trend direction, overbought/oversold conditions, and relative valuation — all within a single indicator
Key Features
Volume‑Adjusted Moving Averages: Moving averages can be volume‑weighted using the following formula: a moving average of (Price × Volume) divided by a moving average of Volume. This formula is applied across more than 14 different moving averages; however, it is not used with the VWMA, as VWMA is inherently a volume-weighted moving average.
Percentage Oscillator: Displays the normalized difference: (source – MA) / MA * 100, centered around zero for easy interpretation of strength and direction.
Deviation Bands: Builds upper and lower bands from standard deviation of the oscillator over a selected lookback, with distinct positive/negative multipliers and optional smoothing to reduce noise.
Inputs: Band Length, Band Smoothing, Positive Band Multiplier, Negative Band Multiplier.
Multi‑Mode Signal System:
1. Trend Mode – Colors oscillator according to breaks above (bullish) or below (bearish) respective bands.
2. Reversion Mode – Inverses color logic: signals overextensions beyond bands as reversion opportunities, greys inside the bands.
3. Valuation Mode – Applies a gradient color scale (UpC ⇄ DnC) to reflect relative valuation strength.
Customizable Visuals: Select from 5 pre‑set palettes—Classic, Mystic, Major Themes, Accented, Royal—or define your own custom bullish/bearish colors.
Chart enhancements include color‑coded oscillator line, deviation bands, glow‑effect midline at zero, background shading and candlestick/bar coloring aligned to signal mode.
Built‑In Signals: Automatically plots ▲ oversold and ▼ overbought markers upon crosses of lower/upper bands (in trend or reversion modes), enhancing signal clarity.
How It Works
MA Calculation – Applies the selected MA type to price × volume (normalized by MA of volume) or direct VWMA.
Oscillator Output – Calculates the % difference of source vs. derived MA.
Band Construction – Computes rolling standard deviation; applies user‑defined multipliers; smooths bands with exponential blending.
Mode-Dependent Coloring & Signals –
• Trend: Highlights strength trends via band cross coloring.
• Reversion: Flags extremes beyond bands as potential pullbacks.
• Valuation: Uses gradient to reflect oscillator’s position relative to recent range.
Signal Markers – Deploys arrows and color rules to flag overbought (▼) or oversold (▲) conditions when bands are breached.
Practical Use
Trend Confirmation – In Trend Mode, use upward price_diff cross above upper band as bullish; downward cross below lower band as bearish.
Mean Reversion – In Reversion Mode, fading extremes beyond bands may precede a retracement.
Relative Valuation – Valuation Mode shines when assessing how extended price_diff is, with gradient colors indicating valuation zones.
Bars/candles color‑coded to oscillator state boosts clarity of market tone and allows for rapid visual scanning.
Customization
Adjust MA type/length to tune responsiveness vs. smoothing.
Configure band settings for volatility sensitivity.
Toggle between signal modes for trend-following or reversion strategies.
Stylish visuals: pick or customize color schemes to match your chart setup.
⚠️Disclaimer
This indicator is a tool for technical analysis and does not provide guaranteed results. It should be used in conjunction with other analysis methods and proper risk management practices. The creators of this indicator are not responsible for any financial decisions made based on its signals.

Pineify Signals and OverlaysIndicator Theoretical Basis
Pineify Signals and Overlays is an invite-only trend-following and reversal-detection toolkit that fuses four well-known concepts— Dow-Theory trend phases , a multi-pair EMA cloud, QQE momentum, and ATR-based risk management—into a single, weight-balanced engine. An optional multi-time-frame (MTF) filter aligns lower-time-frame signals with higher-time-frame structure, helping traders avoid counter-trend setups. All components can be toggled from the settings panel, and a beginner “One-Click” preset loads a conservative profile out of the box.
Why it’s a single script: The algorithm scores every bar on three orthogonal axes—trend, momentum, and volatility—then issues context-aware arrows and coloured clouds only when the axes agree within user-defined tolerances. This inter-locking logic cannot be reproduced by simply stacking independent indicators on a chart, hence the need for an integrated implementation.
Trend Confirmation
Trend Confirmation: This indicator presents two types of market trends: the primary trend and the secondary trend. The primary trend is the long - term direction of the market and can last for days or months; the secondary trend is the adjustment phase within the primary trend.
This indicator uses the EMA (Exponential Moving Average) and visualizes the trend phases through color filling. The judgment of the trend is that blue plus green indicates a bullish trend, and yellow plus red indicates a bearish trend.
The primary trend of this indicator is visualized by two sets of moving averages through color filling. These two sets of moving averages are used to describe the short - term and long - term trends in the market.
The short - period moving averages and the long - period moving averages each consist of 4 moving averages, with a total of 8 moving averages, representing the short - term fluctuations and trends of the market.
Trend Persistence: Once the primary trend is formed, it will persist for a period of time. This indicator judges based on the Dow Theory. Short - term market fluctuations do not necessarily reflect changes in the primary trend. Therefore, the judgment direction of the primary trend is visualized through color.
The Signals of Buying, Selling and Closing
In the primary trend, we can see signals of trend reversal. This indicator incorporates the "Consecutive Candles". The indicator mainly identifies the overbought or oversold state of the market through a series of consecutive conditions, so as to predict the reversal point. The core of this indicator is to identify a series of consecutive price movements in the market trend and determine whether the market is about to reverse based on this sequence. We visualize the turning points through buy and sell signals.
The trend confirmation system utilizes four pairs of Exponential Moving Averages (EMAs) creating dynamic cloud formations that visualize market direction. Short-period EMAs (5, 8, 20, 34) interact with longer-period EMAs (9, 13, 21, 50) to generate color-coded trend clouds . Blue and green clouds indicate bullish conditions, while yellow and red clouds signal bearish trends, providing immediate visual trend identification.
The presentation of buying and selling points, namely "Quantitative Qualitative Estimation", is a technical indicator that combines the concepts of the Relative Strength Index (RSI) and moving averages. It is used to evaluate market trends, overbought and oversold conditions, as well as potential trend reversal points. The oscillator has a relatively long smoothing period, making the indicator relatively stable, thus enabling the visualization of buy + and sell + signals for trading.
ATR Stop - Loss Line
ATR (Average True Range) is an indicator for measuring market volatility. By using the ATR value to set the stop - loss distance, the stop - loss level can be automatically adjusted according to market volatility, making the stop - loss more flexible.
Core principle
Trend-Cloud Engine
EMA Pairs (5, 8, 20, 34 vs 9, 13, 21, 50)—Two four-EMA sets form “fast” and “slow” envelopes. When the volume-weighted mean of the fast set sits above the slow set and both slopes are positive, the bar is tagged primary bullish; the inverse tags primary bearish. Cloud colours (blue/green vs yellow/red) mirror Dow Theory’s primary/secondary trend hierarchy.
Momentum & Exhaustion Layer
QQE Oscillator (RSI 14, factor 4.238) detects momentum extremes and smooths noise more than a raw RSI, making it better suited for multi-time-frame use.
Consecutive-Candle Counter (default 8) highlights potential exhaustion after extended unidirectional moves; reversal symbols appear only if QQE divergence also exists.
Volatility-Adjusted Risk Line
ATR Trailing Stop (ATR 21, dynamic multiplier) expands in high volatility and tightens in low volatility, offering an adaptive exit reference rather than a fixed-tick stop.
Multi-Time-Frame Confirmation
The script automatically chooses a higher aggregation (e.g., 4 × the chart timeframe) and requires primary-trend agreement before issuing “Long ▲+” or “Short ▼+” confirmations. This guards against false signals during counter-trend rebounds.
Recommended parameters
RSI Length: 14 (QQE calculation base)
QQE Factor: 4.238 (Fibonacci-based multiplier)
ATR Period: 21 (volatility measurement)
EMA Lengths: Configurable short (5,8,20,34) and long (9,13,21,50) periods
Consecutive Candles: Selectable count (8)
Multi-timeframe Filter: Filter is enabled by default, resulting in more accurate signals.
Filters
The multi-timeframe filter enhances signal reliability by confirming trends across higher timeframes. This prevents counter-trend trades by ensuring alignment between current chart timeframe and broader market direction. The filter automatically calculates appropriate higher timeframes for trend confirmation.
Signals & Alerts
The indicator system exports multiple alert signals, and you can easily alert for any signal.
Up Trend : Primary long signal appears
Long - ▲ : Buy signal appears
Long - ▲+ : Confirmation buy signal appears
Long - ● : Primary reversal signal appears
Long - ☓ : Secondary reversal signal appears
Down Trend : Primary short signal appears
Short - ▼ : Sell signal appears
Short - ▼+ : Confirmation sell signal appears
Short - ● : Primary reversal signal appears
Short - ☓ : Secondary reversal signal appears
Originality & Value for Traders
Integrated scoring logic ensures signals fire only when trend, momentum, and volatility metrics corroborate, reducing “indicator conflict”.
Auto-computed MTF pairs mean no manual timeframe juggling.
Weight-balanced QQE/EMA blend creates smoother trend clouds than standard MA crosses, yet remains more responsive than Keltner or Donchian approaches.
One-click beginner profile plus full parameter access supports both novice and advanced users.
Risk Disclaimer
Use with Caution: This indicator is provided for educational and informational purposes only and should not be considered as financial advice. Users should exercise caution and perform their own analysis before making trading decisions based on the indicator's signals.
Not Financial Advice: The information provided by this indicator does not constitute financial advice, and the creator (Pineify) shall not be held responsible for any trading losses incurred as a result of using this indicator.
Backtesting Recommended: Traders are encouraged to backtest the indicator thoroughly on historical data before using it in live trading to assess its performance and suitability for their trading strategies.
Risk Management: Trading involves inherent risks, and users should implement proper risk management strategies, including but not limited to stop-loss orders and position sizing, to mitigate potential losses.
No Guarantees: The accuracy and reliability of the indicator's signals cannot be guaranteed, as they are based on historical price data and past performance may not be indicative of future results.

Heikinisi Candle (With MA + Smoothing + Buy/Sell with Cooldown)This custom Heikinisi Candle (With MA + Smoothing + Buy/Sell with Cooldown) indicator combines the advantages of Heikin-Ashi candles with the flexibility of multiple moving averages and smoothing options. The built-in buy/sell signals with cooldown functionality help traders avoid overtrading while capturing trend reversals and momentum shifts. Whether you're a day trader, swing trader, or long-term investor, this indicator offers powerful tools for analyzing price action and making informed trading decisions.
Note: Disable the regular candle to get better visualization.
Key Features:
Custom Heikin-Ashi Candles:
The core feature of this script is the Heikin-Ashi candles, which are known for smoothing price action and helping traders identify market trends more clearly.
Unlike traditional Heikin-Ashi, this version adjusts the Heikin-Ashi close based on specific price action patterns, including rejection signals and engulfing patterns.
The custom Heikin-Ashi open also incorporates momentum, adjusting dynamically based on recent price changes.
Price Action Measurements:
The indicator measures key price action components, including:
Body: The absolute difference between the open and close.
Candle Range: The total range from high to low.
Upper Wick: The distance from the highest price to the maximum of open or close.
Lower Wick: The distance from the lowest price to the minimum of open or close.
These measurements help detect bullish and bearish conditions, as well as price rejection signals.
Buy/Sell Signal Logic:
Buy Signal: Triggered when the Heikin-Ashi close is above the chosen moving average (MA1), with a cooldown period to avoid too frequent signals.
Sell Signal: Triggered when the Heikin-Ashi close falls below the MA1 after a buy signal has already been issued.
The cooldown period ensures that buy and sell signals are spaced apart by a specific number of bars, preventing excessive signal generation during periods of price consolidation.
Multiple Moving Averages (MA):
This script supports up to three customizable moving averages (MA1, MA2, MA3), each of which can be set to different types and lengths, including:
Simple Moving Average (SMA)
Exponential Moving Average (EMA)
Weighted Moving Average (WMA)
Volume Weighted Moving Average (VWMA)
Volume Weighted Moving Price (VWMP)
Least Squares Moving Average (LSMA)
Hull Moving Average (HMA)
Double Exponential Moving Average (DEMA)
Triple Exponential Moving Average (TEMA)
Users can adjust the length and type of each MA for tailored analysis.
Smoothing Options for MAs:
Users can smooth the output of MAs using various types of smoothing algorithms (SMA, EMA, LSMA, WMA, Gaussian) and a customizable length. This helps to reduce noise in the moving average lines and provides clearer signals.
Gaussian Filter (Advanced Smoothing):
A Gaussian Filter is available as a smoothing option for MAs. This filter reduces noise and makes the moving averages smoother, which can be particularly helpful in volatile or choppy markets.
Alerts and Visualization:
The script allows users to plot buy and sell signals on the chart with distinctive markers. A Buy Signal is shown below the bar with a lime green marker and text "Buy," while a Sell Signal is shown above the bar with a red marker and text "Sell."
Traders can also set up alerts based on the buy/sell signals to get notified in real time.
Indicator Configuration:
Heikin-Ashi Candle Configuration:
Automatically adjusts Heikin-Ashi candles based on rejection signals, engulfing patterns, and momentum. It uses custom formulas for the Heikin-Ashi open and close, making it more sensitive to price action than standard Heikin-Ashi candles.
Moving Averages (MA) Configuration:
You can select from multiple moving average types and lengths (MA1, MA2, MA3) for trend-following analysis.
Choose between SMA, EMA, WMA, VWMA, VWMP, LSMA, HMA, DEMA, and TEMA.
Smoothing Options:
Enable or disable smoothing for the moving averages.
Select from different smoothing types, including SMA, EMA, RMA, WMA, LSMA, and Gaussian.
Cooldown Period:
Control the number of bars that must pass before a new buy/sell signal is triggered. This cooldown period helps prevent excessive trading signals in quick succession.
How to Use:
Analyze Price Action with Heikin-Ashi Candles:
The custom Heikin-Ashi candles are ideal for spotting market trends, reversals, and price rejection. Use the candle patterns to gauge the market sentiment.
Use MAs for Trend Confirmation:
The moving averages (MA1, MA2, MA3) can help identify the prevailing trend. A price above a rising MA indicates an uptrend, while a price below a falling MA suggests a downtrend.
Trigger Buy and Sell Signals:
When the Heikin-Ashi close crosses above MA1, a buy signal is triggered.
When the Heikin-Ashi close crosses below MA1 after a buy signal, a sell signal is triggered.
The cooldown period ensures that signals are spaced out, preventing overtrading.
Use Smoothing for Clearer Signals:
If you are trading in a volatile market, you can use the smoothing options to make the MAs smoother and reduce noise.

Kaito Box with RSI Div(Dynamic Adjustment + MA + Long)The script implements a dynamic trading strategy that combines box range detection, RSI divergence signals, and moving average trend analysis. It is designed for use on OKX Signal Bots and includes features for dynamic position scaling and partial position closing. Below is a summary of its key functionalities:
Key Features:
Box Range Detection:
The script identifies price ranges using the highest high and lowest low of a configurable boxLength period.
These levels are plotted on the chart to visualize the price range.
RSI Divergence Detection:
The script calculates RSI using a configurable rsiLength.
Detects bullish divergence when price makes a lower low, but RSI makes a higher low.
Detects bearish divergence when price makes a higher high, but RSI makes a lower high.
Includes separate left and right lookback periods (leftLookback, rightLookback) for precise local extrema detection.
Customizable Moving Averages:
Supports multiple types of Moving Averages (SMA, EMA, SMMA, WMA, VWMA).
Calculates and plots MA20, MA50, MA100, and MA200 on a user-defined timeframe (custom_timeframe).
Identifies uptrends and downtrends based on the alignment of the moving averages and price levels.
Dynamic Position Scaling:
Implements dynamic position sizing for long entries and partial position closing for exits.
The percentage of position size added or closed is based on the difference between the current price and the average position price (avgPrice), with configurable minimum thresholds (minEnterPercent, minExitPercent).
Signal Integration for OKX Bots:
Sends buy/sell signals to OKX Signal Bots using the configured signalToken.
Supports market or limit orders with configurable price offsets and investment types.
Trend-Based Signal Filtering:
Only triggers long signals during downtrends and short signals during uptrends, ensuring trades align with the overall market context.
Visual Annotations:
Plots bullish and bearish divergence signals on the chart.
Displays labels showing dynamic position size adjustments and current average price during trades.
How It Works:
Long Signals:
Triggered when the price breaches the lower box range, and a bullish RSI divergence is detected.
Additional filtering ensures long trades are executed only during downtrend conditions.
Dynamically adjusts the position size based on the price difference from the average entry price.
Short Signals:
Triggered when the price breaches the upper box range, and a bearish RSI divergence is detected.
Additional filtering ensures short trades are executed only during uptrend conditions.
Dynamically closes portions of the position based on price movement relative to the average entry price.
Alerts:
Generates actionable alerts formatted for OKX bots, including order type, signal token, and dynamically calculated position sizes.
Use Case:
This strategy is well-suited for automated trading on platforms like OKX, where it can:
Exploit price ranges and RSI divergences for precise entries and exits.
Dynamically manage position sizes to optimize risk-reward.
Adapt to different market conditions using configurable parameters like moving averages, divergence lookbacks, and trend filters.
This script provides a robust foundation for traders looking to automate their strategies while maintaining flexibility and control over their trading logic.

SL - 4 EMAs, 2 SMAs & Crossover SignalsThis TradingView Pine Script code is built for day traders, especially those trading crypto on a 1‑hour chart. In simple words, the script does the following:
Calculates Moving Averages:
It computes four exponential moving averages (EMAs) and two simple moving averages (SMAs) based on the closing price (or any price you select). Each moving average uses a different time period that you can adjust.
Plots Them on Your Chart:
The EMAs and SMAs are drawn on your chart in different colors and line thicknesses. This helps you quickly see the short-term and long-term trends.
Generates Buy and Sell Signals:
Buy Signal: When the fastest EMA (for example, a 10-period EMA) crosses above a slightly slower EMA (like a 21-period EMA) and the four EMAs are in a bullish order (meaning the fastest is above the next ones), the script will show a "BUY" label on the chart.
Sell Signal: When the fastest EMA crosses below the second fastest EMA and the four EMAs are lined up in a bearish order (the fastest is below the others), it displays a "SELL" label.
In essence, the code is designed to help you spot potential entry and exit points based on the relationships between multiple moving averages, which work as trend indicators. This makes it easier to decide when to trade on your 1‑hour crypto chart.
Melody Markets Breaks
🎵 Melody Markets Breaks – The Ultimate Breakout & Trend Indicator 🎵
📌 Indicator Description
The Melody Markets Breaks indicator is an advanced tool designed to help traders identify price breakouts and key trend areas using a powerful combination of moving averages, Bollinger Bands, and advanced signal detection.
🔍 Key Features
✅ Breakout Detection → Identifies the first bullish and bearish breakouts, with optional filtering for better accuracy.
✅ Breakout Validation → Highlights confirmed breakouts to avoid false signals.
✅ Dynamic Moving Averages → Display various moving averages (MM7, MM20, MM50, MM100, MM200) with dynamic colors to spot trends easily.
✅ Trend Clouds (MM Clouds) → Clear visualization of trends using MM20-MM50 and MM100-MM200 cloud formations.
✅ Multiple Bollinger Bands → Three types of BB (Forex, Indices, Magic) to analyze market compression and expansion zones.
✅ Zero Gravity Bubbles → Identifies extreme price movements outside the Bollinger Bands.
✅ Automated Alerts → Instant notifications for breakouts, reintegrations, and trading signals so you never miss an opportunity.
✅ Full Customization → Enable or disable features to match your trading style.
📖 How to Use Melody Markets Breaks?
1️⃣ Set Up Moving Averages: Activate the MAs you want to display (MM7, MM20, MM50, etc.) and choose the calculation method (SMA, EMA, WMA, etc.).
2️⃣ Monitor Breakouts: Look for triangles on the chart indicating a price breakout. You can choose to display all breakouts or only filtered breakouts (those aligned with the trend).
3️⃣ Confirm Valid Breakouts: Validated breakouts are more reliable since they consider multiple candles to filter out false signals.
4️⃣ Analyze Bollinger Bands: Activate BBs to spot compression and expansion phases in the market.
5️⃣ Detect Zero Gravity Bubbles: If the price moves strongly outside the BBs, a yellow bubble appears, signaling an extreme move that might revert.
6️⃣ Receive Alerts: Activate alerts to get notified of breakouts and trading signals in real time.
7️⃣ Customize Your View: Disable unnecessary elements to keep your chart clean and easy to read.
🎯 Who Is This Indicator For?
🔹 Scalpers looking for quick entries after a breakout.
🔹 Day traders confirming intraday trends.
🔹 Swing traders identifying key levels for longer positions.
🔹 Beginners who want a clear and effective market reading tool.
🔥 Conclusion
Melody Markets Breaks is a powerful and comprehensive tool that allows you to analyze the market with clarity, detect high-probability breakouts, and optimize your trading decisions.
📌 Add it to your chart now and gain an edge in the market! 🚀

Displaced MAsDisplaced Moving Averages with Customizable Bands
Overview
The "Displaced Moving Averages with Customizable Bands" indicator is a powerful and versatile tool designed to provide a comprehensive view of price action in relation to various moving averages (MAs) and their volatility. It offers a high degree of customization, allowing traders to tailor the indicator to their specific needs and trading styles. The indicator features a primary moving average with multiple configurable percentage-based displacement bands. It also includes additional moving averages with standard deviation bands for a more in-depth analysis of different timeframes.
Key Features
Multiple Moving Average Types:
Choose from a wide range of popular moving average types for the primary MA calculation:
WMA (Weighted Moving Average)
EMA (Exponential Moving Average)
SMA (Simple Moving Average)
HMA (Hull Moving Average)
VWAP (Volume-Weighted Average Price)
Smoothed VWAP
Rolling VWAP
The flexibility to select the most appropriate MA type allows you to adapt the indicator to different market conditions and trading strategies.
Smoothed VWAP with Customizable Smoothing:
When "Smoothed VWAP" is selected, you can further refine it by choosing a smoothing type: SMA, EMA, WMA, or HMA.
Customize the smoothing period based on the chart's timeframe (1H, 4H, D, W) or use a default period. This feature offers fine-grained control over the responsiveness of the VWAP calculation.
Rolling VWAP with Adjustable Lookback:
The "Rolling VWAP" option calculates the VWAP over a user-defined lookback period.
Customize the lookback length for different timeframes (1H, 4H, D, W) or use a default period. This provides a dynamic VWAP calculation that adapts to the chosen timeframe.
Customizable Lookback Lengths:
Define the lookback period for the primary moving average calculation.
Tailor the lookback lengths for different timeframes (1H, 4H, D, W) or use a default value.
This allows you to adjust the sensitivity of the MA to recent price action based on the timeframe you are analyzing. Also has inputs for 5m, and 15m timeframes.
Percentage-Based Displacement Bands:
The core feature of this indicator is the ability to plot multiple displacement bands above and below the primary moving average.
These bands are calculated as a percentage offset from the MA, providing a clear visualization of price deviations.
Visibility Toggles: Independently show or hide each band (+/- 2%, 5%, 7%, 10%, 15%, 20%, 25%, 30%, 40%, 50%, 60%, 70%).
Customizable Colors: Assign unique colors to each band for easy visual identification.
Adjustable Multipliers: Fine-tune the percentage displacement for each band using individual multiplier inputs.
The bands are useful for identifying potential support and resistance levels, overbought/oversold conditions, and volatility expansions/contractions.
Labels for Displacement Bands:
The indicator displays labels next to each plotted band, clearly indicating the percentage displacement (e.g., "+7%", "-15%").
Customize the label text color for optimal visibility.
The labels can be horizontally offset by a user-defined number of bars.
Additional Moving Averages with Standard Deviation Bands:
The indicator includes three additional moving averages, each with upper and lower standard deviation bands. These are designed to provide insights into volatility on different timeframes.
Timeframe Selection: Choose the timeframes for these additional MAs (e.g., Weekly, 4-Hour, Daily).
Sigma (Standard Deviation Multiplier): Adjust the standard deviation multiplier for each MA.
MA Length: Set the lookback period for each additional MA.
Visibility Toggles: Show or hide the lower band of MA1, the middle/upper/lower bands of MA2, and the bands of MA3.
4h Bollinger Middle MA is unticked by default to provide a less cluttered chart
These additional MAs are particularly useful for multi-timeframe analysis and identifying potential trend reversals or volatility shifts.
How to Use
Add the indicator to your TradingView chart.
Customize the settings:
Select the desired Moving Average Type for the primary MA.
If using Smoothed VWAP, choose the Smoothing Type and adjust the Smoothing Period for different timeframes.
If using Rolling VWAP, adjust the Lookback Length for different timeframes.
Set the Lookback Length for the primary MA for different timeframes.
Toggle the visibility of the Displacement Bands and adjust their Colors and Multipliers.
Customize the Label Text Color and Offset.
Configure the Timeframes, Sigma, and MA Length for the additional moving averages.
Toggle the visibility of the additional MA bands.
Interpret the plotted lines and bands:
Primary MA: Represents the average price over the selected lookback period, calculated using the chosen MA type.
Displacement Bands: Indicate potential support and resistance levels, overbought/oversold conditions, and volatility ranges. Price trading outside these bands may signal significant deviations from the average.
Additional MAs with Standard Deviation Bands: Provide insights into volatility on different timeframes. Wider bands suggest higher volatility, while narrower bands indicate lower volatility.
Potential Trading Applications
Trend Identification: Use the primary MA to identify the overall trend direction.
Support and Resistance: The displacement bands can act as dynamic support and resistance levels.
Overbought/Oversold: Price reaching the outer displacement bands may suggest overbought or oversold conditions, potentially indicating a pullback or reversal.
Volatility Analysis: The standard deviation bands of the additional MAs can help assess volatility on different timeframes.
Multi-Timeframe Analysis: Combine the primary MA with the additional MAs to gain a broader perspective on price action across multiple timeframes.
Entry and Exit Signals: Use the interaction of price with the MA and bands to generate potential entry and exit signals. For example, a bounce off a lower band could be a buy signal, while a rejection from an upper band could be a sell signal.
Disclaimer
This indicator is for informational and educational purposes only and should not be considered financial advice. Trading involves risk, and past performance is not indicative of future results. Always conduct thorough research and consider your risk tolerance before making any trading decisions.
Enjoy using the "Displaced Moving Averages with Customizable Bands" indicator!

SASDv2rSensitive Altcoin Season Detector V2
This Pine Script™ code, titled "SASDv2r" (Sensitive Altcoin Season Detector version 2 revised), is designed for cryptocurrency trading analysis on the TradingView platform and tailored for those interested in tracking when altcoins might be outperforming Bitcoin, potentially indicating a market shift towards altcoins.
Feel free to use and modify. If you made it better, please let me know. Intention was to help the community with a tool for retail traders have no access to advanced, MV indicators. Solution uses classic TA only.
Use it witl TOTAL3/BTC indicator.
Please check: it gave signal just before last alt season % rose more than 250%.
Market Cap Data Fetching: The script fetches market capitalization data for Bitcoin, Ethereum, and all other altcoins (excluding Bitcoin and Ethereum) using request.security function.
Altcoin to Bitcoin Ratio: It calculates the ratio of total market cap of altcoins to Bitcoin's market cap (altToBtcRatio), which is central to identifying an "altcoin season."
Moving Averages: Several moving averages are computed for different time frames (50-day SMA, 200-day SMA, 20-day SMA, and 10-day EMA) to analyze trends in the altcoin to Bitcoin ratio.
Momentum Indicators: The script uses RSI (Relative Strength Index) and MACD (Moving Average Convergence Divergence) to gauge momentum and potential reversal points in the market.
Custom Indicators: It includes Volume Weighted Moving Average (VWMA) and a custom momentum indicator (altMomentum and altMomentumAvg) to provide additional insights into market movements.
Volatility Measurement: Bollinger Bands are calculated to assess volatility in the altcoin to Bitcoin ratio, which helps identify periods of high or low market activity.
Visual Analysis: Various plots are added to the chart for visual interpretation, including the altcoin to Bitcoin ratio, different moving averages, and Bollinger Bands.
Alt Season Detection: The script defines conditions for detecting when an "altcoin season" might be starting, based on crossovers of moving averages, RSI levels, MACD signals, and other custom criteria.
Performance Tracking: After signaling an alt season, the script evaluates the performance over the next 30 days by checking if there's been an increase in the altcoin to Bitcoin ratio, adding labels for positive or negative trends.(this one is in progress). Logic still gives false signals and aim is to identify failed signals.
Visual Signals: Labels are placed on the chart to visually indicate the beginning of a potential alt season or the performance outcome after a signal, aiding traders in making informed decisions.

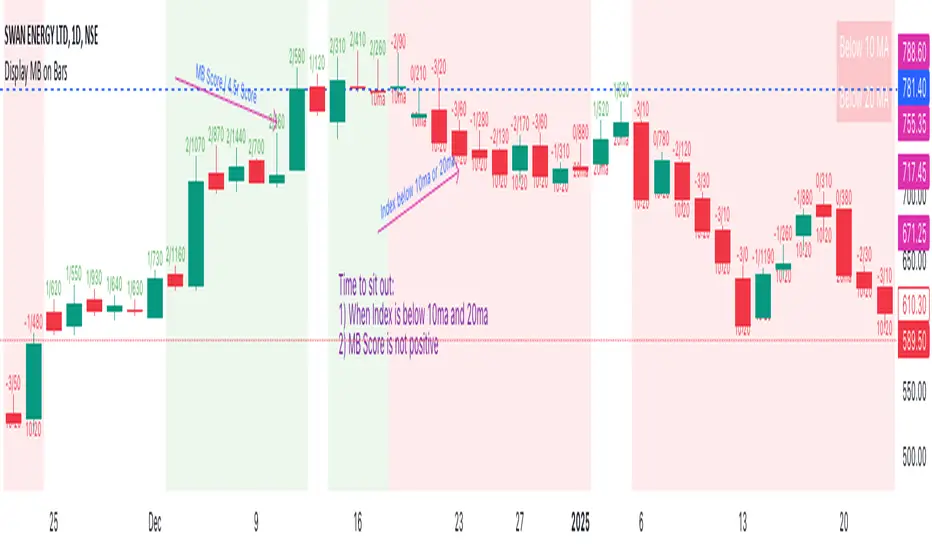
Display MB on BarsDescription
The "Display MB on Bars" Pine Script indicator is designed to visually represent Market Breadth values and R4.5 scores on trading charts. This script enables traders to highlight and analyze key market behavior using pre-defined thresholds for MB scores and dynamically calculated R4.5 values. Additionally, it includes a moving average status table to assess price levels relative to the 10-day and 20-day moving averages.
Features:
1. COB Date Matching: Displays data corresponding to specific "COB dates" provided by the user.
2. MB Value Visualization:
o Highlights bars with a background color based on MB values:
Red if MB ≤ MB_Red (default: -1).
Green if MB ≥ MB_Green (default: 3).
3. R4.5 Scores Display:
o Creates a label on the chart with the MB and R4.5 values when conditions are met (e.g., R4.5 > 200 or specific MB thresholds).
4. Index Moving Average Comparison:
o Calculates 10-day and 20-day moving averages for the selected symbol (default: NSE:NIFTYMIDSML400).
o Shows the price position relative to these moving averages in a table.
How to Use:
1. Configure Inputs:
o COB Dates: Enter a comma-separated list of dates in the format DD-MM-YYYY.
o MB Values: Provide the corresponding MB scores for the COB dates.
o R4.5 Values: Provide the R4.5 scores for the COB dates.
o Set the thresholds for MB values (MB Red<= and MB Green>=).
o Toggle features like MB, RS (R4.5), and the moving average status table.
2. Interpret the Output:
o Observe background colors on the bars:
Red: Indicates MB is less than or equal to the lower threshold.
Green: Indicates MB exceeds the upper threshold.
o Check labels above bars for R4.5 and MB values when conditions are met.
o Refer to the status table on the top-right corner to understand price positions relative to 10-day and 20-day moving averages.
This script is especially useful for traders seeking insights into custom metrics like MB and R4.5, enabling quick identification of key patterns and trends in the market.
Waldo RSI Overlay :oWaldo RSI Overlay :o Indicator Guide
Welcome to the guide for the Waldo RSI Overlay :o indicator on TradingView. This tool enhances your trading analysis through RSI-based overlays for trend analysis, divergence detection, and breakout/breakdown signals when used with its companion indicator, Waldo RSI :o.
Key Features:
RSI Overlay:
• RSI Source: Choose from:
o ON RSI: Uses the RSI values directly to detect pivots, focusing on RSI highs and lows for trend analysis.
o ON HIGH, ON CLOSE, ON LOW, ON OPEN:
These options base pivot detection on price action at those specific points, offering an alternative market structure view.
• RSI Settings:
o Source: Default is (H+L)/2, but you can select any price for RSI calculation.
o Length: Default RSI length is 7, which you can adjust for sensitivity.
Trend Lines:
• Show Trend Lines: Toggle to display trend lines based on pivot points.
• Zigzag Length: Sets the sensitivity of pivot point detection.
• Confirm Length: Ensures the validity of pivot points (default is 3).
• Colors: Customize colors for Higher Highs (HH), Lower Highs (LH), Higher Lows (HL), and Lower Lows (LL).
• Transparency and Line Width: Control how trend lines and fills appear.
• Label Size: Adjust the size of labels identifying pivot points.
Divergences:
• Classic Divergences:
o Show Classic Div: Enable to highlight regular divergences where price and RSI move in opposite directions.
o Colors: Define colors for bullish and bearish divergence lines and labels.
o Transparency and Line Width: Adjust the visual impact of divergence signals.
• Hidden Divergences:
o Similar settings as classic, but these highlight divergences indicating trend continuation.
Breakout/Breakdown:
• Show Breakout/Breakdown: When activated, this feature signals when the price breaks through previous highs or lows. To activate these breakouts, you need the companion indicator Waldo RSI :o, select the SRC in the External section, and select the crossovers for each one.
This combination provides RSI confirmation for breakout/breakdown events.
Overbought/Oversold Zones:
• Show Overbought and Oversold Zones: Bars are colored when RSI exceeds 70 (purple) or falls below 30 (blue), indicating potential market extremes.
Moving Averages (Optional):
• Show Moving Averages: Option to overlay two moving averages for trend confirmation.
• Source, Type, Length: Customize each MA's configuration.
Ghost Lines (Optional):
• Ghost Lines: When enabled, trend lines extend for only a specified period (Ghost Length) instead of indefinitely.
How to Use the Indicator:
1. Setup:
o Configure RSI settings by choosing the RSI Source and adjusting the RSI Length to suit your trading style.
o Set the Zigzag Length and Confirm Length for trend line sensitivity based on market volatility.
2. Trend Analysis:
o Look at the colored horizontal lines and fills for HH, LH, HL, LL to discern market structure and potential reversal points.
3. Divergence Detection:
o Identify divergences where price and RSI diverge. Regular divergences might signal trend exhaustion, while hidden ones could indicate trend persistence.
4. Breakout/Breakdown Signals:
o Ensure you have both the Waldo RSI Overlay :o and Waldo RSI :o indicators applied. Green triangles below bars signal breakouts; red ones above indicate breakdowns, based on price movement with RSI confirmation from the companion indicator.
5. Overbought/Oversold:
o Use these colored zones to spot potential momentum shifts or reversal areas.
6. Moving Averages on RSI:
o If used, these can help confirm trends or identify crossover signals for additional trade confirmation.
7. Ghost Lines:
o For a less cluttered chart, enable this to limit how far trend lines extend.
Tips for Usage:
• Always combine this indicator with other analytical tools for better confirmation. No single indicator should guide all decisions.
• Adjust settings according to the asset's behavior and your trading timeframe.
• Regularly review your settings as market dynamics change.
Remember, trading involves risk, and past performance doesn't predict future outcomes. Use this indicator within a comprehensive trading strategy.

2 MA Simplified Sideways Candle ColorsHow to Use the Indicator: A Simple Guide
This custom indicator colors candlesticks to help you quickly identify market conditions based on two moving averages (9-period and 21-period). Here’s how to get started:
Add the Indicator to Your Chart:
Copy the provided Pine Script code.
Open TradingView and navigate to the Pine Editor.
Paste the code into a new script, save it, and then add the indicator to your chart.
Understand the Candlestick Colors:
Green Candles (Bullish):
Indicates a bullish market when the price is above the 9-period SMA and the 9 SMA is above the 21 SMA.
Red Candles (Bearish):
Indicates a bearish market when the price is below the 21-period SMA and the 9 SMA is below the 21 SMA.
Yellow Candles (Sideways):
Indicates a sideways (neutral) market when:
Condition 1: Price is below the 9 SMA but above the 21 SMA, with the 9 SMA above the 21 SMA, or
Condition 2: The 9 SMA is below the 21 SMA, and the price lies between them.
White Candles (No Clear Signal):
Used when none of the above conditions apply.
Interpreting the Signals:
When you see green candles, the market is showing bullish momentum.
When you see red candles, bearish pressure is dominant.
Yellow candles suggest the market is moving sideways without a strong trend.
White candles mean that none of the specific conditions (bullish, bearish, or sideways) are currently met.
Chart Reference:
The script also plots two moving averages on your chart (a blue line for the 9-period SMA and an orange line for the 21-period SMA). These lines help visualize how price interacts with these averages.
Using the Indicator in Practice:
Once added to your chart, monitor the color of the candlesticks:
Green signals may be opportunities to consider long positions.
Red signals may indicate a good time to consider short positions or tighten stops.
Yellow signals suggest caution as the market isn’t trending strongly.
White candles indicate no strong signal, so it might be a period of consolidation or indecision.
This simple visual cue system allows you to quickly assess market sentiment and make more informed trading decisions based on the relationship between price and the two moving averages.

Arrow-SimplyTrade vol1.5-FinalTitle: Arrow-SimplyTrade vol1.5-Final
Description:
This advanced trading indicator is designed to assist traders in analyzing market trends and identifying optimal entry signals. It combines several popular technical analysis tools and strategies, including EMA (Exponential Moving Average), MA (Simple Moving Averages), Bollinger Bands, and candlestick patterns. This indicator provides both trend-following and counter-trend signals, making it suitable for various trading styles, such as scalping and swing trading.
Main Features:
EMA (Exponential Moving Average):
EMA200 is the main trend line that helps determine the overall market direction. When the price is above EMA200, the trend is considered bullish, and when the price is below EMA200, the trend is considered bearish.
It helps filter out signals that go against the prevailing market trend.
Simple Moving Averages (MA5 and MA15):
This indicator uses two Simple Moving Averages: MA5 (Fast) and MA15 (Slow). Their crossovers create buy or sell signals:
Buy Signal: When MA5 crosses above MA15, signaling a potential upward trend.
Sell Signal: When MA5 crosses below MA15, signaling a potential downward trend.
Bollinger Bands:
Bollinger Bands measure market volatility and can identify periods of overbought or oversold conditions. The Upper and Lower Bands help detect potential breakout points, while the Middle Line (Basis) serves as dynamic support or resistance.
This tool is particularly useful for identifying volatile conditions and potential reversals.
Arrows:
The indicator plots arrows on the chart to signal entry opportunities:
Green Arrows signal buy opportunities (when MA5 crosses above MA15 and price is above EMA200).
Red Arrows signal sell opportunities (when MA5 crosses below MA15 and price is below EMA200).
Opposite Arrows: Optionally, the indicator can also display arrows for counter-trend signals, triggered by MA5 and MA15 crossovers, regardless of the price's position relative to EMA200.
Candlestick Patterns:
The indicator detects popular candlestick patterns such as Bullish Engulfing, Bearish Engulfing, Hammer, and Doji.
These patterns are important for confirming entry points or anticipating trend reversals.
How to Use:
EMA200: The main trend line. If the price is above EMA200, consider long positions. If the price is below EMA200, consider short positions.
MA5 and MA15: Short-term trend indicators. The crossover of these averages generates buy or sell signals.
Bollinger Bands: Use these bands to spot overbought/oversold conditions. Breakouts from the bands may signal potential entry points.
Arrows: Green arrows represent buy signals, and red arrows represent sell signals. Opposite direction arrows can be used for counter-trend strategies.
Candlestick Patterns: Patterns like Bullish Engulfing or Doji can help confirm the signals.
Customizable Settings:
Fully customizable colors, line styles, and display settings for EMA, MAs, Bollinger Bands, and arrows.
The Candlestick Patterns feature can be toggled on or off based on user preference.
Important Notes:
This indicator is intended to be used in conjunction with other analysis tools.
Past performance does not guarantee future results.
Polish:
Tytuł: Arrow-SimplyTrade vol1.5-Final
Opis:
Ten zaawansowany wskaźnik handlowy jest zaprojektowany, aby pomóc traderom w analizie trendów rynkowych oraz identyfikowaniu optymalnych sygnałów wejścia. Łączy w sobie kilka popularnych narzędzi analizy technicznej i strategii, w tym EMA (Wykładnicza Średnia Ruchoma), MA (Prosta Średnia Ruchoma), Bollinger Bands oraz formacje świecowe. Wskaźnik generuje zarówno sygnały podążające za trendem, jak i przeciwnym trendowi, co sprawia, że jest odpowiedni do różnych stylów handlu, takich jak scalping oraz swing trading.
Główne Funkcje:
EMA (Wykładnicza Średnia Ruchoma):
EMA200 to główna linia trendu, która pomaga określić ogólny kierunek rynku. Gdy cena znajduje się powyżej EMA200, trend jest uznawany za wzrostowy, a gdy poniżej EMA200, za spadkowy.
Pomaga to filtrować sygnały, które są niezgodne z głównym trendem rynkowym.
Proste Średnie Ruchome (MA5 i MA15):
Wskaźnik używa dwóch Prostych Średnich Ruchomych: MA5 (szybka) oraz MA15 (wolna). Ich przecięcia generują sygnały kupna lub sprzedaży:
Sygnał Kupna: Kiedy MA5 przecina MA15 od dołu, sygnalizując potencjalny wzrost.
Sygnał Sprzedaży: Kiedy MA5 przecina MA15 od góry, sygnalizując potencjalny spadek.
Bollinger Bands:
Bollinger Bands mierzą zmienność rynku i mogą pomóc w identyfikowaniu okresów wykupienia lub wyprzedania rynku. Górna i dolna linia pomagają wykrywać punkty wybicia, a Środkowa Linia (Basis) działa jako dynamiczny poziom wsparcia lub oporu.
Narzędzie to jest szczególnie przydatne w wykrywaniu warunków zmienności i potencjalnych odwróceń trendu.
Strzałki:
Wskaźnik wyświetla strzałki na wykresie, które wskazują sygnały kupna i sprzedaży:
Zielona strzałka wskazuje sygnał kupna (gdy MA5 przecina MA15 i cena jest powyżej EMA200).
Czerwona strzałka wskazuje sygnał sprzedaży (gdy MA5 przecina MA15 i cena jest poniżej EMA200).
Strzałki w przeciwnym kierunku: Opcjonalna funkcja, która pokazuje strzałki w przeciwnym kierunku, uruchamiane przez przecięcia MA5 i MA15, niezależnie od pozycji ceny względem EMA200.
Formacje Świecowe:
Wskaźnik wykrywa popularne formacje świecowe, takie jak Bullish Engulfing, Bearish Engulfing, Hammer oraz Doji.
Formacje te pomagają traderom potwierdzić punkty wejścia i przewidzieć możliwe odwrócenia trendu.
Jak Używać:
EMA200: Główna linia trendu. Jeśli cena jest powyżej EMA200, rozważaj pozycje długie. Jeśli cena jest poniżej EMA200, rozważaj pozycje krótkie.
MA5 i MA15: Śledzą krótkoterminowe zmiany trendu. Przecięcia tych średnich generują sygnały kupna lub sprzedaży.
Bollinger Bands: Używaj tych pasm do wykrywania wykupionych lub wyprzedanych warunków. Wybicia z pasm mogą wskazywać potencjalne punkty wejścia.
Strzałki: Zielona strzałka wskazuje sygnał kupna, a czerwona strzałka sygnał sprzedaży. Strzałki w przeciwnym kierunku mogą być używane do strategii przeciwtrendowych.
Formacje Świecowe: Formacje takie jak Bullish Engulfing czy Doji mogą pomóc w potwierdzaniu sygnałów.
Ustawienia Personalizacji:
W pełni personalizowalne kolory, style linii i ustawienia wyświetlania dla EMA, MAs, Bollinger Bands oraz strzałek.
Funkcja Formacji Świecowych może być włączana lub wyłączana według preferencji użytkownika.
Ważne Uwagi:
Ten wskaźnik powinien być używany w połączeniu z innymi narzędziami analizy rynku.
Wyniki z przeszłości nie gwarantują wyników w przyszłości.

Titan Wings 3 (by Oberlunar)Titan Wings 3: Volatility and Trend Dynamics Tool
Description:
Titan Wings 3 is a comprehensive indicator designed to help traders navigate complex market conditions by integrating volatility analysis, advanced moving averages, and dynamic signal generation. This script is not a simple combination of public domain tools; it is a carefully engineered system that merges statistical insights with market structure analysis to deliver actionable signals.
Core Functionality:
The indicator uses log returns to calculate volatility, which is then conditioned by price behavior relative to multiple moving averages. Volatility bands are dynamically adjusted based on percentile ranks, standard deviations, and ATR values to provide traders with precise zones of market activity. These bands are visualized on the chart, highlighting areas of potential breakout or reversal.
Titan Wings 3 features three types of moving averages—Exponential (EMA), Simple (SMA), and Hull (HMA)—giving users flexibility to align the tool with their trading strategies. The script evaluates price action relative to these averages, identifying critical zones where market sentiment shifts.
In addition to trend-following metrics, the script dynamically generates labels to signal key trading opportunities. These signals are derived from normalized distance calculations between the price and selected moving averages, combined with a proprietary methodology for filtering noise and amplifying significant trends.
Why Titan Wings 3 Stands Out:
Originality: Titan Wings 3 is not a generic mashup of indicators. Its unique normalization technique for distance metrics, percentile-based volatility thresholds, and the use of Hull Moving Averages make it a sophisticated tool for identifying high-probability trades.
Actionable Insights: The script provides real-time labels and visual cues for both long and short opportunities, allowing traders to act decisively during key moments of price action.
Adaptability: The customizable parameters for moving average types, percentile thresholds, and volatility multipliers ensure that the tool can adapt to various market conditions and trading styles.
How It Works:
Volatility Bands: Percentile-based calculations and ATR/standard deviation multipliers are used to create adaptive upper and lower bands, highlighting areas of market expansion and contraction.
Dynamic Labels: Signals are generated based on normalized metrics that measure the price's relationship to key moving averages, providing a reliable framework for trend identification.
Visual Overlays: The script fills specific price zones with color-coded areas to indicate bullish or bearish conditions, enhancing the clarity of market structure.
How to Use It:
Adjust the moving average type and parameters to align with your trading style.
Use the volatility bands to identify breakouts or reversals.
Follow the real-time labels to confirm potential trade entries.
Pay attention to the visual overlays to quickly assess market sentiment.

Volume Weighted Jurik Moving AverageThe Jurik Moving Average (JMA) is a smoothing indicator that is designed to improve upon traditional moving averages by reducing lag while enhancing responsiveness to price movements. It was created by Jurik Research and is often used to track trends with greater accuracy and minimal delay. The JMA is based on a combination of **exponential smoothing** and **phase adjustments**, making it more adaptable to varying market conditions compared to standard moving averages like SMA (Simple Moving Average) or EMA (Exponential Moving Average).
The core advantage of the JMA lies in its ability to adjust to price changes without excessively lagging, which is a common issue with traditional moving averages. It incorporates a **phase parameter** that can be adjusted to smooth out the signal further or make it more responsive to recent price action. This phase adjustment allows traders to fine-tune the JMA's sensitivity to the market, optimizing it for different timeframes and trading strategies.
How JMA Works and Benefits of Adding Volume Weight
The JMA works by applying a **smoothing process** to price data while allowing for adjustments through its phase and power parameters. These parameters help control the degree of smoothness and responsiveness. The result is a curve that follows price trends closely but with less lag than traditional moving averages.
Adding **volume weighting** to the JMA enhances its ability to reflect market activity more accurately. Just like the **Volume-Weighted Moving Average (VWMA)**, volume-weighting adjusts the moving average based on the strength of trading volume, meaning that price movements with higher volume will have a greater influence on the JMA. This can help traders identify trends that are supported by significant market participation, making the moving average more reliable.
The benefit of a volume-weighted JMA is that it responds more effectively to price movements that occur during periods of high trading volume, which are often considered more significant. This can help traders avoid false signals that may occur during low-volume periods when price changes may not reflect true market sentiment. By incorporating volume into the calculation, the JMA becomes more aligned with real market conditions, enhancing its effectiveness for trend identification and decision-making.
Adaptive Fibonacci Trend Ribbon[FibonacciFlux]Adaptive Fibonacci Trend Ribbon (FibonacciFlux)
Overview
The Adaptive Fibonacci Trend Ribbon is a versatile technical analysis tool designed for traders who want to leverage the power of multiple moving averages while integrating Fibonacci numbers. This indicator provides a dynamic visual representation of market trends, enhancing decision-making processes in trading.
Key Features
1. Multi-Moving Averages
- The indicator calculates eight different moving averages based on user-defined periods, including Fibonacci numbers such as 5, 8, 13, 21, 34, 55, 89, and 144.
- Traders can choose from various moving average types, including EMA, HMA, WMA, VWMA, ALMA, SMA, RMA, and TMA , allowing for tailored analysis based on market conditions.
2. Trend Detection
- Each moving average is color-coded based on its trend direction, with green indicating an upward trend and red indicating a downward trend.
- This visual clarity helps traders quickly assess market sentiment and make informed decisions.
3. Fill Areas for Enhanced Insight
- The indicator features fill areas between the moving averages, which dynamically change color according to their relative positions.
- This provides a clear visual cue of trend strength and potential reversal points, allowing traders to identify key areas of interest.
4. Customizable Inputs
- Users can easily adjust the source data, moving average lengths, and ALMA parameters (offset and sigma) to fit their trading strategies.
- This flexibility ensures that traders can adapt the tool to various market conditions and personal preferences.
Insights and Applications
1. Fibonacci Integration
- By incorporating Fibonacci numbers into the moving average periods, this indicator allows traders to align their strategies with key levels of support and resistance.
- This can enhance the accuracy of entry and exit points, particularly in trending markets.
2. Trend Continuation and Reversal Analysis
- The adaptive nature of the moving averages provides insights into potential trend continuations or reversals.
- Traders can use the indicator to identify when to enter or exit positions based on the interaction between the moving averages.
3. Visual Clarity for Quick Decisions
- The color-coded moving averages and fill areas offer immediate visual feedback on market conditions, helping traders react swiftly to changing dynamics.
- This is especially useful in fast-moving markets where timely decisions are critical.
Conclusion
The Adaptive Fibonacci Trend Ribbon is an essential tool for traders looking to enhance their technical analysis capabilities. By combining multiple moving averages with Fibonacci integration and dynamic visual cues, this indicator offers a robust framework for understanding market trends. Its flexibility and clarity make it an invaluable asset for both novice and experienced traders alike.
Open Source Contribution
This indicator is open source, inviting contributions and improvements from the trading community. Feel free to fork, enhance, and share your insights with the world, helping to foster a collaborative environment for traders everywhere.
