2 MA Ratio Can Help with Moving AveragesMany technical analysts use moving average crosses to assess trend changes. A faster-moving MA crossing above a slower-moving line may be viewed as a bullish signal. The opposite can apply to the downside.
While these methods may help analyze price direction, they can often force traders to wait until the cross occurs. Sometimes it may be useful to anticipate the event – or at least know it’s getting close.
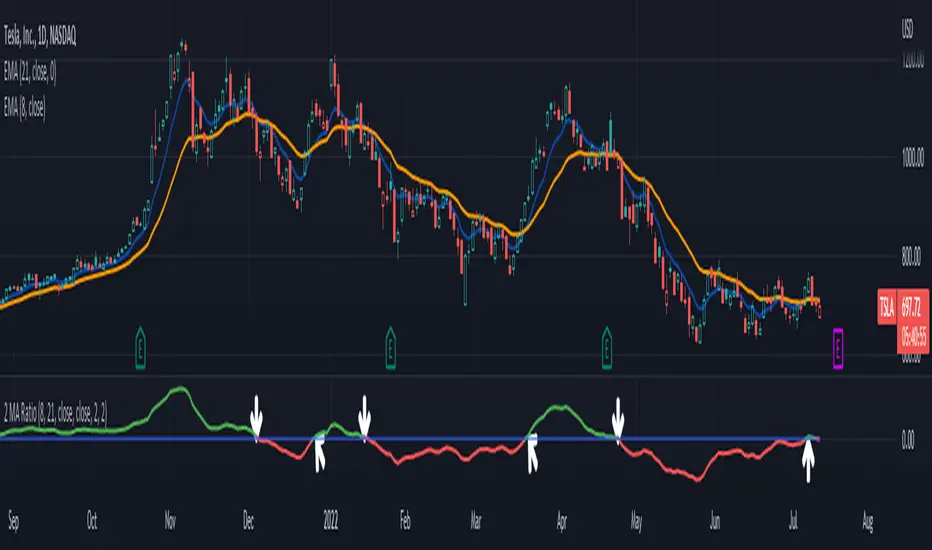
That’s where the custom script 2 MA Ratio can be useful because it tracks the fast and slow moving averages. The fast MA is then shown as a percent of the slow MA. Positive readings indicate a bullish condition and vice versa for the negative.
It’s also color-coded to clearly illustrate when the crosses occur.
2 MA Ratio can handle simple moving averages (SMAs) and exponential moving averages (EMAs). It even lets you compare SMAs to EMAs. Users can choose between using open, high, low or closing prices as the inputs. (It defaults to Close.)
The chart above shows the short-term pair of the 8- and 21-day EMAs on Tesla (TSLA). The second chart below shows the same stock with the slower 50- and 200-day SMAs. Notice the “Golden Cross” last summer and the “Death Cross” in May:
TradeStation has, for decades, advanced the trading industry, providing access to stocks, options, futures and cryptocurrencies. See our Overview for more.
Important Information
TradeStation Securities, Inc., TradeStation Crypto, Inc., and TradeStation Technologies, Inc. are each wholly owned subsidiaries of TradeStation Group, Inc., all operating, and providing products and services, under the TradeStation brand and trademark. You Can Trade, Inc. is also a wholly owned subsidiary of TradeStation Group, Inc., operating under its own brand and trademarks. TradeStation Crypto, Inc. offers to self-directed investors and traders cryptocurrency brokerage services. It is neither licensed with the SEC or the CFTC nor is it a Member of NFA. When applying for, or purchasing, accounts, subscriptions, products, and services, it is important that you know which company you will be dealing with. Please click here for further important information explaining what this means.
This content is for informational and educational purposes only. This is not a recommendation regarding any investment or investment strategy. Any opinions expressed herein are those of the author and do not represent the views or opinions of TradeStation or any of its affiliates.
Investing involves risks. Past performance, whether actual or indicated by historical tests of strategies, is no guarantee of future performance or success. There is a possibility that you may sustain a loss equal to or greater than your entire investment regardless of which asset class you trade (equities, options, futures, or digital assets); therefore, you should not invest or risk money that you cannot afford to lose. Before trading any asset class, first read the relevant risk disclosure statements on the Important Documents page, found here: www.tradestation.com .
Cerca negli script per "averages"
Pythagorean Means of Moving AveragesDESCRIPTION
Pythagorean Means of Moving Averages
1. Calculates a set of moving averages for high, low, close, open and typical prices, each at multiple periods.
Period values follow the Fibonacci sequence.
The "short" set includes moving average having the following periods: 5, 8, 13, 21, 34, 55, 89, 144, 233, 377.
The "mid" set includes moving average having the following periods: 5, 8, 13, 21, 34, 55, 89, 144, 233, 377, 610, 987, 1597.
The "long" set includes moving average having the following periods: 5, 8, 13, 21, 34, 55, 89, 144, 233, 377, 610, 987, 1597, 2584, 4181.
2. User selects the type of moving average: SMA, EMA, HMA, RMA, WMA, VWMA.
3. Calculates the mean of each set of moving averages.
4. User selects the type of mean to be calculated: 1) arithmetic, 2) geometric, 3) harmonic, 4) quadratic, 5) cubic. Multiple mean calculations may be displayed simultaneously, allowing for comparison.
5. Plots the mean for high, low, close, open, and typical prices.
6. User selects which plots to display: 1) high and low prices, 2) close prices, 3) open prices, and/or 4) typical prices.
7. Calculates and plots a vertical deviation from an origin mean--the mean from which the deviation is measured.
8. Deviation = origin mean x a x b^(x/y)/c.
9. User selects the deviation origin mean: 1) high and low prices plot, 2) close prices plot, or 3) typical prices plot.
10. User defines deviation variables a, b, c, x and y.
Examples of deviation:
a) Percent of the mean = 1.414213562 = 2^(1/2) = Pythagoras's constant (default).
b) Percent of the mean = 0.7071067812 = = = sin 45˚ = cos 45˚.
11. Displaces the plots horizontally +/- by a user defined number of periods.
PURPOSE
1. Identify price trends and potential levels of support and resistance.
CREDITS
1. "Fibonacci Moving Average" by Sofien Kaabar: two plots, each an arithmetic mean of EMAs of 1) high prices and 2) low prices, with periods 5, 8, 13, 21, 34, 55, 89, 144, 233, 377, 610, 987, 1597, 2584, 4181.
2. "Solarized" color scheme by Ethan Schoonover.

Pivot Expotential Moving AveragesPivot MA's indicator is a combination of the following:
Pivot SMA
Pivot EMA's
Pullback to EMA Band
Pivot EMA's Cross Over
Pivot Double-EMA's Cross Over
Modified Pivot EMA's Cross Over
All the pivot EMA’s calculations are based on "Profiting With Pivot-Based Moving Averages" book by Frank Ochoa.
How to use it :-
One should have to refer this book for in depth usage of this indicator.
You can use the option's provided in the indicator and the signals have been generated according to the concept in this book.
Don't turn on multiple option's, it becomes clumsy to look.
Description:-
1. Pullback to PEMA Band:-
Perhaps the most trader-friendly PEMA setup is the PEMA Pull-Back, because it forces you to trade in the direction of an established trend.
In this, u get the signal when the price retraces to 13 EMA and closes above the PEMA Band.
It is like Buy the Dips & Sell the Rips. The idea of the PEMA Pull-Back is to buy the market at a discount during an uptrend, and sell the market at a premium during a down trend.
2. PEMA Cross Over :-
The PEMA Crossover fires a signal when the fast EMA crosses the slow EMA.
If the fast EMA crosses above the slow EMA, a long signal is fired; whereas, if the fast EMA crosses below the slow EMA, a short signal is fired.
Depending on your trader personality, you will have to choose the periodicities of the two moving averages to suit your taste.
Some combination of EMA's are provided.
3. Double EMA Cross Over :-
A double exponential moving average (DEMA) is basically the EMA of an EMA, meaning the output is the second derivative of the original exponential moving average.
While an EMA is a faster moving average than the SMA, the DEMA is on another level in terms of speed.
4. Modified PEMA Cross Over :-
This system is an ultra-fast PEMA crossover signal that has built-in trend confirmation.
The Modified PEMA Crossover system fires signals in the direction of the prevailing trend, as measured by a larger moving average.
For Example, Take (1,3),21 combination. In this we use 1- and 3-period pivot EMA’s for crossovers, and use a 21-period pivot EMA for trend confirmation.
1 and 3 period EMA's are not shown in the chart, Only 21 EMA and signals are shown for clear view.
Therefore, this system will only allow bullish crossover signals to fire when price is above the 21-period pivot EMA, and will only allow bearish crossover signals to fire when price is below the 21-period average.
In essence, the results are usually highly qualified “buy the dip, and sell rip” type of opportunities.
Disclaimer :-
The PEMA setups that are covered in this indicator offer some of the ways to approach the market using moving averages.
Not all setups and styles of trading will fit all traders, no matter how profitable the approach.
You must use what fits your trader profile and your trading approach.
Thank You ..

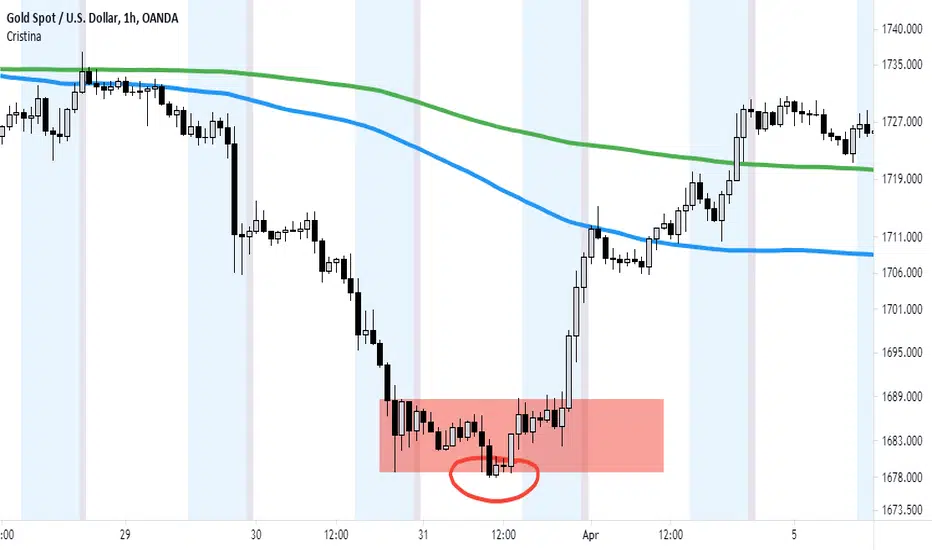
Cristina - Trading Sessions and Moving AveragesCombination of Trading Sessions and Moving Averages. You can easily edit the time frame background to give you a visual presentation of your most active trading hours or customize it to represent the different forex trading session inline with your local time.
The default moving average here is the 20, 50, 100, 200 and 250 MA. The use of moving averages could be in a (1) form of cross over to find out the dominant trend, (2) use it to find value zone or (3) use it to find dynamic support levels. It greatly depends on your trading system.
With the combination of the trading sessions and the moving averages, you could isolate the trades you will be taking inline with your active hours. Thus this is a great tool to add in terms of day trading or swing trading with the lower time frames.
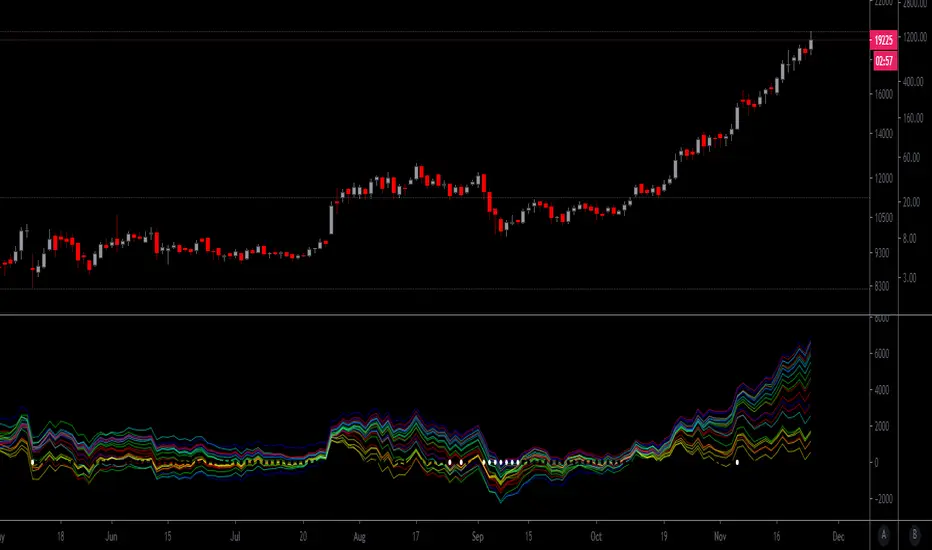
Distance From-22-Moving Averages over CMOODYwilliamsVIXFIXThis script is a mean reversion script where each of the moving averages represent the price and Chris Moody's Williams Vix Fix ZERO line represents the moving averages. There are 4 moving average types included: EMA , SMA , WMA , HMA .
You can set up to your liking by having all of the averages as any or all of the 4 options.
This script is a great way to spot bearish/bullish divergences in price action.
This script is also excellent at indicating periods of price action when volatility is extremely low - all the plots get very tight instead of spread out.
I have copy/pasted a public script by Chris Moody which is the Williams Vix Fix. This indicator shows a white circle as a "top" or "bottom" based on the current price distance off the mean (in simple terms).
Thank you Chris Moody!
Trend Following with Moving AveragesHello Traders,
With the info "Trend is Your Friend ", you should not take position against the trend. This script checks multipte moving averages if they are above/below the closing price and try to find trend. The moving averages with the length 8, 13, 21, 34, 55, 89, 144, 233, 377 used. these are fibonacci numbers, but optionally you can change the lengths of each moving averages. while it's green you better take long positions, while it's red you better take short positions according to other indcators or tools.
Optionally you have "smoothing" option to get rid of whipsaws. it's enabled by default.
You have option to use following moving average types: EMA, SMA, RMA, WMA, VWMA. by default it's EMA
Also the script has "Resolution" option. with this option you can get the trend for other time frames, in following example 1h was set as for higher time frame on 15m chart:
This should not be used as buy/sell signal indicators as it's tries to find trend but not entry points, you should use other indicators (such RSI, Momentum) or other tools to find buy/sell signals.
Enjoy!

Moving Averages CrossThis Indicator helps you spot crosses between moving averages.
Thought to combine short term and long term strategies.
A complementary element for your trading tool belt.
The First study (short term):
Helps you visualise the relation between two simple moving averages (9,21) by default.
The Second study (long term):
Helps you identify the relation between three simple moving averages (50,100, 200) by default.
Spot Golden Crosses and Death Crosses from far.

Rainbow Moving AveragesThis script draws a box tower of moving averages. Each box is a unique color from the rainbow, and there are seven moving averages total. By default, 5, 10, 20, 50, 100, 150, 200 day simple moving averages are used. You could configure the numbers as you wish and also choose EMA, WMA, VWMA, or HullMA. If the price closes at or above a moving average, its box is colored otherwise the box will be gray.

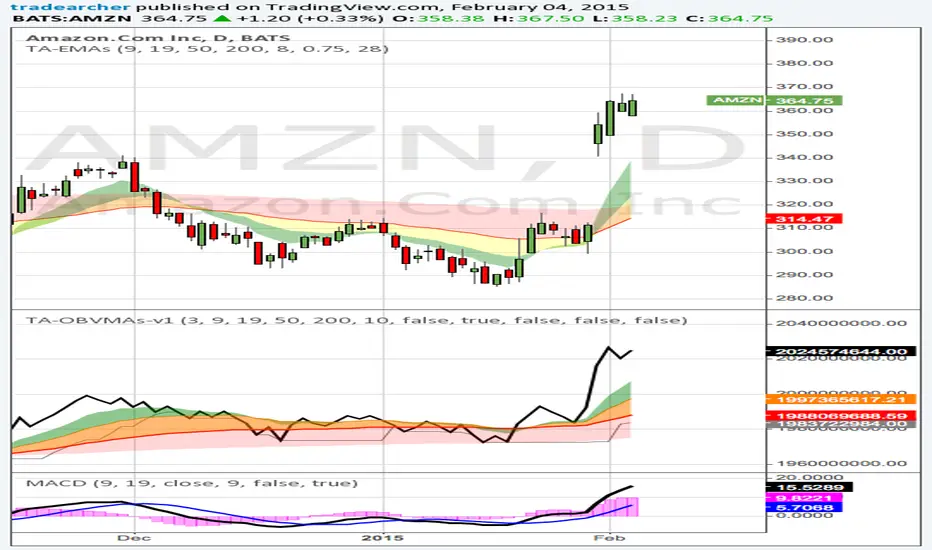
Trade Archer - On balance Volume Moving Averages - v1This indicator improves upon the normal OBV indicator by including Moving Averages of OBV. Additionally clouds have been created between the MAs if desired as well as a selection of MAs and the choice of MA lengths for personal preference. Lastly it can also plot the lowest and highest values of OBV for x bars back so one can clearly see the movement of volume increasing or decreasing. For timing both price and volume, it is good to use the same MA lengths and type for both price and volume. This helps keep timing in sync and show a strong correlation between price and volume. Volume from Market Makers are the catalysts that drive the price up and down. Patience and timing are crucial for joining the volume created by the Market Makers.
If you are new to charting and technical indicators, pick up my Trade Archer - Moving Averages - v1 script as well. The defaults for both scripts have the same moving average type and lengths so timing is the same between Price and OBV moving averages.
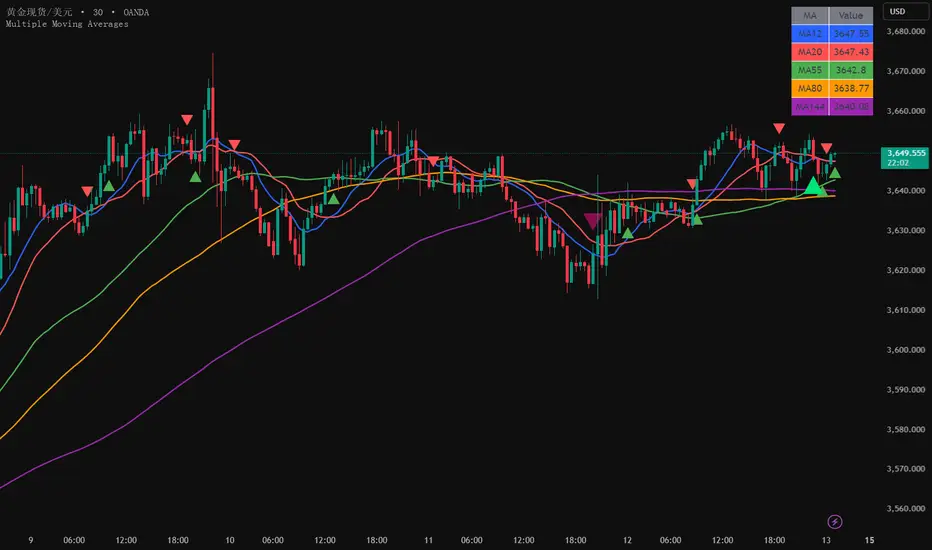
Multiple Moving Averages5 Simple Moving Averages: 12, 20, 55, 80, 144 periods
Different colors: Each moving average uses a different color for easy distinction
Crossover signals: Display crossover signals for MA12/MA20 and MA55/MA144
Value display: Show current specific values of each moving average in a table at the top right corner
Optional EMA: The commented section provides code for the EMA version, which can be uncommented if needed
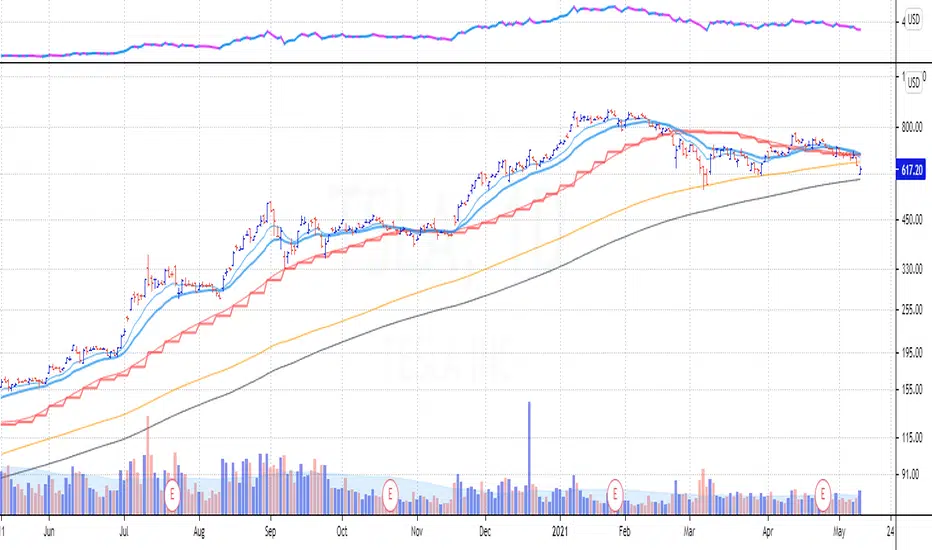
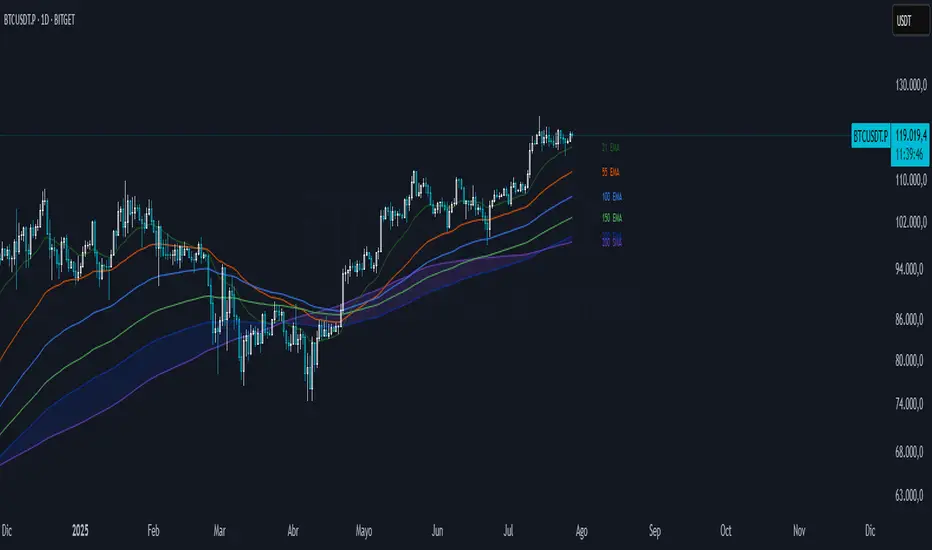
Daily and Weekly Moving Averages on Daily ChartFor the long term trend I use the 200 and 150 daily moving averages. The 200-day MA will be plotted as a black line. It is a no-go zone to buy anything trading below that.
The 150-day, or 30-week like Stan Weinstein uses, is plotted in orange.
Than I use the 50 day moving average but also the 10 week moving average. While those look similar there is a small difference which sometimes impacts the choice for selling a stock or holding on to it.
That slight difference is useful in different situations that’s why I want to have them both on my chart.
Both the 50-day and the 10-week are plotted as red lines on the chart. Since there’s only a small difference the same color gives a nicer view.
For shorter term trend I like to use the 20 and 10 day exponential moving averages. I tested these but also the commonly used 21, 9 and some other variations. But came to the conclusion that for me the 20EMA and 10EMA works best.
Both EMA’s are plotted in blue, where the 20EMA has a thicker line to easily see the difference.
Multi Time Frame Moving Averages [Anan]Hello friends,
All your popular moving average now in one indicator, also no need to open a lot of tabs to see where is that moving average at that time frame,
with multi time frame feature, now u can see up to six multi time frame MA in the same chart with option to show/hide it
list of moving averages:
SMA
Smooth SMA
SuperSmooth MA
EMA
DEMA
TEMA
Triangular MA
QEMA
RMA
Hull MA
KAMA
WMA
VWMA
VWAP
CTI
LSMA
VIDYA
Blackman Filter
Adaptive RSI
also there is an option to see the Average of four lengths, i backtest this and found it super great !

8/8/8 Moving Averages
Total of 24 individual moving averages. There are 3 groups, and each group has 8 moving averages. Each group can be set the different sources and different moving average types(SMA, EMA, RMA, WMA).

Colored Moving Averages with Zero Lag and ATR BandsEnglish description:
- You can choose from 6 different Moving Averages: SMA , EMA , WMA , VWMA , RMA, SWMA
- Turn ON/OFF the Zero Lag alghorithm
- Make it 2 colors for better visibility of a trend
- Turn ON/OFF the ATR Bands up to 5 multiplicator
- Set the offset on the time axis
Polski opis:
- Możesz wybierać z 6 różnych średnich kroczących: SMA , EMA , WMA , VWMA , RMA, SWMA
- Włączyć/Wyłączyć algorytm Zero Lag
- Włączyć opcję 2 kolorowej średniej żeby lepiej widzieć trendy
- Włączyć/Wyłączyć wstęgi ATR z maksymalnym mnożnikiem x5
- Ustawić przesunięcie względem osi czasu

10/20 MA Cross-Over with Heikin-Ashi Signals by SchobbejakThe 10/20 MA Heikin-Ashi Strategy is the best I know. It's easy, it's elegant, it's effective.
It's particularly effective in markets that trend on the daily. You may lose some money when markets are choppy, but your loss will be more than compensated when you're aboard during the big moves at the beginning of a trend or after retraces. There's that, and you nearly eliminate the risk of losing your profit in the long run.
The results are good throughout most assets, and at their best when an asset is making new all-time highs.
It uses two simple moving averages: the 10 MA (blue), and the 20 MA (red), together with heikin-ashi candles. Now here's the great thing. This script does not change your regular candles into heikin-ashi ones, which would have been annoying; instead, it subtly prints either a blue dot or a red square around your normal candles, indicating a heikin-ashi change from red to green, or from green to red, respectively. This way, you get both regular and heikin ashi "candles" on your chart.
Here's how to use it.
Go LONG in case of ALL of the below:
1) A blue dot appeared under the last daily candle (meaning the heikin-ashi is now "green").
2) The blue MA-line is above the red MA-line.
3) Price has recently breached the blue MA-line upwards, and is now above.
COVER when one or more of the above is no longer the case. This is very important. You want to keep your profit.
Go SHORT in case of ALL of the below:
1) A red square appeared above the last daily candle (meaning the heikin-ashi is now "red").
2) The red MA-line is above the blue MA-line.
3) Price has recently breached the blue MA-line downwards, and is now below.
Again, COVER when one or more of the above is no longer the case. This is what gives you your edge.
It's that easy.
Now, why did I make the signal blue, and not green? Because blue looks much better with red than green does. It's my firm believe one does not become rich using ugly charts.
Good luck trading.
--You may tip me using bitcoin: bc1q9pc95v4kxh6rdxl737jg0j02dcxu23n5z78hq9 . Much appreciated!--

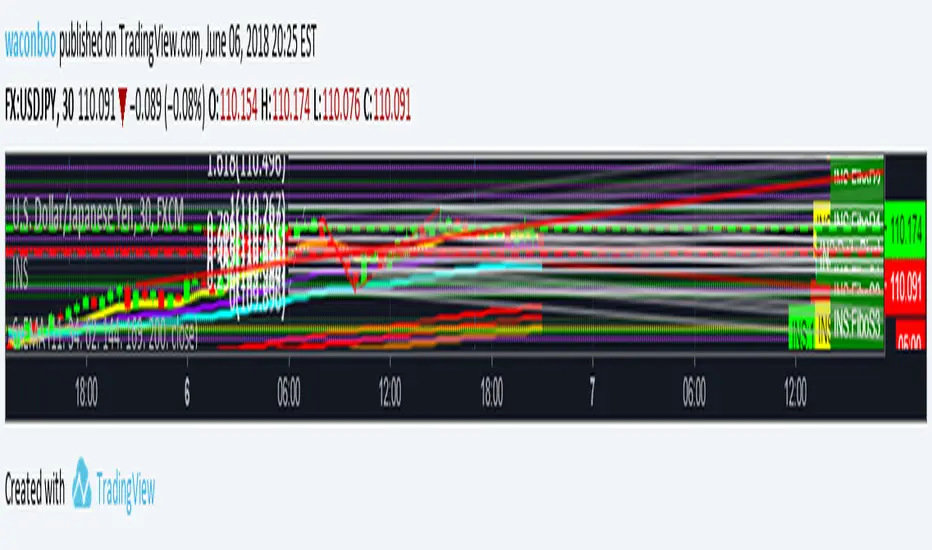
WB - 6x Exponential Moving AveragesExponential Moving Averages: 13, 34, 62, 144, 169, 200.
To be used on the 30 minute chart.
The 13 EMA and 34 EMA show price movement as related to the 62. The 144, 169, and 200 show trend of the price movement for a buyer/seller shift.

Dynamic Multi-Timeframe Moving Averages Matrix [CdeCripto]This indicator plots up to 10 customizable moving averages (EMA or SMA) from different timeframes on your chart, with optional colored fills and labels. Perfect for traders who want a clear, consolidated view of multiple trend signals at once.
Key Features
Up to 10 MAs: Independently toggle visibility, length, timeframe and type (EMA/SMA) for each moving average.
Multi-Timeframe Support: Fetches data via request.security, letting you overlay higher- or lower-frame MAs on any chart.
Conditional Fills: Optional translucent fills between adjacent MAs to highlight relative strength—green when the faster MA is above, red when below.
Dynamic Labels: On-chart text boxes showing MA length, period and type—fully configurable colour and size for quick reference.
Clean, Lightweight Code: Highly commented and optimized for performance; minimal risk of hitting TradingView’s line/label limits.
Inputs
MA Visibility: Show/hide each of the 10 moving averages.
Length & Type: Set period (e.g. 50, 200) and choose EMA or SMA.
Timeframe: Specify any built-in or custom timeframe (e.g. 1h, 4h, D, W, M).
Colour & Style: Pick distinct colours for each MA; adjust line width and style.
Fill Options: Toggle fills between MA1–MA2, MA2–MA3, … MA9–MA10 and set fill transparency.
Label Options: Turn labels on/off, override label colour, choose font size.
Usage
Scan multiple trend horizons at a glance—ideal for strategies that combine short, medium and long-term moving average signals.
Spot regime changes: when a shorter‐term MA crosses above/below a longer-term MA, the colored fill instantly highlights the shift.
Keep your chart tidy: show only the MAs and fills you need, hide the rest.
How to Add
Copy the Pine Script code into a new indicator in TradingView’s Pine Editor.
Click “Add to Chart.”
Open the settings panel to customize each MA, fills, and labels.
Disclaimer: For educational purposes only. Not financial advice.
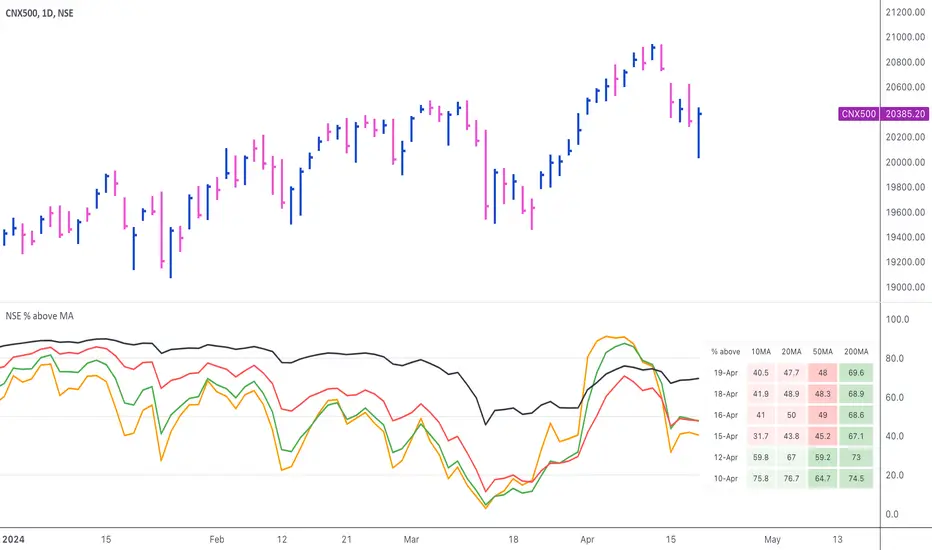
NSE Percentage of stocks above Moving AveragesThis indicator displays the percentage of NSE (India) stocks trading above key moving averages.
Market breadth measures the degree of participation & the conviction in the overall mood of the underlying index. A positive market breadth is said to happen when more stocks are advancing than are declining. Among many ways to measure this, one simple way is the % of stocks trading above a certain moving average. When most of the stocks are trading above a specific moving average, the market breadth is termed strong.
This script uses 10-day & 20-day EMA for short-term timeframes, & 50-day & 200-day EMA for medium to long-term timeframes.
Default Mode
We have a bullish bias when >50% of stocks are above their 50-day and 200-day MAs. We have a bearish bias when <50% of stocks are above their 50-day and 200-day MAs.
We also look at short-term timeframes (10 & 20 MA) for overbought and oversold levels. Values above 80% are considered overbought and readings below 20% are deemed oversold .
Individual Moving averages, & the table also, can be turned off.
Oversold/overbrought market breadth does not necessarily indicate reversal, but rather an exhaustion. This can get resolved by either a price correction or a time correction. The breadth can remain in overbought zones for a long time while the price is in a strong uptrend — and equally so at oversold zones during a strong downtrend.
Moving Average of Market Breadth
Turning-on the MA of breadth displays the 50-day Moving Average of the % of stocks above the 50-day Moving Average.
This is another way to visualise a smoothed version of the market breadth. If the % of stocks above the 50-day Moving Average is above its own 50-day Moving Average, then we can say that the breadth is strong.
Mini Mode
Turning on the mini-mode converts the table into a 4-color block, with the blocks reflecting the status of 10, 20, 50 & 200 MAs respectively, from top to bottom.
Text Mode
Turning on the text-mode converts the percentage numbers in the table into 1-word text descriptions.
Dependency:
The script uses the Pine Seeds service to import custom data hosted in a GitHub repository and accesses it via TradingView as the frontend. So, the number of bars appearing on charts is fully dependent on the amount of historical data available. Any error or omission, if there, is a reflection of the hosted data, & not that of TradingView.
Limitations:
Such data has some limitations, like it can only be updated at EOD (End-of-Day), & only daily-based timeframes can be applied to such data. Irrespective of the intraday changes, only the last saved value on the chart is seen. So, it's best to use this script as EOD, rather than intraday.
At the time of publication of this script, historical data was available till the year 2004.
The universe of stocks chosen for the data is all stocks with latest Close >= 1 and Market Cap > 10.
Credits:
NSE Market Breadth data is from Chhirag_Kedia , & the Pine seeds are courtesy of EquityCraze
[AIO] Multi Collection Moving Averages 140 MA TypesAll In One Multi Collection Moving Averages.
Since signing up 2 years ago, I have been collecting various Сollections.
I decided to get it into a decent shape and make it one of the biggest collections on TV, and maybe the entire internet.
And now I'm sharing my collection with you.
140 Different Types of Moving Averages are waiting for you.
Specifically :
"
AARMA | Adaptive Autonomous Recursive Moving Average
ADMA | Adjusted Moving Average
ADXMA | Average Directional Moving Average
ADXVMA | Average Directional Volatility Moving Average
AHMA | Ahrens Moving Average
ALF | Ehler Adaptive Laguerre Filter
ALMA | Arnaud Legoux Moving Average
ALSMA | Adaptive Least Squares
ALXMA | Alexander Moving Average
AMA | Adaptive Moving Average
ARI | Unknown
ARSI | Adaptive RSI Moving Average
AUF | Auto Filter
AUTL | Auto-Line
BAMA | Bryant Adaptive Moving Average
BFMA | Blackman Filter Moving Average
CMA | Corrected Moving Average
CORMA | Correlation Moving Average
COVEMA | Coefficient of Variation Weighted Exponential Moving Average
COVNA | Coefficient of Variation Weighted Moving Average
CTI | Coral Trend Indicator
DEC | Ehlers Simple Decycler
DEMA | Double EMA Moving Average
DEVS | Ehlers - Deviation Scaled Moving Average
DONEMA | Donchian Extremum Moving Average
DONMA | Donchian Moving Average
DSEMA | Double Smoothed Exponential Moving Average
DSWF | Damped Sine Wave Weighted Filter
DWMA | Double Weighted Moving Average
E2PBF | Ehlers 2-Pole Butterworth Filter
E2SSF | Ehlers 2-Pole Super Smoother Filter
E3PBF | Ehlers 3-Pole Butterworth Filter
E3SSF | Ehlers 3-Pole Super Smoother Filter
EDMA | Exponentially Deviating Moving Average (MZ EDMA)
EDSMA | Ehlers Dynamic Smoothed Moving Average
EEO | Ehlers Modified Elliptic Filter Optimum
EFRAMA | Ehlers Modified Fractal Adaptive Moving Average
EHMA | Exponential Hull Moving Average
EIT | Ehlers Instantaneous Trendline
ELF | Ehler Laguerre filter
EMA | Exponential Moving Average
EMARSI | EMARSI
EPF | Edge Preserving Filter
EPMA | End Point Moving Average
EREA | Ehlers Reverse Exponential Moving Average
ESSF | Ehlers Super Smoother Filter 2-pole
ETMA | Exponential Triangular Moving Average
EVMA | Elastic Volume Weighted Moving Average
FAMA | Following Adaptive Moving Average
FEMA | Fast Exponential Moving Average
FIBWMA | Fibonacci Weighted Moving Average
FLSMA | Fisher Least Squares Moving Average
FRAMA | Ehlers - Fractal Adaptive Moving Average
FX | Fibonacci X Level
GAUS | Ehlers - Gaussian Filter
GHL | Gann High Low
GMA | Gaussian Moving Average
GMMA | Geometric Mean Moving Average
HCF | Hybrid Convolution Filter
HEMA | Holt Exponential Moving Average
HKAMA | Hilbert based Kaufman Adaptive Moving Average
HMA | Harmonic Moving Average
HSMA | Hirashima Sugita Moving Average
HULL | Hull Moving Average
HULLT | Hull Triple Moving Average
HWMA | Henderson Weighted Moving Average
IE2 | Early T3 by Tim Tilson
IIRF | Infinite Impulse Response Filter
ILRS | Integral of Linear Regression Slope
JMA | Jurik Moving Average
KA | Unknown
KAMA | Kaufman Adaptive Moving Average & Apirine Adaptive MA
KIJUN | KIJUN
KIJUN2 | Kijun v2
LAG | Ehlers - Laguerre Filter
LCLSMA | 1LC-LSMA (1 line code lsma with 3 functions)
LEMA | Leader Exponential Moving Average
LLMA | Low-Lag Moving Average
LMA | Leo Moving Average
LP | Unknown
LRL | Linear Regression Line
LSMA | Least Squares Moving Average / Linear Regression Curve
LTB | Unknown
LWMA | Linear Weighted Moving Average
MAMA | MAMA - MESA Adaptive Moving Average
MAVW | Mavilim Weighted Moving Average
MCGD | McGinley Dynamic Moving Average
MF | Modular Filter
MID | Median Moving Average / Percentile Nearest Rank
MNMA | McNicholl Moving Average
MTMA | Unknown
MVSMA | Minimum Variance SMA
NLMA | Non-lag Moving Average
NWMA | Dürschner 3rd Generation Moving Average (New WMA)
PKF | Parametric Kalman Filter
PWMA | Parabolic Weighted Moving Average
QEMA | Quadruple Exponential Moving Average
QMA | Quick Moving Average
REMA | Regularized Exponential Moving Average
REPMA | Repulsion Moving Average
RGEMA | Range Exponential Moving Average
RMA | Welles Wilders Smoothing Moving Average
RMF | Recursive Median Filter
RMTA | Recursive Moving Trend Average
RSMA | Relative Strength Moving Average - based on RSI
RSRMA | Right Sided Ricker MA
RWMA | Regressively Weighted Moving Average
SAMA | Slope Adaptive Moving Average
SFMA | Smoother Filter Moving Average
SMA | Simple Moving Average
SSB | Senkou Span B
SSF | Ehlers - Super Smoother Filter P2
SSMA | Super Smooth Moving Average
STMA | Unknown
SWMA | Self-Weighted Moving Average
SW_MA | Sine-Weighted Moving Average
TEMA | Triple Exponential Moving Average
THMA | Triple Exponential Hull Moving Average
TL | Unknown
TMA | Triangular Moving Average
TPBF | Three-pole Ehlers Butterworth
TRAMA | Trend Regularity Adaptive Moving Average
TSF | True Strength Force
TT3 | Tilson (3rd Degree) Moving Average
VAMA | Volatility Adjusted Moving Average
VAMAF | Volume Adjusted Moving Average Function
VAR | Vector Autoregression Moving Average
VBMA | Variable Moving Average
VHMA | Vertical Horizontal Moving Average
VIDYA | Variable Index Dynamic Average
VMA | Volume Moving Average
VSO | Unknown
VWMA | Volume Weighted Moving Average
WCD | Unknown
WMA | Weighted Moving Average
XEMA | Optimized Exponential Moving Average
ZEMA | Zero Lag Moving Average
ZLDEMA | Zero-Lag Double Exponential Moving Average
ZLEMA | Ehlers - Zero Lag Exponential Moving Average
ZLTEMA | Zero-Lag Triple Exponential Moving Average
ZSMA | Zero-Lag Simple Moving Average
"
Don't forget that you can use any Moving Average not only for the chart but also for any of your indicators without affecting the code as in my example.
But remember that some MAs are not designed to work with anything other than a chart.
All MA and Code lists are sorted strictly alphabetically by short name (A-Z).
Each MA has its own number (ID) by which you can display the Moving Average you need.
Next to the ID selection there are tooltips with short names and their numbers. Use them.
The panel below will help you to read the Name of the selected MA.
Because of the size of the collection I think this is the optimal and most convenient use. Correct me if this is not the case.
Unknown - Some MAs I collected so long ago that I lost the full real name and couldn't find the authors. If you recognize them, please let me know.
I have deliberately simplified all MAs to input just Source and Length.
Because the collection is so large, it would be quite inconvenient and difficult to customize all MA functions (multipliers, offset, etc.).
If you need or like any MA you will still have to take it from my collection for your code.
I tried to leave the basic MA settings inside function in first strings.
I have tried to list most of the authors, but since the bulk of the collection was created a long time ago and was not intended for public publication I could not find all of them.
Some of the features were created from scratch or may have been slightly modified, so please be careful.
If you would like to improve this collection, please write to me in PM.
Also Credits, Likes, Awards, Loves and Thanks to :
@alexgrover
@allanster
@andre_007
@auroagwei
@blackcat1402
@bsharpe
@cheatcountry
@CrackingCryptocurrency
@Duyck
@ErwinBeckers
@everget
@glaz
@gotbeatz26107
@HPotter
@io72signals
@JacobAmos
@JoshuaMcGowan
@KivancOzbilgic
@LazyBear
@loxx
@LuxAlgo
@MightyZinger
@nemozny
@NGBaltic
@peacefulLizard50262
@RicardoSantos
@StalexBot
@ThiagoSchmitz
@TradingView
— 𝐀𝐧𝐝 𝐎𝐭𝐡𝐞𝐫𝐬 !
So just a Big Thank You to everyone who has ever and anywhere shared their codes.

Chilllax Moving Averages with Qullamaggie colors// Display 2 Moving Averages. Default is 10d sma and 20d sma. You can choose any length. Choose sma, or ema. Choose ma of Open, High, Low, or Close
// Color code is based on Qullamaggie's idea:
// Dark green = 10d ma > 20d ma, and both trending up
// Light green = 10d ma > 20d ma, but only 10d ma trending up
// Yellow = 10d ma > 20d ma, but neither trending up
// You can change the color
// You can hide the colors, then it will simply show 2 moving averages of your choice
// Trend is comparing the ma from X trendlen days ago. Default to 5 days ago. So, if today's ma is > 5 days ago, it is trending up

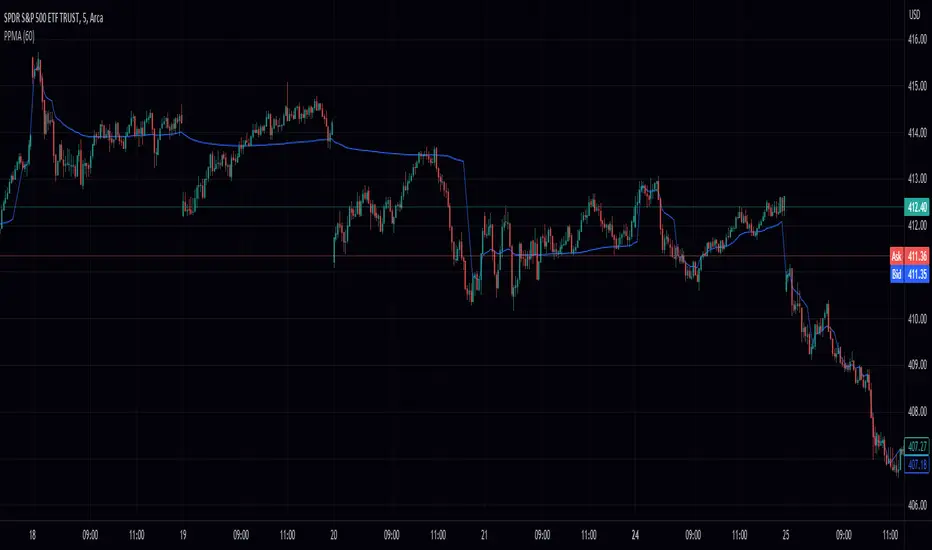
Volume Weighted Pivot Point Moving Averages VPPMAAs traders and investors, we are constantly on the lookout for tools that can assist us in making informed decisions. While there are countless technical analysis tools available, sometimes even small, simple scripts can provide valuable insights. In this post, we will explore the Volume-Weighted Pivot Point Moving Average (PPMA) Indicator – a modest yet helpful script that could potentially enhance your trading experience.
Background
// © peacefulLizard50262
//@version=5
indicator("PPMA", overlay = true)
vppma(left, right)=>
signal = ta.change(ta.pivothigh(high, left, right)) or ta.change(ta.pivotlow(low, left, right))
var int count = na
var float sum = na
var float volume_sum = na
if not signal
count := nz(count ) + 1
sum := nz(sum ) + close * volume
volume_sum := nz(volume_sum ) + volume
else
count := na
sum := na
volume_sum := na
sum/volume_sum
left = input.int(50, "Pivot Left", 0)
plot(vppma(left, 0))
The Concept Behind PPMA Indicator
The Volume-Weighted Pivot Point Moving Average (PPMA) Indicator is a straightforward technical analysis tool that aims to help traders identify potential market turning points and trends. It does this by calculating a moving average based on price and volume data while considering pivot highs and pivot lows. The PPMA Indicator is designed to be more responsive than traditional moving averages by incorporating volume into its calculations.
Understanding the Script
The script is compatible with version 5 of the TradingView Pine Script language, and it features an overlay setting, allowing the indicator to be plotted directly onto the price chart. The customizable pivot left input enables traders to adjust the sensitivity of the pivot points.
The script first identifies pivot points, which are areas where the price changes direction. It then calculates the volume-weighted average price (VWAP) of each trading period between the pivot points. Finally, it plots the PPMA line on the chart, providing a visual representation of the volume-weighted average prices.
Using the PPMA Indicator
To use the PPMA Indicator, simply add the script to your TradingView chart. The indicator will plot the PPMA line directly onto the price chart. You can adjust the pivot left input to modify the sensitivity of the pivot points, depending on your preferred trading style.
When the PPMA line is trending upward, it may indicate a potential bullish trend. Conversely, a downward-trending PPMA line could suggest a bearish trend. The PPMA Indicator can be used in conjunction with other technical analysis tools to confirm potential trend changes and to establish entry or exit points for trades.
Conclusion
While the Volume-Weighted Pivot Point Moving Average (PPMA) Indicator may not be a game-changer, it is a modest yet helpful tool for traders looking to enhance their technical analysis. By incorporating volume into its calculations, the PPMA Indicator aims to provide more responsive signals compared to traditional moving averages. As with any trading tool, it is crucial to conduct your own analysis and combine multiple indicators before making any trading decisions.
MTFA - Multi Time Frame Analysis - Moving AveragesThis indicator will help you make better informed trading decisions by showing higher time frame moving averages overlaid on a single chart. You can customise 4 moving averages.