Candle IdentifierHello everyone its indicator Base on Candle/Bars formation Engulfing, Harami, Piercing Line, Morning Star , Evening Star, Belt, Three White Soldiers, Three Black Crows, 3 Stars South, Stick Sandwich, Meeting Line , Kicking, Ladder Bottom
How to work its indicator?
➤ There are many of bars formation first select according to you when Long or Short signal come
Indicator Feature
➤ Long Signal with Alert
➤ Short Long Signal with Alert
➤ Long side Take profit Calculated By Open Bar You Can Also Change Calculate Percent input
➤ Short side Take profit Calculated By Open Bar You Can Also Change Calculate Percent input
➤ Long side stoploss Calculated By Open Bar You Can Also Change Calculate Percent input
➤ Short side stoploss Calculated By Open Bar You Can Also Change Calculate Percent input
Important: This Indicator we are using for Automation Trading if You Want This Indicator Access, Please Contact me PM on Tradingview
Cerca negli script per "bar"

TraderLion Reversal BarsTraderLion Reversal Bars highlights key reversal bars for your technical analysis in a visual manner.
The script highlights Oops Up, Kicker, Three Bar Break, Upside Reversal, Power of 3, Outside Bullish/Bearish Days.
Default Settings: 3 Bar Break, Oops Up, Kicker
Oops Up - Price opens below prior day’s close and closes above. Concept by Larry Williams
Kicker - When the prior day closes down and the current day gaps above the entirety of yesterday’s action signaling a clear momentum change.
Three Bar Break - Price breaks above prior 3 closes and closes above on above-average volume.
Upside Reversal - Today’s price undercuts the prior day’s low but closes the day on a >= 50% closing range
Power of 3 - Power of 3 shows the strength and demand of stock to get through the 3 widely followed moving averages (10, 21, 50 daily moving averages)
Outside Bullish/Bearish Day - Price closes above/below the prior day’s high/low.
Each condition can be Alerted by right click a bar on the charts.
Suggestions? Comment below. Cheers!

Humble Bars Possible Correction ZonesPossible correction zones are calculated based on Humble Bars. Please check Humble Bars and Humble Bars Convergence Divergence indicators for more info.
Note that, these are meant to be correction zones, not turning points. If you take those as entry signals, you should remember, you are probably going against the trend.
Humble Bars
Humble Bars Convergence Divergence

Inside Bar FailureThis indicator provides a statistical report on the Inside Bar Failure candlestick pattern popularized by Trader Dante. Based on the chart's bars, it can improve your edge on any markets and timeframes.
The Inside Bar Failure pattern refers to an Inside Bar breakout that failed to sustain momemtum and closed back within it.
The report is broken down into the different following sections: retracement , invalidation , continuation and breakout .
Each of them provides hindsights about the pattern price behavior and brings answers to questions such as: How often does price retrace? Does the pattern often invalidate? If it doesn't then does it break in the pattern's direction? How far does price go? What are the odds of a false breakout?
While there are many ways to make use of the metrics, my favorite use case is for developing directional and daily/weekly biases while refining my stop/entry/target positioning.
Miscellaneous
Highlights patterns on the chart;
Supports bar to bar analysis and replay functionalities;
Provides counts on the `Data Window` panel for debugging or computing your own metrics;
Settings
Show/hide for toggling different sections;
Report coloring and offset on the x axis;
Gaining Access
This is a private indicator and is available only for my Patrons. You can reach my Patreon page below from the link in my signature.

[blackcat] L1 Close Histogram OscillatorLevel: 1
Background
A histogram is a special chart that is applied to statistical data that is divided into numerically ordered groups. For example groups with close relationships in the vicinity like "Close-ref(Close ,1)", "Close-ref(Close,2)" and so on. A histogram provides a snapshot of all the data so that you can quickly get an overview of the historical data, especially its general shape.In a histogram, the bars are linked - in contrast to a bar chart for categorical data, in which the bars represent categories that are in no particular order and are separated. The height of each bar in a histogram indicates either the number of individuals (called the frequency) in each group or the percentage of individuals (the relative frequency) in each group. Each individual in the data set falls into exactly one bar.
Function
L2 Close Histogram Oscillator is a novel overbought and oversold indicator that estimate the trend state by counting a specific bar relationship nearby. Once nearby bars reach consensus, it may spread to global quickly. The reason why I got this inspiration is because I have been engaged in the research of blockchain consensus mechanism. The market is a complex system, and its consensus depends on the common human characteristics: greed and fear. The trend of the market often also conforms to sociological characteristics. Maybe it's a bit complicated for me to say that. However, if you understand the principle of the spread of rumors and viruses, you can understand the situation where some individuals in the market have local consensus and gradually spread to the overall situation. This is the process of trend formation.
Key Signal
fastcounter --> fast close histogram counters
slowcounter --> slow close histogram counters
attention --> bottom price appears, with height of 10 in white
readybuy --> a small position buy opportunity after first bottom detected, with height of 20 in yellow
buylow --> a small position buy at low price, with height of 30 in lime
longentry --> a confirmed long entry signal by close histogram counter, with height of 40 in green
risk --> oscillator top is reached and trend reversal may happen, with height drop from 100 to 80 in red
Pros and Cons
Pros:
1. since this is based on consensus formation principle, i think this is a leading indicator by spreading local consensus to global
2. it is an oscillator, overbought and oversold can be easily observed.
Cons:
1. the model is not complex enough to depict market behavior exactly.
2. sideways and chop market will make this indicator's output hard to read.
Remarks
This is rare! I combined my previous theory of developing cellular automata with the market to produce such a weird indicator. I hope to inspire everyone and study market behavior in a deeper level.
Readme
In real life, I am a prolific inventor. I have successfully applied for more than 60 international and regional patents in the past 12 years. But in the past two years or so, I have tried to transfer my creativity to the development of trading strategies. Tradingview is the ideal platform for me. I am selecting and contributing some of the hundreds of scripts to publish in Tradingview community. Welcome everyone to interact with me to discuss these interesting pine scripts.
The scripts posted are categorized into 5 levels according to my efforts or manhours put into these works.
Level 1 : interesting script snippets or distinctive improvement from classic indicators or strategy. Level 1 scripts can usually appear in more complex indicators as a function module or element.
Level 2 : composite indicator/strategy. By selecting or combining several independent or dependent functions or sub indicators in proper way, the composite script exhibits a resonance phenomenon which can filter out noise or fake trading signal to enhance trading confidence level.
Level 3 : comprehensive indicator/strategy. They are simple trading systems based on my strategies. They are commonly containing several or all of entry signal, close signal, stop loss, take profit, re-entry, risk management, and position sizing techniques. Even some interesting fundamental and mass psychological aspects are incorporated.
Level 4 : script snippets or functions that do not disclose source code. Interesting element that can reveal market laws and work as raw material for indicators and strategies. If you find Level 1~2 scripts are helpful, Level 4 is a private version that took me far more efforts to develop.
Level 5 : indicator/strategy that do not disclose source code. private version of Level 3 script with my accumulated script processing skills or a large number of custom functions. I had a private function library built in past two years. Level 5 scripts use many of them to achieve private trading strategy.

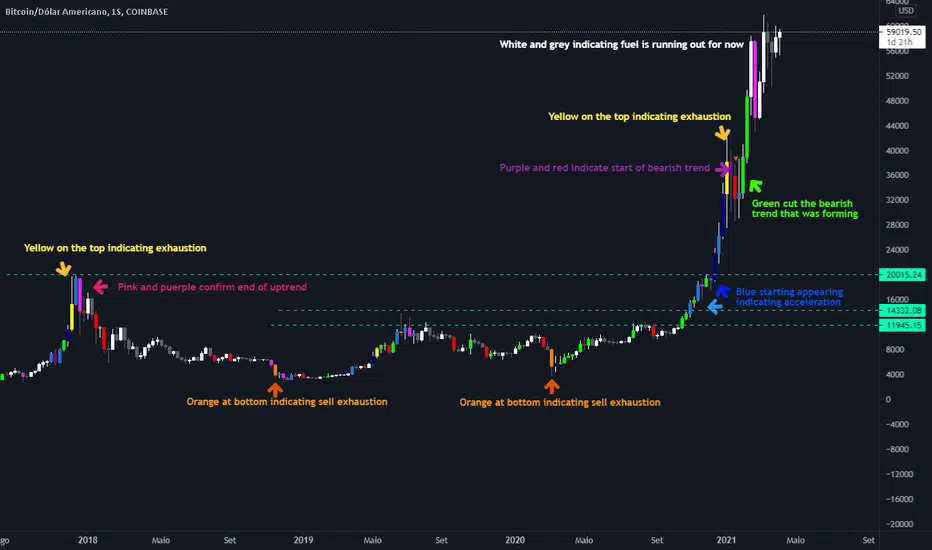
Slim Ribbon Volume BarsThe Slim Ribbon Volume Bars indicator is intended to be paired with the Slim Ribbon. The Slim Ribbon is also available for free in TradingView. The Slim Ribbon Volume Bars indicator changes the color of the volume bars based on the momentum condition of the Slim Ribbon. When the Ribbons have a bullish condition, the indicator colors the volume bars green. When the Ribbons have a bearish condition, the indicator colors the volume bars red. Finally, when the Ribbons have a neutral condition, the indicator colors the volume bars gray. See below for an overview of the Slim Ribbon.
The Slim Ribbon was developed by Steve Miller. Steve Miller is a 46-year veteran stock, futures and options trader. His badge on the trading floor was his initials, “SLM” and has since gone by the nickname Slim.
The Slim Ribbon is a momentum indicator . It is composed of 3 exponential moving averages (8, 13 and 21). A bullish condition occurs when the 8 period MA is above the 13 period MA and the 13 period MA is above the 21 period MA. A bearish condition occurs when the 8 period MA is below the 13 period MA and the 13 period MA is below the 21 period MA. A neutral condition occurs when the Ribbons are not in alignment.
The Slim Ribbon also notifies you when we transition from one condition to another. A green up arrow indicates that the Slim Ribbon has shifted from a neutral condition to a bullish condition. A red down arrow indicates that the Slim Ribbon has shifted from a neutral condition to a bearish condition. A blue up arrow indicates that we have shifted from a bearish condition to a neutral condition. Lastly, a blue down arrow indicates that we have shifted from a bullish condition to a neutral condition.
We would recommend using the Slim Ribbon on a candlestick chart. Steve Miller believes in the importance of visualizing trends. As a result, we have designed the Slim Ribbon to change the color of the candlesticks based on the condition of the ribbon. When the Slim Ribbon has a bullish condition, the candlesticks will turn green. When the Slim Ribbon has a bearish condition, the candlesticks will turn red. When the Slim Ribbon has a neutral condition, the candlesticks will turn gray.

Auto Squeeze Breakout BarsThe Auto Squeeze Breakout Bars find bars that are breaking out of a low volatility environment into a high volatility environment.
The Squeeze shading is signaled when the volatility of the asset is very low. Then the Squeeze Breakout Bars are signaled when the asset is breaking out of this low volatility structure.
Warning bars will be signaled when it is approaching a breakout, but the conditions are not fully met at that very time.
The Auto Squeeze Breakout Bar indicator also has a built in stop loss mechanic that can be set to your preferred limit.
Stop losses are highly recommended when using the breakout bars because of possible head fakes. They are rare, but can occur depending on the asset you are trading.
For Access or Questions: Private message us. Thank you.

Volume Based Color Bar (VBCB)Português/English
Pt:
Esse indicador colore as barras ou candles de acordo com o volume de negociação daquela barra em comparação ao volume médio. A codificação é a seguinte:
Barras de alta (Fechamento>Abertura):
- Cor da barra por default: Sem volume expressivo
- Verde: volume acima da Média.
- Azul: volume bem acima da média.
- Amarelo: volume muito acima da média.
Barras de baixa (FechamentoOpen):
- Bar color by default: No expressive volume
- Green: volume above average.
- Blue: volume well above average.
- Yellow: volume way above average.
Bearish bars (Close
Inside Reversal Engulfing BarInside bar bullish = yellow
Inside Bar bearish = orange
engulfing bar bullish = green
engulfing bar bearish = red
reversal bar bullish = blue
reversal bar bearish = purple

SadLittleThings Price Compare With Offset MTF by RRBSadLittleThings Price Compare With Offset MTF by RagingRocketBull 2018
Version 1.0
This indicator lets you compare multiple assets across different timeframes, supports offsets and alpha multipliers.
Standard TradingView Compare doesn't have Offset/Timeframe/Multiplier options, hence this indicator.
Features:
- compare current asset's price with 2 custom ext OHLC sources
- plot sources as lines/bars/candles
- use offset:
- for lines - both positive/negative offsets, unlimited
- for bars/candles - only positive offsets <= 5000
- specify timeframe for each source
- uses timeframe textbox instead of input resolution dropdown to allow for 240 120 and other custom TFs
- support for timeframes in H: H, 2H, 4H etc
- show/hide sources
- colorize sources
- convert source price to 1000s, mlns, or blns using alpha multiplier
- total bars counter
Notes on using offsets:
- Max offset is defined by study max_bars_back which is limited to 5000 for free accounts. This variable specifies the number of history bars an indicator can access.
- if you see the 'internal server study error' => one of the indexes of ohlc series is out of bounds (i.e. close ) => decrease the offset <= 5000 or switch to line type
- you will be limited only by the total number of bars in history (n) +/- 1 full screen of empty bars
- you can't scroll past the beginning of history - 1 empty screen and past the end of history + 1 empty screen to be able to still see the line with applied offset
- before applying a large offset, scroll back long enough to make sure you have enough history loaded
- if you have a long history the indicator will get slower, its UI less responsive. Reloading the page may fix that.
- you will not see source's history past the beginning of the current asset - open the chart with the longest history first (i.e. BLX, not COINBASE)
- Make sure that the Left Price Scale shows up with Auto Fit Data enabled. You can reattach the indicator to a different scale in Style.
- you may not be able to plot intraday TFs < current TF, because free accounts are limited to TFs >= D1 (i.e. D, 2D, 3D, W), but you can still plot, say, H4+ on a lower TF H1 chart
1. uses plot*, security, change

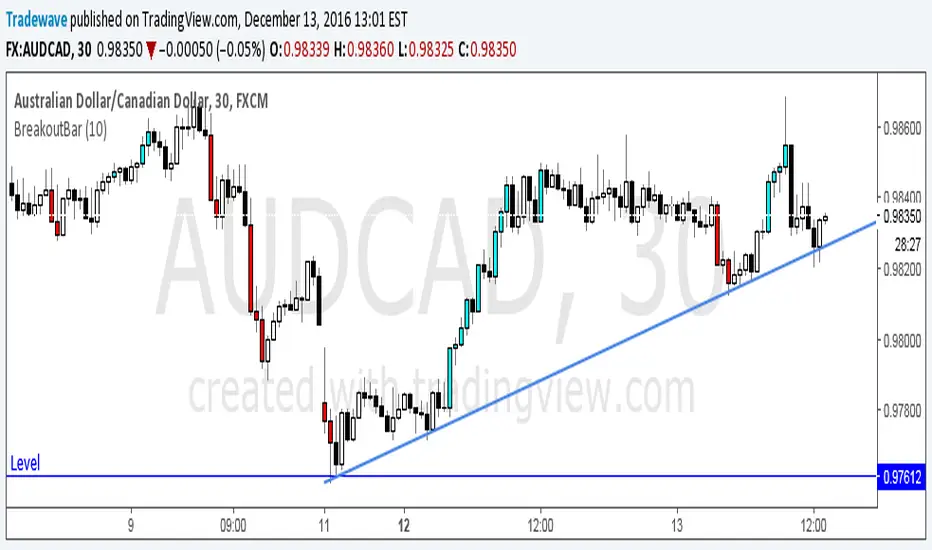
Two Bar Break Line Alerts R1.0 by JustUncleLThis indicator with default settings is designed for BINARY OPTIONS trading. The indicator can also be used for Forex trading with some setting changes. The script shows Two Bar Pullback Break lines and alerts when those Break lines are Touched (broken) creating a short term momentum entry condition.
For a Bullish Break (Green Up Arrow) to occur: first must have two (or three) consecutive bear (red) candles which is followed by a bull (green) candle creating a pivot point. The breakout occurs then the High of the current Bull (green) exceeds the highest point of the previous two (or three) pivotal bear candles. The green channel Line shows where the current Bullish BreakOut occurs.
For a Bearish Break (Red Down Arrow) to occur: first must have two (or three) consecutive bull (green) candles which is followed by a bear (red) candle creating a pivot point. The breakout occurs when the Low of the current Bear (red) drops below the lowest point of the previous two (or three) pivotal Bull candles. The red channel Line shows where the current Bearish BreakOut occurs.
The break Line Arrows can optionally be filtered by the Coloured MA (enabled by default), a longer term directional MA (disabled by default) and/or a MACD condition (enabled by default) as a momentum filter.
You can optionally select three Bar break lines instead of two. The three bar break lines are actually equivalent to Guppy's Three Bar Count Back Line method for trade entries (see Guppy's video reference below).
Included in this indicator is an ability to display some basic Binary Option statistics, when enabled (enabled by default) it shows Successful Bars in Yellow and failed Bars in Black and the last Nine numbers on the script title line represent the Binary option Statistics in order:
%ITM rate
Total orders
Successful Orders
Failed Orders
Total candles tested
Candles per Day
Trades per Day
Max Consecutive Wins
Max Consecutive Losses
You can start the Binary Option statistics from a specific Date, which is handy for checking more recent history.
HINTS:
BINARY OPTIONS trading: use 5min, 15m, 1hr or even Daily charts. Trade after the price touches one of the Breakout lines and the Arrow first appears. Wait for the price to come back from Break Line by 1 or 2 pips, the alert arrow must stay on and candle change to black, then take Binary trade expiry End of Candle. If price pull back and arrow turns off, don't trade this candle, move on you probably don't have momentum, there will be plenty of other trigger events. The backtesting results are good with ITM rates 65% to 72% on many currency pairs, commodities and indices. Realtime trading has confirmed the backtesting results and they could even be bettered, provided you are selective on which signals to trade (strong MACD support etc), that you are patient and disciplined to this trading method.
FOREX trading: the default settings should work with scalping. For longer term trades try with settings change to a more standard MACD filter or slower to catch the longer term momentum swings and the idea would be to trade the first Break Line alert that occurs after a decent Pullback in the direction of the trend. Setting the SL to just above/below the Pivot High/Low and set target to two or three times SL.
References:
"Fundamentals of Price Action Trading for Forex, Stocks, Options and Futures" video:
www.youtube.com
Other videos by "basecamptrading" on Naked Trading.
"Taking Profits in Today's Market by Daryl Guppy" video:
www.youtube.com

CryptoVN - Price Action Bars and Fractal v2*Mod version from "CM_Price-Action-Bars by ChrisMoody" and "Fractal Support Resistance (Fixed Volume) 2" by synapticEx.
v2:
- Fix some bug
- Allow On/Off Fractal Support & Resistance Levels on chart.
(*)Price Action Bars:
- Yellow = Inside Bar – Breakout Patterns
- Orange = Outside Bar – Breakout Patterns
- Green/Red = Pin Bars
- Aqua/Fuchsia = Shaved Bars
(*) Fractal Support/Resistance on current chart.
(*)My Advice to You:
- The Trend Is Your Friend. TRADE WHAT YOU SEE, NOT WHAT YOU THINK.
Good luck. Happy Trading Life ^^!
-- Notes: for this indicator work, you must set the Candles color look like this:

TH Pin Bars Marker IndicatorMarks Pin Bars with a small yellow triangle. Bullish Pin Bars have a marker below and bearish Pin Bars have a marker above. You can set the percentage of the wick to define a Pin Bar, as well as the number of previous candles that have to be higher (bearish Pin Bar) or lower (bullish Pin Bar) than the Pin Bar.

Breakout BarThe following script colors breakout bars.
The user can specify the look back period.
If current close is highest of the past n bars it will color the bar light blue.
If current close is lowest of the past n bars it will color the bar red.
All other bars are black for down bars and white for up bars.
SMI BarsUses SMI (Stochastic Momentum Index) to set bar colors:
When SMI above overbought, bar color is red.
When SMI is between 0 and overbought, bar color is maroon
When SMI is between oversold and 0, bar color is green
When SMI is below oversold, bar color is lime.
When SMI crosses above or below 0, bar color is orange.

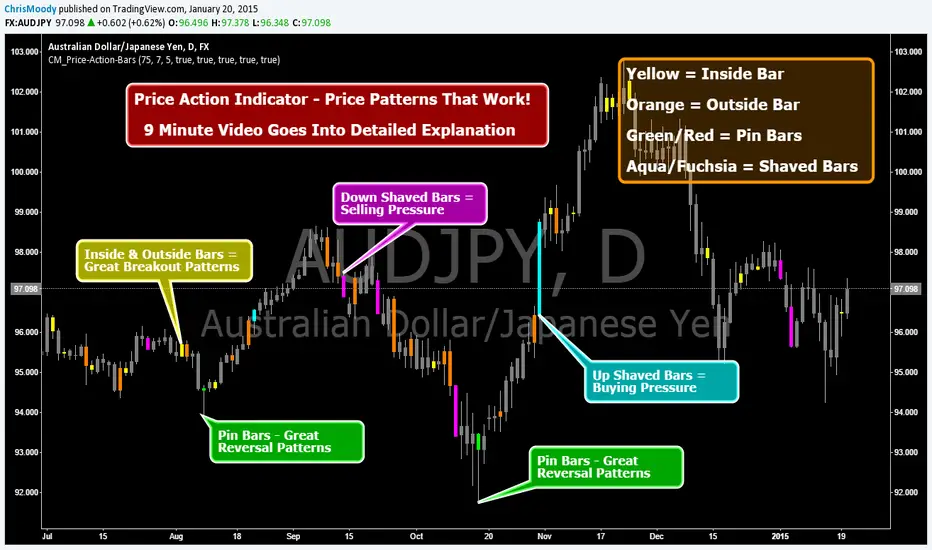
CM_Price-Action-Bars-Price Patterns That Work!Price Action Indicator - Price Patterns That Work!
9 Minute Video Goes Into Detailed Explanation
4 Simple but Effective Price Patterns!
Yellow = Inside Bar – Breakout Patterns
Orange = Outside Bar – Breakout Patterns
Green/Red = Pin Bars
Aqua/Fuchsia = Shaved Bars
***MANY Features and Customizing Options…Detailed Overview In Video.
How To Turn Bars Patterns On And Off.
Ways To Customize.
General Thought Process of the 4 Price Action Patterns.
What Each Setting in the Inputs Tab Does.
***Special Announcement. Video Below Just Updated. Received a Special Promotion from the creator of these Price Action Bars and Many other Price Action Setups. Hedge Fund Manager and Founder of 2ndSkiesForex.com Chris Capre.
1st 10 minutes of Video is covering throughout process and how to implement the Indicators.
2nd 12 minutes covers a Special Promotion offered to TradingView members directly from Chris Capre.
Video Link Below.
vimeopro.com
This Version of the video will be taken down 2/01/2015 and the original video will be uploaded again.
Vol color barsHighlight bars according it's volume releative to near candles. This script usefull for VSA trading.
Red bar - extrime high volume
Orange bar - volume is high
Grayish bar - volume is normal
Green bar - volume is low
Blue bar - almost no volume

Colored Volume Bars [LazyBear]Edgar Kraut proposed this simple colored volume bars strategy for swing trading.
This is how the colors are determined:
- If today’s closing price and volume are greater than 'n' days ago, color today’s volume bar green.
- If today’s closing price is greater than 'n' days ago but volume is not, color today’s volume bar blue.
- Similarly, if today’s closing price and volume is less than 'n' days ago, color today’s volume bar orange.
- If today’s closing price is less than 'n' days ago but volume is not, color today’s volume bar red.
Buy the green or blue volume bars, use a 1% trailing stop, and stand aside on red or orange bars.
As you see, this is more for entry confirmation. I have not tested this on any instrument.
You may have to tune the lookback period for your instrument. Default is 10.
More info:
"A color-based system for short-term trading" - www.traders.com
List of all my indicators:

BTC bar volume colorThis Pine Script indicator colors BTC price bars based on aggregated real trading volume from dozens of major spot and perpetual futures exchanges.
How it works briefly:
Collects and sums spot volume from ~20 exchanges
Collects and sums perp/futures volume from many platforms (with unit adjustments)
Computes a combined volume z-score over the last 100 bars
Scales the z-score into a range and maps it to transparency (higher volume → less transparent/more opaque bars)
Colors bars lime green for up candles and red for down candles
Result: Bars appear brighter and more solid on high-volume moves, fainter and more transparent on low-volume moves
Main purpose: Visually highlight genuine high-participation price action vs. low-conviction or "fake" moves on thin volume. Optional black background setting included.

4 Bar Sequential Counter (9 to 13) [DotGain]4-Bar Sequential Counter (Seq4)
This indicator identifies potential trend exhaustion phases using a strict sequential count
based on the relationship between the current closing price and the closing price four bars earlier.
How it works
• A bullish sequence is counted as long as the current close remains below the close from 4 bars ago.
• A bearish sequence is counted as long as the current close remains above the close from 4 bars ago.
• The count resets immediately if the respective condition is no longer met.
• The sequence counts up to a maximum of 13 , after which it resets and a new sequence may begin.
Visualization
• Only counts from 9 to 13 are displayed on the chart.
• Bullish sequences are plotted below price bars.
• Bearish sequences are plotted above price bars.
• The minimalist design keeps the chart clean and focused on potentially relevant exhaustion zones.
Interpretation
• A count of 9 may indicate an early sign of market overextension.
• A count of 13 represents a more advanced sequence and a higher probability
of consolidation or corrective price action.
• This indicator is not a standalone trading system and should be used in combination
with trend analysis, volume, and support/resistance levels.
Alerts
• Bullish sequence at 9
• Bullish sequence at 13
• Bearish sequence at 9
• Bearish sequence at 13
Disclaimer
This "4-Bar Sequential Counter (9–13)" (Seq4) indicator is provided for informational and educational purposes only. It does not, and should not be construed as, financial, investment, or trading advice.
This indicator is an independent implementation of a sequential counting method and is not affiliated with, or endorsed by any trademarked trading concepts or methodologies.
The signals generated by this tool (Green and Red) are the result of a specific set of algorithmic conditions. They are not a direct recommendation to buy or sell any asset.
All trading and investing in financial markets involves a substantial risk of loss. You can lose all of your invested capital.
Past performance does not guarantee future results.
This indicator highlights sequential price exhaustion patterns and may generate false, lagging, or incomplete signals. Markets can remain unpredictable longer than you can remain solvent.
The creator DotGain assumes no liability for any financial losses or damages you may incur, directly or indirectly, as a result of using this indicator or the information it provides.
You are solely responsible for your own trading and investment decisions. Always conduct your own research (DYOR), validate signals with other methods, and consider your personal risk tolerance before entering any trade.

Momentum Table View (Bar-Based)// NOTE:
// This script uses bar-based lookbacks instead of calendar months.
// Approximate conversions for daily charts:
// - 21 bars ≈ 1 month
// - 63 bars ≈ 3 months
// - 252 bars ≈ 1 year
// For other timeframes, adjust accordingly for different time periods and needs.
// For hourly I have it set at 24*5, 24*5*4 and then finally 24*5*4 to give the same,
// daily, weekly and monthly aggregate returns but on the hourly scale.
// Of course you can split it anyway you like as well depends on the expected needs you have.
Running idea so there will likely be revisions to the z scoring to possibly a different method and the atan angle represented in the code will also likely be changed at some point as to maybe a regression method. These changes will take time as this is only a secondary platform for me not the main source of data. In saying that the table has the data representing the log returns of an asset of n bars which I decided on over the original more accurate daily, weekly and monthly close points which the user can always specify using this method if wanting to be more accurate with the standard method of momentum returns factor.

EB/TB V24: Fixed Risk Trend-Following (Elephant Bar / Trend Bar)This is an advanced trend-following strategy built around the Elephant Bar (EB) and Trend Bar (TB) candle patterns. It uses a fixed dollar risk per trade to automatically size positions and employs a sophisticated exit management system, including partial profit taking, a dynamic Trailing Stop Loss (SL), and a 180° immediate reversal mechanism.
Detailed Description
This strategy is designed for active trend capture and robust risk management:
Fixed Risk Position Sizing: Automatically calculates trade quantity based on a defined maximum dollar risk (mlpt_max_risk) and the initial Stop Loss placement.
Trend Identification: Entries are triggered by confirmed Elephant Bars (strong momentum candles) or Trend Bars, filtered by two short-term MAs (MA #1, MA #2) and a long-term MA (MA #3 / MA200) for context.
Dual Exit Management:
Partial Take Profit (50%): Half the position is closed at a fixed profit target (tp_fixed_pct).
Dynamic Trailing SL (50%): The remaining 50% is protected by a Trailing SL that adjusts based on the low/high of subsequent valid EB/TB signals, maximizing trend ride duration.
Emergency Exits:
SAma Exit: Uses the crossing of the price below/above the MA #1 (short period) as a dynamic exit criterion.
180° Reversal: Features an immediate close (Cap8) and reverse (180) entry when a strong, unfiltered opposite raw EB signal appears.
Note: This published version only displays the Moving Averages, the entry signals, and the Take Profit lines for a clean chart view.

Physics Visualizer [RSI + Vol] bars ( educational Purpose only )This code is a TradingView Pine Script (Version 6) for a custom indicator named "Physics Visualizer ".
Here is a breakdown of what it does:
1. What It Is: It is a visual tool designed to show you the relationship between Price Momentum (RSI) and Volume (Fuel) in a single, easy-to-read panel. It tries to answer the question: "Is this price move supported by real volume, or is it fake?"
2. How It Works (The "Physics"): It calculates the "Slope" (direction) of both the RSI and Volume over a short period (3 bars).
Explosion (Lime Green): RSI is going UP + Volume is going UP. This is a strong, healthy move.
Fakeout (Orange): RSI is going UP (Price rising) + Volume is going DOWN. This warns of a weak move that might reverse.
Churn (Maroon): RSI is going DOWN (Price falling) + Volume is going UP. This suggests heavy selling or absorption (fighting).
3. Visuals: It draws a "Bar in Bar" chart:
Background (Gray Bar): Represents the Volume (scaled 0-100). Wide and transparent.
Foreground (Colored Stick): Represents the RSI (Momentum). Thin and colored based on the "Physics State" (Green/Orange/Maroon).
Can we use it as a confirmation? Yes. This is an excellent confirmation tool.
Rule: Only take a Buy signal from your main strategy if this indicator shows a Lime Green (Explosion) bar,
