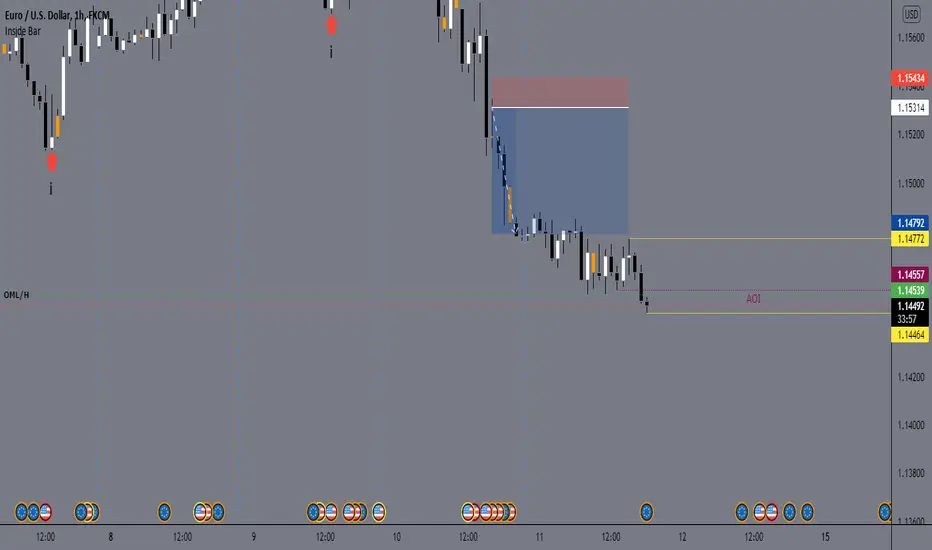
Inside Breakout - inside bar - PerQuantumCoin Premium IndicatorHOW IT WORKS:
- The Inside Breakout gives signals on the chart on the breakout of inside bar chart pattern;
- It allows to trade trend or counter-trend signals;
- Computes intrinsic values to access the strength of the Buy/Sell signal;
- Allows users to adjust their own settings, adapting the signals produced;
- These signals can be also set up as Alerts;
- The indicator has a few custom features that allows users to filter out signals using multi-timeframe trend indicator and to keep tracking positions so that one can only get new signals when they reserve position;
This Script is meant to help traders easily identify great entry opportunities.
The Script does NOT repaint signals.
Cerca negli script per "bar"

Intraday Bar CountingAs a day-trader, revising is the most important habit.
This script adds numbers on intraday bars to help you revise and analyze patterns and your entries/exits. Great help!

MACD Bar 1.0 [upslidedown]MACD is one of the most consistent ways a trader can determine overall trend direction. In this script, I've simplified the traditional MACD histogram into a compact bar with trend change shapes (▲▼) when the MACD histogram goes under the zero line or above the zero line. With traditional MACD I often have to zoom in, wasting precious time. This indicator fixes that problem.
I use this script as a confirmation for other trigger signals, not as an entry or exit signal. I find this compact widget to be a preferable visualization of MACD on lower timeframes, while high timeframe analysis lends itself to the traditional MACD built-in with more data for decision making. This is also very useful when crafting trading strategies to quickly check for confluence of signals.
In addition to the traditional EMA smoothing that comes with MACD, I exposed a series of common moving average types. These include: SMA, EMA, WMA, RMA, SWMA, VWMA, Hull, TEMA, and ZLEMA. TEMA and ZLEMA are not standard builtins, but when looking for fast confirmation they can be very useful. They can also create LOTS of noise, so consider this wisely before changing the builtin methodology. One neat trick is to pair a "fast" version of this with fast moving average type and then a slow one using traditional EMA.
▲▼ signals = trend shift in direction of triangle
full color "bull or bear" color = strong trend
half color (semi-transparent) "bull or bear" color = weakening trend

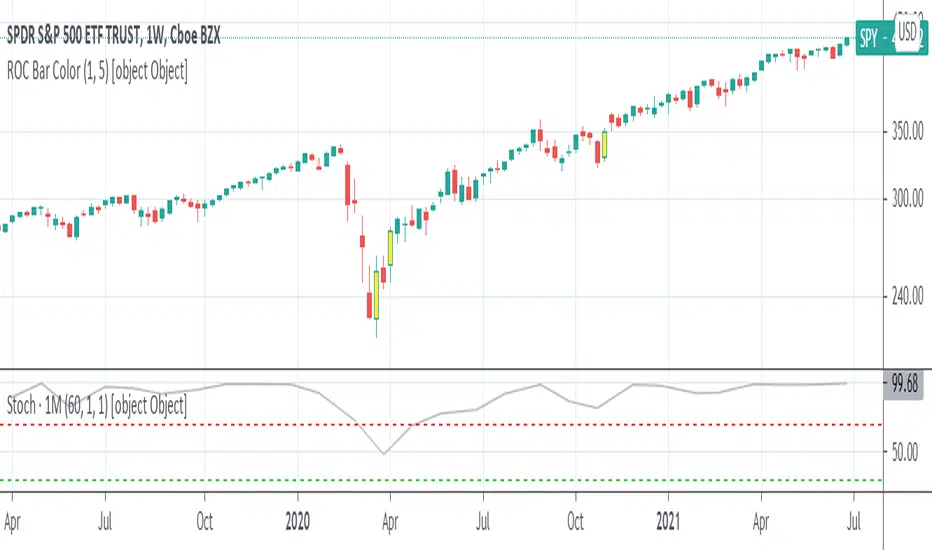
SMI Ergodic Indicator Bar ColorsThis script simply displays bar colors corresponding to the SMI Ergodic Indicator. It does not display the oscillator or indicator itself. I prefer not to crowd my display with too many oscillators - others may find this script useful as well. Used in conjunction with other indicators, the SMII can give early reversal signals.
Thanks to the TV community.

Heikin Ashi Bar OverlayThis script shows Heikin Ashi bars on your chart with specified vertical offset
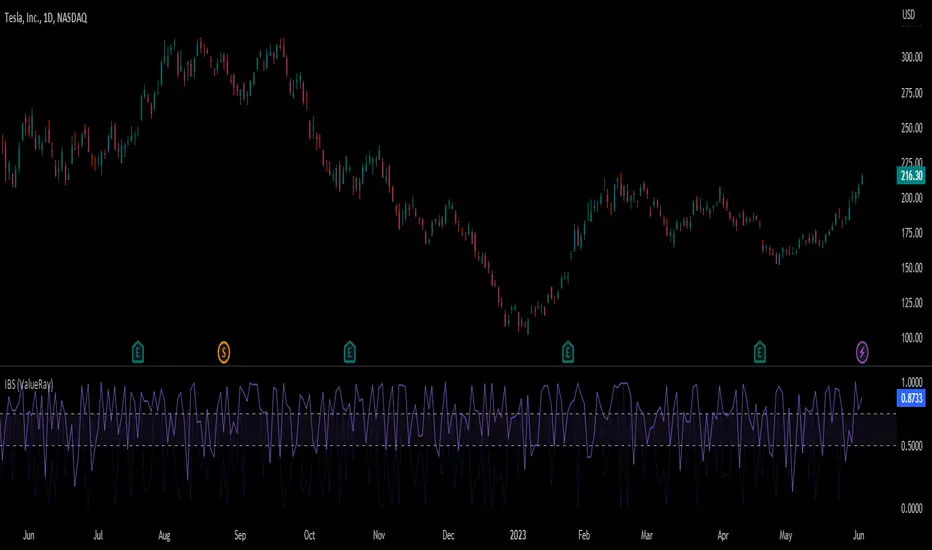
Internal Bar Strength (ValueRay)The IBS (Internal Bar Strength) as we know it, calculates only correctly on the long side. When the candle closes in loss, the original IBS still uses the upper wick.
This IBS checks first if its an up or down candle and then uses the top or bottom wick to calculate the IBS.
The yellow line is the corrected IBS, the blue line the original
Volume Bar Breakout and Breakdown IndicatorVolume shows strength of a movement and highest volume shows the region that pushed price to certain extent with full strength. Breakout or Breakout of the highest volume bar range shows continuity further push by sellers or buyers indicating a trend continuation for a small period if not for long duration. Entries can be taken once signal is generated with stoploss as recommended.
Guidelines:
Don't trade if range is too large
Don't trade if Breakdown or Breakdown candle body / range is too large or if there is high volatility
Use additional indicator to get the idea of overall trend analysis

Swing Dream - PAINT BARS | MA | EMA | DMA | VWAP | TABLE | ADR %- Swing Dream -
Script created for breakout-swing traders, in the style of QullaMaggie * , Dan Zanger, Oliver Kell, and Stockbee.
The following indicators are used by most successful breakout-swing traders such as mentioned above.
(As published) it contains:
Painted Bars, also known as inside/outside candles. Used for candle analysis and to determine breakout pivots & levels. For instance; use it in different timeframes and seek formations (ex, 3-1-2). For further inspiration, study Rob Smith's The Strat .
MA, Simple Moving Averages (Basic levels = 10,20,50,200). Use this indicator to define resistance/support areas as well as the overall long/swing-term trend. In breakout strategies such as EP, Flags, etc this can be used for trailing stops; an example, post-breakout, let the price ride the 20ma before exiting your position.
EMA, Exponential Moving Averages with periods inspired by Qullamaggie (10,20,65). Use this on shorter timeframes (ex, 1h) and for the same principles as MAs.
VWAP, Volume-Weighted Average Price. As for the previous, utilize this as a level indicator to find areas of resistance/support. Good for swing-trading as it implies whenever holders are profitable or not.
DMA, Displaced Moving Average (Horizontal). Personally, I use this a lot. Works very well for trailing stops (post breakout) and "bounce" areas. Choose your own offset and period.
ADR%, Average Daily Range Percentage. Displayed in the table and used to define a symbol's volatility. A very good tool for Qullamaggie-style trading. Personally, I try to find setups with over 6% ADR. Basic definition; low ADR% = Increased chance of a symbol to move slower and in smaller ranges. A higher value equals the opposite.
Table. A table with basic symbol-related information. Could save you plenty of time whenever you scan or search for new swing setups. Looking to add more features here.
Why should you use this script? Well, instead of having tens of different indicators, use this script and combine everything together with EP, Flag, or breakout principles. Suited for every plan, and more efficient in my opinion.
View settings to turn on/off different indicators.
* If you're looking for an introduction and further explanation of how Qullamaggie uses mentioned indicators, I could recommend checking out his website, stream, or participation in "Chat With Traders".
At last, I want to credit: @jkcqld @neolao @TheScrutiniser
This Script will get updated and improved.
// TechFille006

MACD Bar & BG Histo Original Source Code of trading view used
Bar color and background change added as per histogram for better trend change understand

Plot Real Open and Close - SamXI built this indicator as a personal request from a friend. He often trades using Heiken Ashi charts, but wanted a way to easily cross-reference real-price open and close values for the same timeframe on the same chart (as HA candles are by design lagging, they can take a few periods to catch up to a large move). This can also be used to help guide support and resistance zones using real-price data points should you so choose.
There are 2 major ways to configure this indicator to display real-price open and close:
As a Bar or Hollow Candle style chart overlay
As on-chart shapes (allowing individual control over which data to show - open, close, or both)

Session's First Bar RangeFirst Bar is crucial when there is gap up or gap down opening. It is recommended to use 15m Timeframe for better use.
Crossing this range signifies the absorption of existing buyers/sellers in the opening session and sometimes decide the trend onwards.

VPBar‴ | Volume & Volatility Power Bar‴What does it do?
Draws the volume demand into the candlestick in order for you to identify the volume power in during candle formation.
How does it work?
Super easy. It's not too obvious how the volume power affects the market movement by just looking at the volume bars. This indicator transfere to the candlesticks the volume power demand which helps the trader understand the more/less probability of the market moving foward or reverting.
What's my filling?
Gives you a quick perception of the lastes market demand over the market movement. It makes total sence seeing the volume in such a very obvious format.
Indicator features:
- Volume Power (1): green and red gradient volume power (5 green gradients and 5 red gradients)
- Volume Power (2): market standard gradient for positive and negative candles (only 5 colors for both market directions - doesn't help allot, reason why I created this indicator)
- Trend Color Bar: let the candlesticks show you the trend and its reversal
- Momentum Power: besides to the above features, you can add a momentum power indicator with arrow and/or moving average lines crossing
To have access to this indicator, please DM me.
Don't contact me in the comment area.

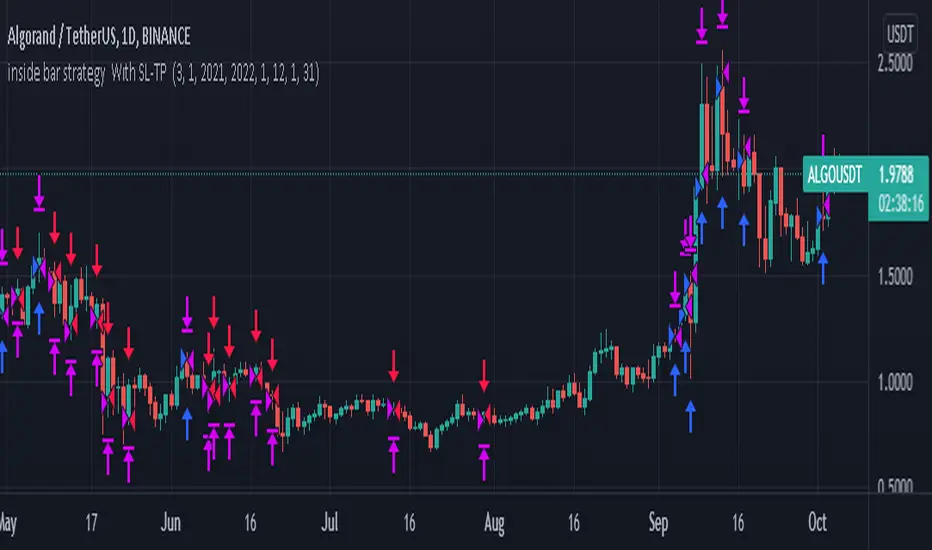
inside bar strategy Wıth SL-TP Based on strat bars to enter trades, you can use it with very low stop loss level and try all coins in daily frequency
Jerry Romine TS BAR (PE Ratio, % Change, ATR, TS, Volume, NIM)We are excited to introduce our TradingView Bar which gives you a quick read of the stock, index, or cryptocurrency at a glance. The PE ratio helps you quickly categorize the security. Percentage of change helps you quickly assess if the stock is trending up (lots of green) or down (lots of red). The ATR (Average True Range) expresses the volatility of the stock and is used to determine the recommended trail stop. Volume Percent compares the last 3 trading days to the previous 30. And the Net Income Margin helps you quickly assess the stocks profitability.
The indicator components are:
Price to Earnings Ratio
Price Performance over time( 1 week, 1, month, 2 months 3 months, 6 months, 1 year, 2 years)
ATR (volatility indicator). Shown as a dollar and %
Recommended Trail Stop (Based on ATR multiple)
Volume Percent
Dividend Yield (stocks only)
Net Income Margin (stocks only)
* The Trail Stop and Volume indicator can be easily adjusted in the settings.
Please Use the link below for more information or to purchase.

Wide BarsSimple scripts show the wide range bars within in the look back period, visualizing the bigger momentum.
Added four exponential moving averages which define the trend of the instrument.
Wide range candles in the direction of overall trend on higher timeframes; give confluence of higher participation in the same direction.
Note : Decent volume above the average volume with wide range candle adds more value.

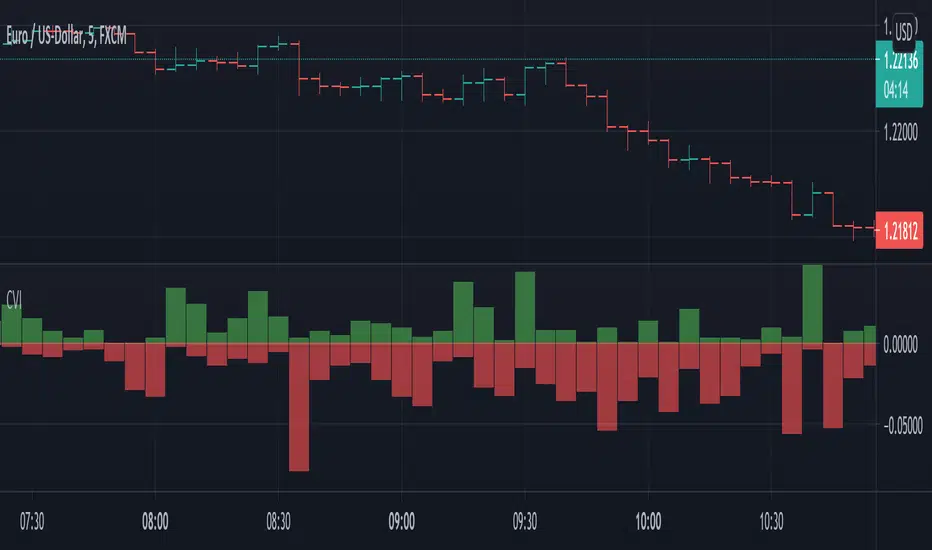
Candle Volatilty IndicatorThis script helps to get a better view on the volatility of the price.
Each bar represents the high and low of the candle calculated derived from the open price.
It can help to get an insight on the volatility .
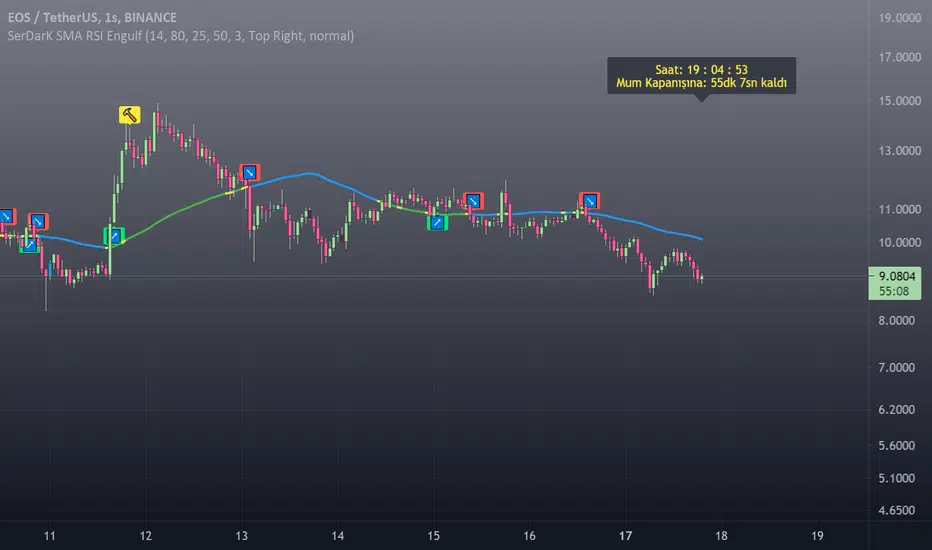
[SerDarK] SMA RSI Engulfing BarENG: This indicator includes the SMA line colored according to the price position, the RSI to identify the bearish or the bullish points, the Engulfing bars, the clock and the information panel showing the countdown to the candle closing.
SMA: default period is set to 50. It can change from the settings.
Definition of SMA line default colors: When the price is below the SMA line, its color is blue. It is green when the price is above the SMA line. It is yellow in RSI alerts and when the price hits the SMA line.
RSI: default period 14 is set. It can be changed in the settings.
🔨 Hammer Emoji: RSI is located at the overbought turnaround point. This sign does not mean that the trend will definitely return.
🚀Rocket Emoji: Tries to catch the "RSI oversold point turn".This sign does not mean that the trend will definitely return.
↗️↘️Up and Down arrows emojis. After the price crosses the SMA line, it indicates that it is closing a candle in that direction.
Engulfing candles: bullish engulfing candle is blue color. Bear engulfing candle is black in color.colors can be changed in settings.
Note that this indicator is only an indicator. It does not give advice on buying or selling.
Enjoy
TUR: Bu indikatör, fiyat konumuna göre renklendirilmiş SMA çizgisi, RSI ile düşüş veya yükseliş noktalarını belirleme, Engulfing (Yutan) barlar , saat ve mum kapanışı için geri sayım gösteren bilgi paneli içermektedir.
SMA: varsayılan periyodu 50 ayarlıdır. Ayarlardan değiştirebilir.
SMA çizgisi varsayılan renklerinin tanımı: Fiyat SMA çizgisi altında iken rengi mavidir. Fiyat SMA çizgisi üstünde iken yeşildir. RSI uyarılarında ve fiyat SMA çizgisine temas ettiğinde sarı renktedir.
RSI: varsayılan periyodu 14 ayarlanmıştır. Ayarlardan değiştirilebilir.
🔨 Çekiç Emojisi: RSI aşırı alım dönüş noktasında bulunur. Bu işaret trendin kesin döneceği anlamına gelmez.
🚀Roket Emojisi: "RSI aşırı satım noktası dönüşünü "yakalamaya çalışır. Bu işaret trendin kesin döneceği anlamına gelmez.
↗️↘️Yukarı ve Aşağı yönlü okl emojileri. Fiyat SMA çizgisini kestikten sonra, o yönde mum kapattığını gösterir.
Engulfing mumları: bullish engulfing (yutan boğa) mumu mavi renktir. Bear engulfing (yutan ayı) mumu siyah renktir. Renkler ayarlardan değiştirilebilir.
Not: Bu indikatörün yalnızca gösterge olduğunu unutmayın. Alma satma tavsiyesi vermez.
Kalan süre etiketi BIST gibi sınırlı süreli sembollerde, gün ve daha üstü periyotlarda doğru çalışmayabiliyor.

The Last 5N Bars HLI made this script to watch the market on the timely manner.
Always set up per day and week.
- 1 hour chart 24, 4 hour chart 6, 15 min chart 96, etc
- Keep eyes on the similar bars on the same hour every day. As big players have regular working time every day.
- Labels ' position can show a trend

Bollinger Bands Bar ColoringThis is a simple script that colors bars/candles based on where price is relative to the basis, and the upper and lower bands of the Bollinger Bands.
If price is above the basis, candles will be colored green, and if price is below the basis, candles will be colored red.
If price is outside of the bands on either side, the candles will be colored a darker shade of either color depending on if it is above or below.
I created this indicator because I like that at a glance I can have an idea of the bullishness or bearishness of price action based on the Bollinger Bands, without actually having the Bands overlayed on my charts.
It's also quite nice because I find that the areas where there is a shift in candle color (especially from green to red and vice versa) aid in identifying levels of support and resistance, and shifts in market structure.
I have another indicator that is a huge modification of the Bollinger Bands %B, which includes the candle coloring (and MAs), but this frees up space on my chart while still providing me with the primary information I'm looking for.
