Equivolume Overlay - Volume BarsThis is an addon for displaying volume bars along with Equivolume bars which can be found here
Cerca negli script per "bar"

Inside BarColor codes inside bars/candles on the chart. Either the bar can be coloured and/or a dot appears above the bar

Price-Action-BarsThis script came as a discussion in our community forum.
It paints
1. Pin Bars (Bottom or Top)
2. inside/outside Bar
3. Bullish Bottom bar
It also has the ability to add alerts on your favorite stocks

B3_HH_LL_Break Bar PainterThis is a simple Highest High or Lowest Low Breakout Painter.
Defaults in the order that they may color bars - checks top color first:
where n = your input length
BLACK = Outside Bar HHLL(n)
RED = Lower Low LL(n)
GREEN = Higher High HH(n)
BLUE = Inside Bar HHLL(n)
You may customize the colors in the indicator's settings-cogwheel on the chart.
Enjoy!
d^.^b

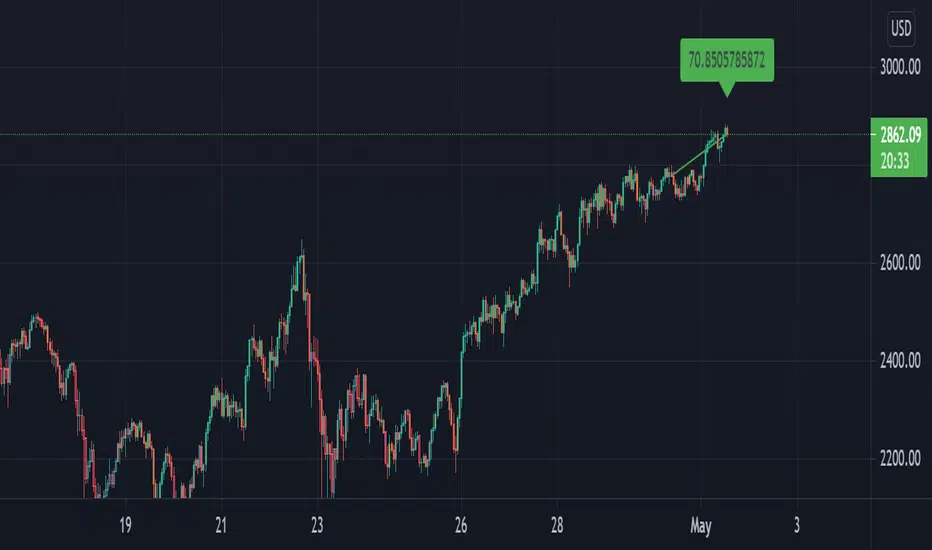
Difference over barsDescription:
One of my followers asked about an indicator that shows the difference between the open and a previous close and didn't find one so I wrote this one. This is similar to a momentum indicator except it offers more flexibility. While the standard momentum indicator calculates a difference between current close and a previous close (sometimes customizable to work on open, high or lows instead of close), this allows to mix and match between open, high, low and close. It also offers multiple kinds of moving averages.
Settings:
Current point of reference
Previous point of reference
Difference over how many bars?
How it works:
The indicator calculates the difference between the current point of reference and a previous (n-bars back) point of reference (where n is given by the "Difference over how many bars?").
How to use it:
find historical support lines like the 0.68 line in the cart above where in the past the indicator tends to bounce back; similarly find resistance lines like the -0.75 line in the chart (which servers as a resistance line both for the main indicator line and its moving average )
look for convergence between the price and the indicator; for example, if the price is going up and the indicator is going down a change in the price direction may be coming soon
look for the indicator crossing its moving average: moving up will signify an up trend and vice-versa
since the difference between the open and previous close (which is what the blue line in the chart shows) since to go up to 0.68 (the upper horizontal line) and down to -0.75 (the lower horizontal line) most of the time, one strategy, using options, is to to buy, right before the close of a trading day, a "long iron butterfly": buy-to-open (BTO) both a call and a put at the strike price and sell-to-open (STO) a call at a strike of around $0.68 more and sell to open a put at a strike of around $0.75 less. The STO legs should be for the next expiration and the BTO legs for the next expiration after that. This way the STO will decrease their time value faster than the BTO legs if the price stays flat (which plays to your advantage) and the BTO legs may make profit if the next day it opens away from the price at which the ticker closed the previous day (when the position was opened). The most profit is when it moves right up to one of the STO legs. This position would normally be closed next day at opening. The percentage of profit it makes is low compared to other strategies but also the percentage of the total cost at risk is also low which could potentially allow a trader to increase the lot and thus, in the end, the total profit amount may be comparable to other strategies.
Notes:
The indicator in the chart above comes with the standard options. For a more standard momentum indicator set both the current and previous reference point to the same OHLC value (such as "close").
The 0.68 and -0.75 levels are for open/close (current/previous point of reference) for ticker INTC. Obviously, other tickers will likely have other levels and you will have to find those yourself. If you use INTC but use other combination of current and previous reference points, they will have different levels as well.

angle bar colors [LM]Hello guys,
I would like to introduce you angle bar colors indicator. It colors bars depending the angle of the bar x length back and current one
lime angle > 70 degrees
green 20 < angle < 70 degrees
orange 0 > angle <= 20 degrees
purple 0 > angle >= -20 degrees
red -20 > angle > -70 degrees
maroon angle < -70 degrees
Any suggestions are welcome
Trading margin, inside bars and outside barsThe indicator shows the trading range and the average trading range over a freely selectable period. Inside bars and outside bars are color-coded in the chart.
Der Indikator zeigt die Handelspanne und die durchschnittliche Handelspanne über eine frei wählbare Periode. Im Chart werden Innenstäbe und Außenstäbe farblich gekennzeichnet.

Paint 1 & 3 Bars (The Strat)Based on 'The Strat' methodology by Rob Smith.
This script will paint 1 & 3 bars per 'The Strat'.
N.B. Per 'The Strat' a bar is seen as a 1 (inside) when the bar's high or low is an equal tick to the previous bar.

Volume Color Bars with SMA MACD & Linear RegressionVolume Bars colored to make it easy to read with Volume Spread Analysis Indicator.
1. Red - Volume less than Simple Moving Average
2. Blue - Volume higher than Simple Moving Average
3. Black - Maximum volume of last Max_Count bar (default = 40 bars)
Additionally, you can plot Moving Average, Linear Regression and MACD of volume.

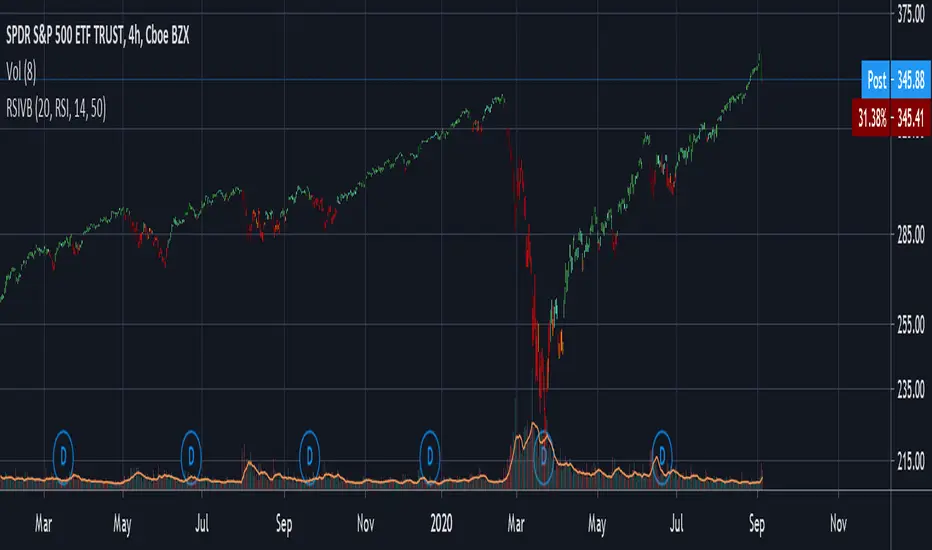
RSI & Volume Coloured BarsCandles get darker when volume is high, and brighter when volume is low. They are red or green depending on whether the RSI is above or below a threshold value, or alternatively you can pick a more vanilla coloring based on current close vs last close or last open.
For personal use as I enjoy the aesthetics of it. The more solid RSI coloring helps highlight the brightness variations from changing volume and makes trends crystal clear.
Inspired by "Volume Based Coloured Bars" by KivancOzbilgic:
and by and by RSI bars chart by taskman9:
TH Pin Bar Identifier This indicator marks both bullish and bearish Pin Bars. It helps you see potential turning points on the chart.
You can set the following on this indicator:
Length of lookback: The number of candles to compare the Pin Bar candle to. For a bearish Pin Bar, is this the highest high over the last X number of candles? For a bullish Pin Bar, is this the lowest low over the last X number of candles? The default is 2.
Percentage of wick: How big should the wick be, compared to the total candlestick body? The default is 66%.
You can change the symbol that's use to mark the Pin Bars.
By using this indicator, you accept full responsibility for any trades taken with this indicator. This indicator does not provide trading advice of any kind.

Hide Active BarWe are not supposed to make trading decisions based on active bars (bars that have not closed), right? Well sometimes my trigger finger gets a little twitchy when I'm awaiting an entry and an active candle starts to pull away or I'm in a trade and an active candle pushes against me.
Therefore, I made a VERY simple indicator that ghosts the active bar. You can see the outline but the body is transparent to emphasize that you should await its close before deciding what to do...
Very simple script but hopefully it will help me (and others) to remain a little calmer in the moment.
In case the bar recolour does not show in the main image - here it is below.
PpSignal Weis Volume & Volume in Bar V2.20This is an Advanced Weis Wave indicator which is based on Richard D. Wyckoff theory. It works in all time periods, range bar and tick bar charts and it can be applied to any market. The new Autowaves feature eliminates changing the parameters when switching time frames.
This indicator is adding the volumes of the corresponding price waves and draws a cumulative histogram. Each price wave is moving in a specific direction up or down until it reverses. In order for the indicator wave to reverse in the opposite direction, the price should exceed the number of points (pips*10) set in the indicator parameters. Therefore, the last wave repaints but the theory behind this trading method is forecasting where the market will go by reading mainly the previous waves.
The volume of the wave together with pip distance that the price has covered and the number of bars are displayed at the end of this wave. Speed Index is a new function noting the speed of the wave and can be displayed on the chart (the smaller this number is the faster the wave is and the larger this number is the slower the wave is)
Furthermore, an Alert (popup, email, push, sound) can be setup if the cumulative volume of the current wave exceeds a certain number specified in the parameters. An Alert can also be setup if Speed Index exceeds a specific value and/or is below a specific value.
Buy when the Weiss is aqua and sell when the Weiss is orange

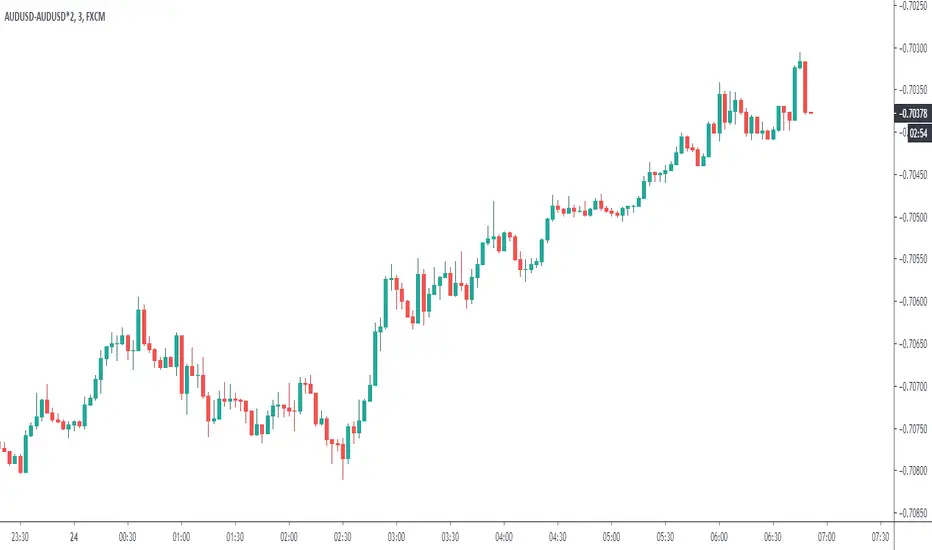
Two Bars IndexThe Two Bars Index compares the current bar to a bar n periods back.
This indicator is incredibly simple, yet so effective.

Highs & Lows of Last [x] Bars===========
Highs & Lows of Last Bars
===========
We have found this indicator invaluable over the past few years - whether you prefer to trade Crypto, Forex, Commodities or something else this indicator could prove really useful. It's always nice to know the highs and lows of the last Week or Month, the problem being the information is only really relevant at the start or end of that chosen time period; throughout the mid-section of that time period the chart will either be displaying irrelevant information or info that has been/is being re-painted. Not good!
Our Highs & Lows of Last Bars Indicator will remove this re-painting problem and display up-to-date information from higher time frames without compromising the integrity of your current chart period.
-----------
Most high & low finder indicators will use, (for example), a 'W' or 'M' as their higher TF to get HTF results - we do things just a little bit differently, it's like this:
Most other High/Low Indicators:
~ MON 1st (get high/low value from 'W' TF) ~
~ MON 8th (get new data and plot from 'W' TF)
etc. - This leads to gaps in the data, re-painting and missing lots of potential mid-week trades.
Our High & Low of Last Bars:
~ MON 1st (get high/low value from LAST 7 DAYS) ~
~ TUE 2nd (get high/low value from LAST 7 DAYS) ~
etc.
This provides a much smoother High/Low plot with more relevant information. You can clearly see areas of support and resistance, updated on the LTF chart using data from a HTF.
Because we've included 2 TF's you can use simultaneously you can see when the lower TF touches the Higher TF this (generally, but not always!) means there's a breakout coming!
Hope this is useful to you guys!
Good Luck and Happy Trading!

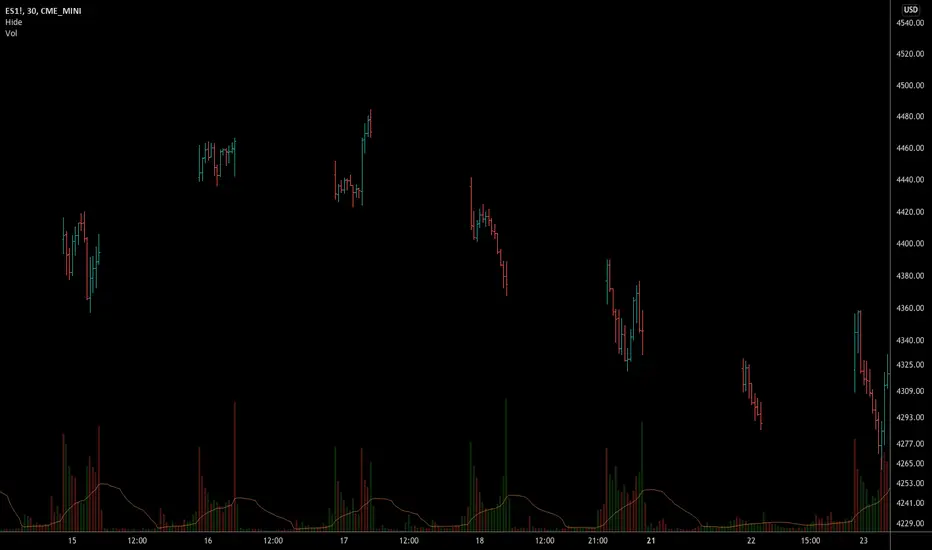
Hide extended hours/non-intraday barsEspecially for future users, such as ES/NQ/RTY/YM, etc., this script can hide the extended hours/non-intraday bars and leave the intraday bars only.
With this script , you can find the intraday support/resistance quite easily!
Example, if you are a ES investor, you can easily find the intraday support/resistance level ,which is almost equal to SPY, with this script, and no need to check SPY separately again , saving your time a lot.
Note: Please couple this script with American Bars. If you use candle charts, the upper/lower pins of the candle can't be hidden with the bars together, which is restricted by the code editor itself...
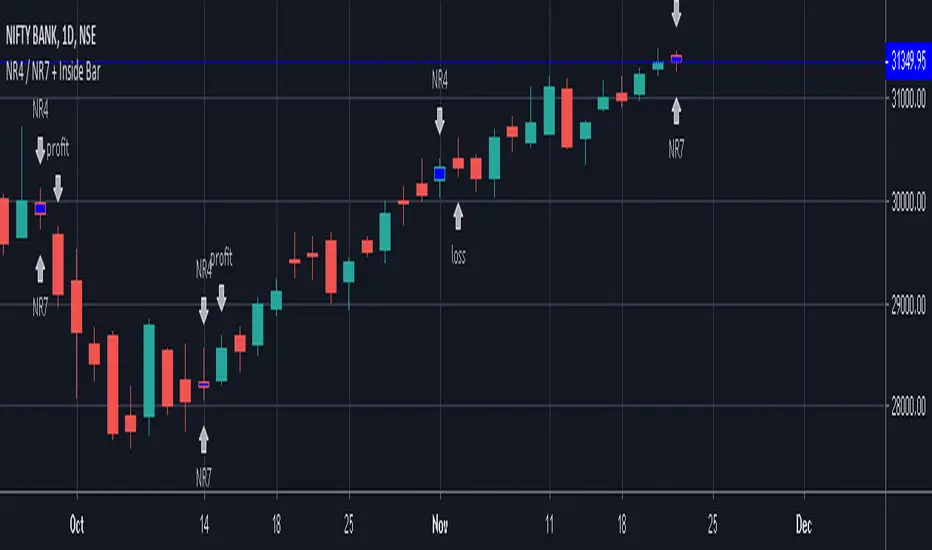
NR4 / NR7 + Inside BarIndicator Script for identifying Narrow Range 4 / 7 + Inside Bar
It also helps to check whether NR4 / NR7 breakout trading has been profitable or not in the past in a particular instrument.
It has helped me to select profitable scripts and avoid losing ones. Can be used for anytime frame.
SIGNAL
NR4 == Narrowest range of 4 periods + signal day is an inside bar
NR4 & NR7 == Narrowest range of 7 periods + signal day is an inside bar
SIGNAL "PROFIT" -
Prior day was NR4 / NR7 and next day price broke out of prior day range in 1 direction and closed in the direction of breakout away from breakout price, resulting in a profit trade.
SIGNAL "LOSS" -
Prior day was NR4 / NR7 and next day price broke out of prior day range and returned back to close inside the narrow zone OR went in opposite direction after the initial breakout, resulting in a loss trade.
Trade Context Relative Volume With BarsTrade Context Relative Volume with bars is an indicator that shows how much volume we have at a particular time of day when compared to the last X number of days.
The beauty of the indicator is you do not have to wait until the end of the day to see the average volume for today's session.
This indicator only works on minute bars and it will give you the relative volume for each bar, and a cumulative ratio for the entire day (up to that point).
Enjoy.

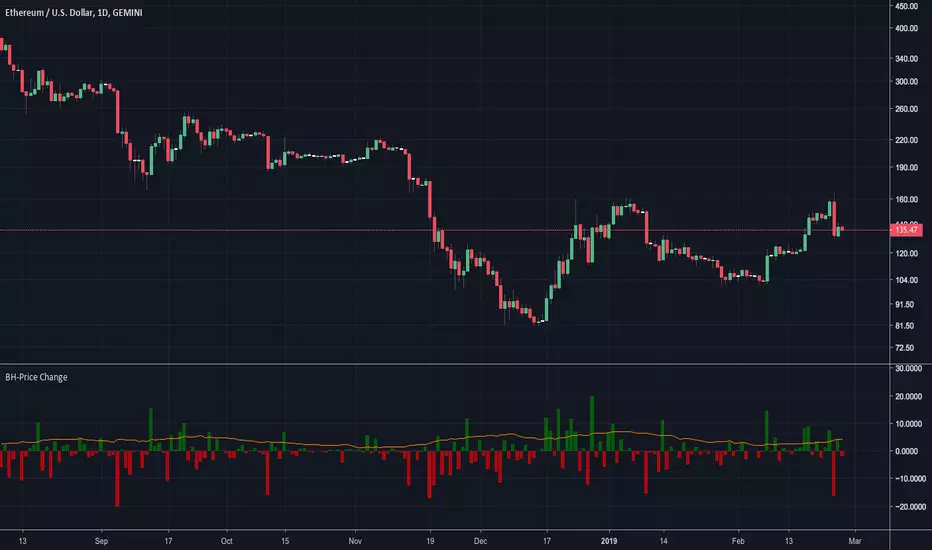
BossHouse - Price ChangeBossHouse - Price Change
What it is:
In the stock market, a price change is the difference in trading prices from one period to the next or the difference between the daily opening and closing prices of a share of stock.
Here you have a timeline with a bar price change. In seconds you can see if the selected market has good and high price changes or not.
The values are in percentage and you have a limiter in the settings, so you can show only bar/values above a value. Ex. 2.4%.
Why it Matters:
Price changes are a core component of financial analysis, and predicting price changes can be as, if not more, important than an actual price change.
It is important to remember, however, that percent-based price changes are useful only in the context of the number of dollars involved.
A 75% change in the price of a company X, for example, may only involve a few dollars while a 75% change in the price of company Y may involve thousands of dollars.
Settings:
Show the SMA 21 line
Minimum Limit - Set the minimum value to show a bar
Calculation:
For example, let's say Company XYZ shares opened at $25 this morning and closed at $24.
The price change is -$1, or -$1/$25 = -4%.
Any help and suggestions will be appreciated.
Marcos Issler @ Isslerman
Volume Profile: Intra-bar VolumeThis indicator was developed as part of a free blog post tutorial on the Backtest-Rookies website for detailed code commentary, head over there.
Scope
The indicator shall attempt to do the following:
Look at a lower time-frame. E.g 5 minutes when on a 1-hour chart.
Create a function to loop through through candles and make an assessment.
If the candle it closed up, the volume will be categorized as buying volume. Conversely, if it closed down, the volume will be categorized as selling volume
The function will then be passed to the security() function to run on a lower timeframe.
All buying volume and selling volume from the lower time-frame shall be summed and displayed on the main chart.
Important Note
This indicator will not give you genuine buying or selling volume. It simply follows the assumption that if price closed up, there must have been more buyers than sellers and if it closed down we assume the opposite.
Usage
In order to use this indicator, users will need to calculate how many lower time-frame bars are contained in the time-frame on the main chart. So for example, the default settings are configured for the indicator to be run on the 1H chart. As a result, we need to set the "Bars on Lower Timeframe" input to 12. This is because there are 12 x 5-minute bars in 60 minutes.

Pin Bar Finder (Strict)The term 'Pin Bar' actually comes from Pinocchio bar, rather than the fact it looks like a pin. If you look from above at that lying motherf*cker Pinocchio's head his nose sticks right out. This finds that kind of price action, so there aren't that many signals but the ones that you see are strong and actionable. In my opinion this is the way signals should work. This indicator also has alerts built in, so add some alerts to your favourite daily chart and you should do well. Enjoy!
These are also know as hammers and hanging man candles. If you're looking for bars that look like pins there are plenty of other indicators already in the library.


Trader Set - Uni Renko BarsBefore we start, to Trading View Developers :
1- Give us a command to get projection bar's current value, close gives the last bar's closed value not the real time market price
2- Why indicators and Oscillators can't update themselves on the projection values? It doesn't make sense, YOU are drawing the projection but won't let indicators / Oscillators update during that time?
3- Give us a damn section in category list for things like this, there was not category for a custom chart type !
Ufff, now that I took those words out of my system,
Here is the story,
few months ago (read it 10 months) I found about Woodie's indicators in Ninja Trader. At the time I didn't know the exact name for the type of charting he was using, all I knew was one sentence he said, it's based on a median renko chart (well, he told different things in different places, but this one was accurate). So? I started a huge R&D, lots of nights with head aches and not sleeping. Finding the exact formula HE was using was a nightmare. When I was close to the end of road in developing this chart type, I found in futures.io forum that Woodie got the IDEA from another member of futures.io, at least now I new that these charts are called Uni Renko Charts. But the image in the forum was not what you would see in ninja trader, also, they ask for 100$ for elite membership, I was so close in solving the equation myself that it was not worth paying it.
At the end I was successful thanks to another script I found in trading view! The formula for drawing the bar was not what the guy was using, but the heart of this system, the smoother price per bar... It was there.
At the end of the road, that few lines of code was the only thing I could find, the dynamic trend ( Purple Crosses in picture ) for example, was a nightmare to make. What woodie had made no sense to be used as trailing stop, the stop would be hit by market so late that you would loose most of the profit, at the same time, during the retraces is the trend, it would be easily hunted !!! That was the clue for me to look for something by myself.
At the end of the road, after 10 months of R&D, without a solid source of information, I got it working.
To use this, you should set your chart on Renko, Traditional with box size of 3.
Please, don't ask for access, only my students from my classes will have access to this indicator, at least for time being. If at any time in future I wish to sell, you will find the price and how to buy in the comments bellow.
