Tangram Bot 2 - SmartbotPrimeira Versão do Script Tangram Bot 2 da Smartbot para tradingview.
A intenção é agilizar e fazer um teste prévio e rápido do setup.
O resultado indicado aqui jamais corresponderá a um resultado real. É apenas uma ferramenta de estudo.
Ainda falta fazer e melhorar a parte de gestão de risco.
Caso queria fazer alguma sugestão ao cógido para melhorar a gestão de risco ou caso tenha encontrado algum erro, favor comunicar.
O tangram bot 2 combina o uso de até dez Indicadores de Análise Técnica com Gerenciamento de Risco (stop gain, stop loss, stop móvel, realização parcial, bloqueio de reversões, lucro máximo por dia e prejuízo máximo por dia) e Filtros Diversos (sentido das operações, uso do after-market, bloqueio de nova entrada após saída, hora inicial e hora final para negociação). São utilizados os indicadores Médias Móveis, HiLo Activator, MACD, ADX, Estocástico, VWAP, IFR, Bandas de Bollinger, Stop ATR e SAR Parabólico
Cerca negli script per "bot"

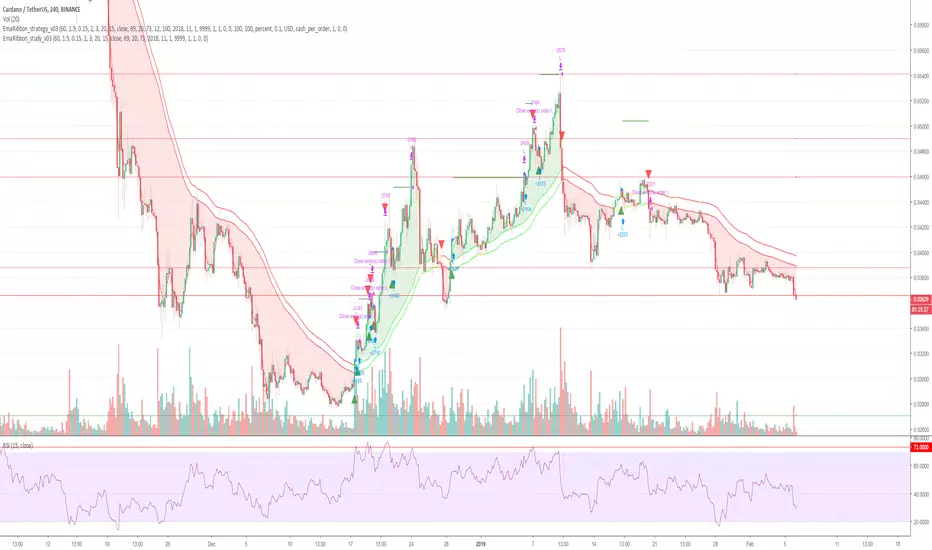
Cryptocurrency trend following EMA Ribbon LONG only studyThis strategy is based on EMA Ribbon and uses multiple indicators to find optimal time to enter/exit the trade and filter out false signals. The script with default setting is developed mainly for trading altcoins/stable coin pair such as ADA(USDT etc on 4h timeframe but it can be applied to any pair/any timeframe with some settings adjustments.
For plot on chart features make sure that you have both study and strategy scripts on chart with same settings.
Strategy settings description:
1. Signal EMA Length - Value for exponencial moving average (slowest from EMA Ribbon)
1a. Buy price toleration (%) - Price deviation for filtering bounces of EMA - price must close defined percents above EMA to open long trade
1b. Sell price toleration (%) - Price deviation for filtering bounces of EMA - price must close defined percents bellow EMA to close long trade
1c. EMA deelay - EMA id delayed by defined bars for smoothening
2. Filter by Fast EMA - Strategy filters signals to prevent buy while coin is dropping
2a. Fast EMA Length - Value for fast exponencial moving average
3. Filter by SMA - Strategy filters signals to confirm trend change
3a. SMA Length - Value for simple moving average
4. Filter by RSI - Strategy filters signals to prevent buing/selling overbought/oversold coins
4a. RSI Length - Length of RSI identificator
4b. RSI Source candle - What price of candle is used for RSI calculation (open, close, high, low)
4c. RSI Long condition - When buy, RSI indicator must be below this value to prevent of buying already overbought coin
4d. RSI Short condition - When sell, RSI indicator must be above this value to prevent of selling already oversold coin
5. RSI Close Trade Condition - Strategy sell coin once RSI reach defined value
5a. RSI close trade condition - Sell once RSI indicator acquires defined value
6. Close trade by Take Profit or Stop Loss Condition (STRATEGY ONLY) - Strategy sell coin once defined take profit / stoploss level is reached
6a. Take Profit (%) - Take profit value in percent
6b. Stop Loss (%) - Stop loss value in percent
6c. Plot targets on chart - defined targets will be plotted as lines on chart
7. Date range from
7a From Year - To run strategy in interval
7b From Month - To run strategy in interval
7c From Day - To run strategy in interval
8. Date range to
8a To Year - To run strategy in interval
8b To Month - To run strategy in interval
8c To Day - To run strategy in interval
9. Wait to confirm the signal
9a Wait candless to buy - strategy will wait defined candless to confirm the signal before buy
9b Wait candless to sell - strategy will wait defined candless to confirm the signal before sell
10. Plotting on chart (STUDY ONLY)
10a Plot signal line channel with bows on chart
10b Plot simple moving average on chart
10c Plot EMA Ribbon on chart
10d Plot recent support and resistance levels on chart
11. Show Every signal (STUDY ONLY) - Unchecked shows only first signal based on strategy. But if you use take profit/stoploss settings within your bot, you might want to rebuy on next signal. Checked shows signal on each candle.
Throw on chart also buld-in RSI indicator and set the same as strategy
Notice that there might be false signals, especially when the coin is not trending or is strongly manipulated. Overall strategy is profitable though. You just take some minor loses and wont miss the big move.
You may also consider to compare buy&hold return vs profit from trading this strategy. In downtrend as we have seen recently, profit may not be as high as you expect but it is still much better than just hold and hope.
You can use the strategy script for fine tunning settings and find best settings for yourself.
Study script helps you to automate trading with use of alerts perharps with 3commas bot or even trade manually based on email/sms notification setted by tradingview
Notice that study script does not handle takeprofit/stoploss order. That is why sell arrows could be plotted by study script later than strategy script. To rebuy after takeprofit/stop-loss use "11. Show Every signal (STUDY ONLY)" setting
Make sure that you keep same settings for strategy and study scripts.
If you need any help with settings do not hesitate to ask. I would also appriciate any feedback and ideas how to improve this script.
Here is backtest result from 1. Nov 2018 using constant 100USD Buy ammount:
Cryptocurrency trend following EMA Ribbon LONG only strategyThis strategy is based on EMA Ribbon and uses multiple indicators to find optimal time to enter/exit the trade and filter out false signals. The script with default setting is developed mainly for trading altcoins/stable coin pair such as ADA/USDT etc on 4h timeframe but it can be applied to any pair/any timeframe with some settings adjustments.
For plot on chart features make sure that you have both study and strategy scripts on chart with same settings.
Strategy settings description:
1. Signal EMA Length - Value for exponencial moving average (slowest from EMA Ribbon)
1a. Buy price toleration (%) - Price deviation for filtering bounces of EMA - price must close defined percents above EMA to open long trade
1b. Sell price toleration (%) - Price deviation for filtering bounces of EMA - price must close defined percents bellow EMA to close long trade
1c. EMA deelay - EMA id delayed by defined bars for smoothening
2. Filter by Fast EMA - Strategy filters signals to prevent buy while coin is dropping
2a. Fast EMA Length - Value for fast exponencial moving average
3. Filter by SMA - Strategy filters signals to confirm trend change
3a. SMA Length - Value for simple moving average
4. Filter by RSI - Strategy filters signals to prevent buing/selling overbought/oversold coins
4a. RSI Length - Length of RSI identificator
4b. RSI Source candle - What price of candle is used for RSI calculation (open, close, high, low)
4c. RSI Long condition - When buy, RSI indicator must be below this value to prevent of buying already overbought coin
4d. RSI Short condition - When sell, RSI indicator must be above this value to prevent of selling already oversold coin
5. RSI Close Trade Condition - Strategy sell coin once RSI reach defined value
5a. RSI close trade condition - Sell once RSI indicator acquires defined value
6. Close trade by Take Profit or Stop Loss Condition (STRATEGY ONLY) - Strategy sell coin once defined take profit / stoploss level is reached
6a. Take Profit (%) - Take profit value in percent
6b. Stop Loss (%) - Stop loss value in percent
6c. Plot targets on chart - defined targets will be plotted as lines on chart
7. Date range from
7a From Year - To run strategy in interval
7b From Month - To run strategy in interval
7c From Day - To run strategy in interval
8. Date range to
8a To Year - To run strategy in interval
8b To Month - To run strategy in interval
8c To Day - To run strategy in interval
9. Wait to confirm the signal
9a Wait candless to buy - strategy will wait defined candless to confirm the signal before buy
9b Wait candless to sell - strategy will wait defined candless to confirm the signal before sell
10. Plotting on chart (STUDY ONLY)
10a Plot signal line channel with bows on chart
10b Plot simple moving average on chart
10c Plot EMA Ribbon on chart
10d Plot recent support and resistance levels on chart
11. Show Every signal (STUDY ONLY) - Unchecked shows only first signal based on strategy. But if you use take profit/stoploss settings within your bot, you might want to rebuy on next signal. Checked shows signal on each candle.
Throw on chart also buld-in RSI indicator and set the same as strategy
Notice that there might be false signals, especially when the coin is not trending or is strongly manipulated. Overall strategy is profitable though. You just take some minor loses and wont miss the big move.
You may also consider to compare buy&hold return vs profit from trading this strategy. In downtrend as we have seen recently, profit may not be as high as you expect but it is still much better than just hold and hope.
You can use the strategy script for fine tunning settings and find best settings for yourself.
Study script helps you to automate trading with use of alerts perharps with 3commas bot or even trade manually based on email/sms notification setted by tradingview
Notice that study script does not handle takeprofit/stoploss order. That is why sell arrows could be plotted by study script later than strategy script. To rebuy after takeprofit/stop-loss use "11. Show Every signal (STUDY ONLY)" setting
Make sure that you keep same settings for strategy and study scripts.
If you need any help with settings do not hesitate to ask. I would also appriciate any feedback and ideas how to improve this script.
Here is backtest result from 1. Nov 2018 using constant 100USD Buy ammount:

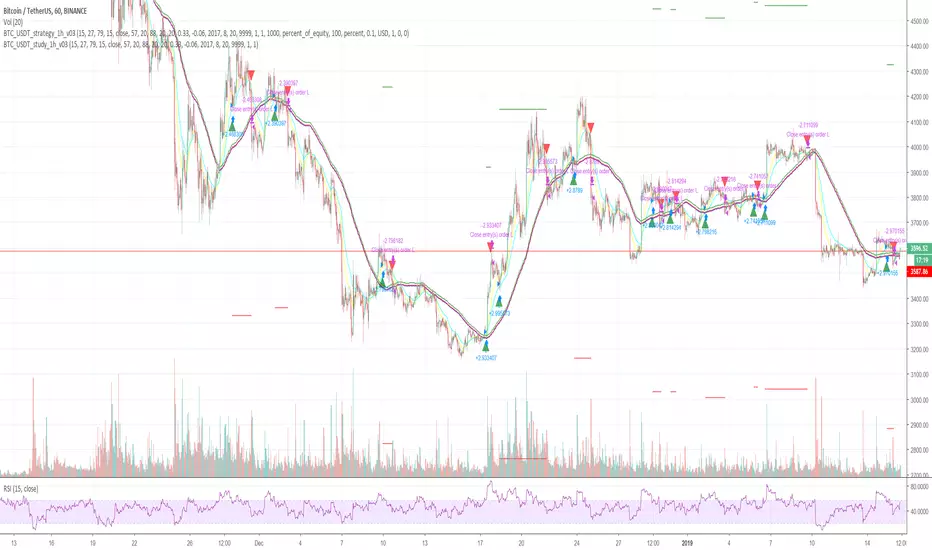
Cryptocurrency trend following LONG only strategyThis strategy uses multiple indicators to find optimal time to enter/exit the trade. The default setting is mainly for trading bitcoin/stable coin pair such as USDT etc on 1h timeframe but it can be applied to any pair/any timeframe with some settings adjustments.
Strategy settings description:
ID Name Descrption
1 FastMA - Value for fast exponencial moving average
2 SlowEMA - Value for slow exponencial moving average
3 SMA - Value for simple moving average
4 RSI Length - Length of RSI identificator
5 RSI Source candle - What price of candle is used for RSI calculation (open, close, high, low)
6 RSI Long condition - When buy, RSI indicator must be below this value to prevent of buying already overbought coin
7 RSI Short condition - When sell, RSI indicator must be above this value to prevent of selling already oversold coin
8 RSI close trade condition - Sell once RSI indicator acquires defined value
9 Take Profit (%) - Take profit value in percent
10 Stop Loss (%) - Stop loss value in percent
11 Long price toleration (%) - Price deviation for filtering bounces of simple moving average - price must close defined percents above SMA to open long trade
12 Short price toleration (%) - Price deviation for filtering bounces of simple moving average - price must close defined percents bellow SMA to close long trade
13 From Year - To run strategy in interval
14 From Month - To run strategy in interval
15 From Day - To run strategy in interval
16 To Year - To run strategy in interval
17 To Month - To run strategy in interval
18 To Day - To run strategy in interval
19 Show every signal? - (Study only) Unchecked shows only first signal based on strategy. But if you use take profit/stoploss settings within your bot, you might want to rebuy on next signal. Checked shows signal on each candle.
Notice that there are also false signals, especially when the coin is not trending or is strongly manipulated. Overall strategy is profitable though. You just take some minor loses and wont miss the big move.
You may also consider to compare buy&hold return vs profit from trading this strategy. In downtrend as we have seen recently, profit may not be as high as you expect but it is still much better than just hold and hope.
You can use the strategy script for fine tunning settings and find best settings for yourself
Study script helps you to automate trading with use of alerts perharps with 3commas bot or even trade manually based on email/sms notification setted by tradingview
Make sure that you keep same settings for strategy and study scripts.
If you need any help with settings do not hesitate to ask. I would also appriciate any feedback and ideas how to improve this script.
Here is backtest result from 23.08.2017:
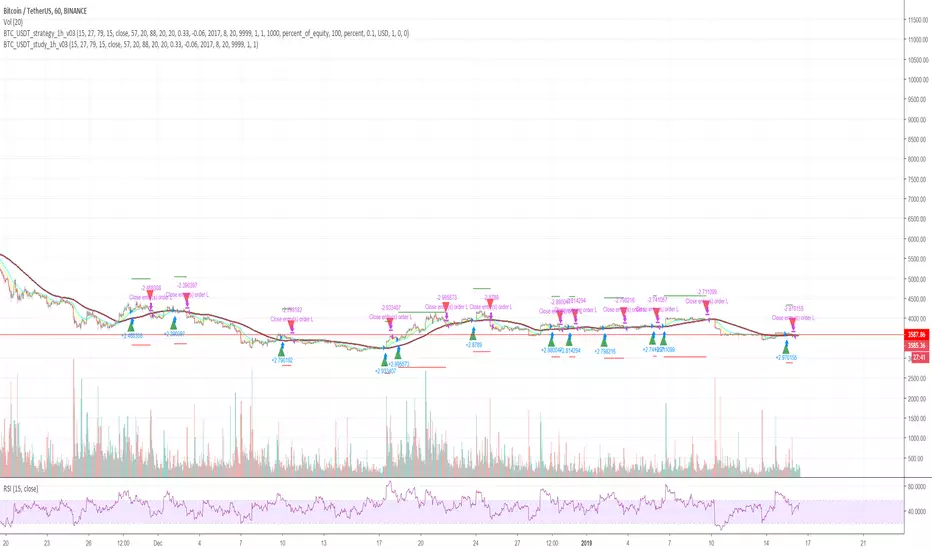
Cryptocurrency trend following LONG only studyThis strategy uses multiple indicators to find optimal time to enter/exit the trade. The default setting is mainly for trading bitcoin/stable coin pair such as USDT etc on 1h timeframe but it can be applied to any pair/any timeframe with some settings adjustments.
Strategy settings description:
ID Name Descrption
1 FastMA - Value for fast exponencial moving average
2 SlowEMA - Value for slow exponencial moving average
3 SMA - Value for simple moving average
4 RSI Length - Length of RSI identificator
5 RSI Source candle - What price of candle is used for RSI calculation (open, close, high, low)
6 RSI Long condition - When buy, RSI indicator must be below this value to prevent of buying already overbought coin
7 RSI Short condition - When sell, RSI indicator must be above this value to prevent of selling already oversold coin
8 RSI close trade condition - Sell once RSI indicator acquires defined value
9 Take Profit (%) - Take profit value in percent
10 Stop Loss (%) - Stop loss value in percent
11 Long price toleration (%) - Price deviation for filtering bounces of simple moving average - price must close defined percents above SMA to open long trade
12 Short price toleration (%) - Price deviation for filtering bounces of simple moving average - price must close defined percents bellow SMA to close long trade
13 From Year - To run strategy in interval
14 From Month - To run strategy in interval
15 From Day - To run strategy in interval
16 To Year - To run strategy in interval
17 To Month - To run strategy in interval
18 To Day - To run strategy in interval
19 Show every signal? - (Study only) Unchecked shows only first signal based on strategy. But if you use take profit/stoploss settings within your bot, you might want to rebuy on next signal. Checked shows signal on each candle.
Notice that there are also false signals, especially when the coin is not trending or is strongly manipulated. Overall strategy is profitable though. You just take some minor loses and wont miss the big move.
You may also consider to compare buy&hold return vs profit from trading this strategy. In downtrend as we have seen recently, profit may not be as high as you expect but it is still much better than just hold and hope.
You can use the strategy script for fine tunning settings and find best settings for yourself
Study script helps you to automate trading with use of alerts perharps with 3commas bot or even trade manually based on email/sms notification setted by tradingview
Make sure that you keep same settings for strategy and study scripts.
If you need any help with settings do not hesitate to ask. I would also appriciate any feedback and ideas how to improve this script.
Here is backtest result from 23.08.2017:
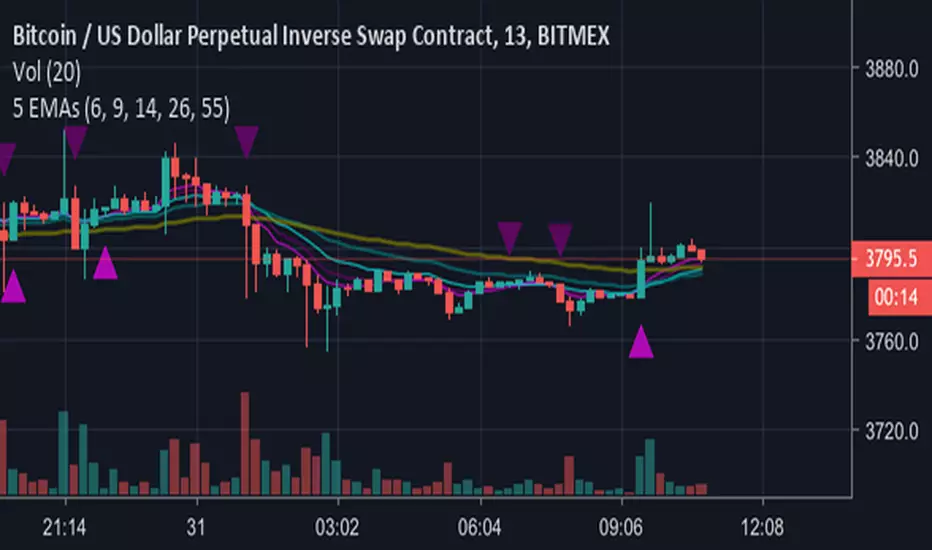
5 EMAs plus Crossing AlertsHi all,
This is a simple indicator that plots 5 EMA lines of your choice to the screen.
Can be used to trigger scalping Bots (stoploss around 0.5% recommended, take profit 1% or higher, please backtest!)
Also can be used for manual scalping, 1 or 2 candles at a time.
Features:
1) Alerts are triggered when EMAs 1 (Signal line) and 2 (Baseline) cross - a Long signal is called if the cross is above EMA 3 (Trendline), a short if the cross is below EMA3
2) Signals are represented visually as a triangle on the chart, below the candles is a long, above is a short
3) TradingView Alerts can be easily set as I have labelled the signals clearly as many other Indicators like this aren’t easy to work out if trying to create alerts to trigger a 3commas bot, for example!
Each EMA is fully customisable and if you wish to take advantage of the alerts, only a few simple rules need to be followed:
EMA1 needs to be less than EMA2.
EMA2 needs to be the same or greater than EMA3
That’s it, happy trading!
Big shout out to B and the gang over at Crypto Trading Group!
EMA Bot Trigger - 14,26,55Work In Progress - Currently will send Long/Short triggers when EMA 14 Crosses EMA 26 - whether the cross is above the EMA 55 determines whether to Long or Short.
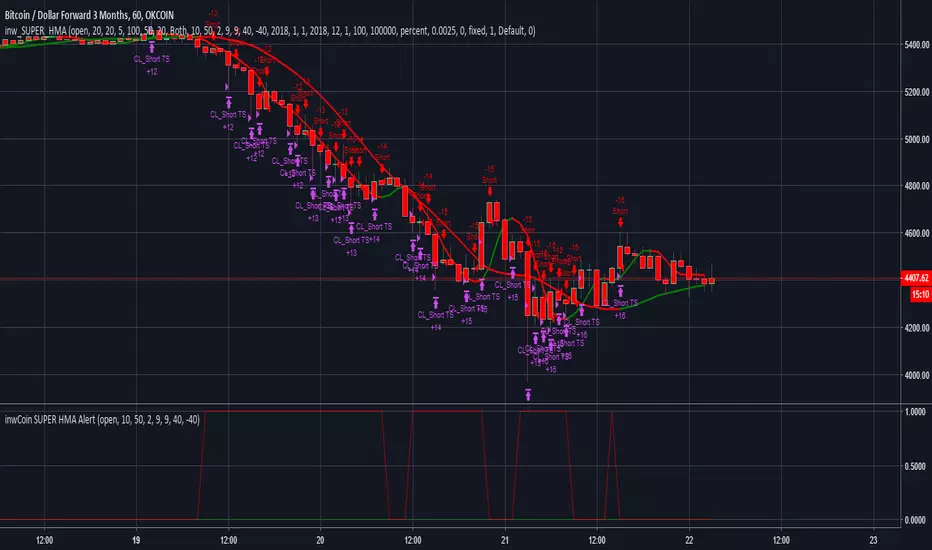
inwCoin SUPER HMA StrategyImproved version of inwCoin HMA Aggressive Strategy.
Filter out random trade from sideway period and wait for trend only.
Work very well on BTCUSD3M at OKEX with leverage 20x ( with the help of trailing start/stop bot, of course )
If you have OKex bot/ Or plan to write one. This strategy is the best bet.
If you want sourcecode, I can give you for 0.1 BTC :) Send BTC to address below and IM me for acknowledgement.
BTC : 3BmqVW8eqE3qAGdtCdYGFYKbMwEALAhSEp
Check some backtest result here : imgur.com
Backtest result for various trade% : imgur.com
Swing trade - Libertus - STRATEGYHello all.
Month of hard work, testing and fine tunning went into making of this strategy.
I wanted to be able to leave trading to bot and spend more time away from charts and this strategy finally enabled me to do just that!
It's a swing trade strategy which will always keep you in trade (if used on exchange which allows you to short).
If you use 4H time frame you'll get about 2-3 trades a week.
As you should be able to see bellow, strategy has very good profitability of 60+% in last 6 months with small drag-down and nice profits.
It's optimized for ETH on 4H time, but settings can be adapted for different assets and time frames.
Best settings for ETH 4H time frame are default 0/0 with both Filter 1 and Filter 2 enabled.
Settings can be changed in positive +1, +2, +3 etc., and negative -1, -2, -3...
Strategy profitability is based on buying and selling 10 ETH (not more, not less) in every trade. You can see +20 or -20 on every trade which means 10 ETH for closing current position and 10 ETH for opening new position. If you are trading more or less then this, you can easily calculate your profitability via this.
Indicator which could be used manually or via bot is in production, will be finished soon!
Good luck trading!

MACs EasyMoney - BOT Trade with AlertSytemsNew Version: MACs EasyMoney - BOT Trade with AlertSytems
Introducing the BOT version with proper alerts systems to enter and exit trades.
Also furnished with latest noise filtering architecture to this tool.
Strategy Test report for this tool - holds the Profit Factor of 134 - based on '1 contract' size with '0.25% commission' rate as well.
(Means it is very solid and healthy Profit Factor . happy to say that, you wont get any like this in today's Market)
Refer the Strategy Publication for details.
Thanks,
Mac.

PREMIUM CRYPTO TRADING BOT Trading signals confirmed by 6 sources.
Multiple timeframes. 1min - 4hours
Any Alt coin including BTC.
3 separate signals for scalping, intraday and swing trading.
Perfect entries when combining all the confirmations. (Candle color change, triangle signal, traffic lights at the top and bottom, scalp line color change, intraday line color change and trend indicator (Swing) line position.
We are actively improving on this bot and new updates will be saves on your bot too.
Contact me if you would like to use our bot.

14/28 Day SMA Divergence and RSI - No RepaintIf you are interested in purchasing my algorithmic trading bot that receives Tradingview indicator alerts via email and then executes them in Bittrex, please visit my product page here: ilikestocks.com Additionally, I would love to create video/blog guides on creating Tradingview scripts or strategies. If you are a knowledgeable in finance or other related fields and would like to be featured on my page, please contact me at tanner@ilikestocks.com.
No crossovers were used in this script, and this is likely the reason for the no repaint(Correct me if wrong).
This strategy script uses a 14-day SMA signal line, a 28-day SMA and RSI. The strategy works by determining whether the (14-day SMA is above the 28-day SMA and the RSI levels are overbought(below 30)) or RSI is very overbought(below 13 or so). Once either of these conditions have been met, a long position is opened.
The initial long position must be partially closed by the take profit first and then the final close is executed if the 14-day signal SMA is below the 28-day SMA; you may also exclusively use take profit to close positions.
The green plotted spikes are the initial long position conditions. The orange plotted spikes are take profit signals once a long position is opened. The red plotted spikes are plotted when the SMA 14-day is below the 28-day SMA.
Please do leave constructive criticism or comments below because it helps me better create scripts!

Bottoms Up w/ Buy and Sell AlertsBITMEX:XBTUSD
This indicator is best used on 4hr candles. It produces a buy/long and sell/short alert with pre-coded syntax for Autoview. There are four alerts total, 2 for BitMEX testnet and 2 for BitMEX (each has a buy/sell alert). The alerts are pre-coded for BitMEX
****be sure to edit the message script to your desired contract amount and leverage****
This script will also work on Profit Trailer, but you will need to change the alert message syntax to match your exchange. You will also want to adjust your bot's selling strategy to hold the coin longer. This is not a quick scalp of a coin, this is intended to buy a coin and ride its trend longer. This is more of an automated swing trader rather than a scalping opportunity like most bots use.

Deep Pockets BOTThis script repaints.. don't use without using it with my bot!!! ONLY my bot knows how to use this script and get the results stated.

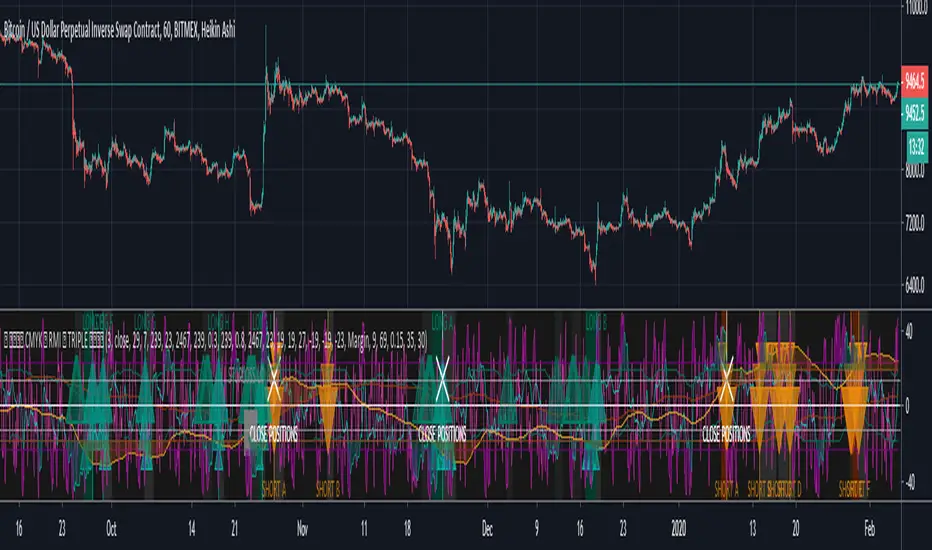
CMYK RMI TRIPLE Automated study for Autoview▼ This is the study version of the script, For usage with Autoview
◊ Introduction
This script makes use of three RMI 's, that indicate Overbought/Oversold on different timescales that correspond with Frequency’s that move the market.
◊ Origin
The Relative Momentum Index was developed by Roger Altman and was introduced in his article in the February, 1993 issue of Technical Analysis of Stocks & Commodities magazine.
While RSI counts up and down ticks from close to close, the Relative Momentum Index counts up and down ticks from the close relative to a close x number of days ago.
This results in an RSI that is smoother, and has another setting for fine tuning results.
This bot originated out of Project XIAM , an investigative script that outlined my approach towards Automated Trading Strategies.
Are you interested in writing bots yourself ? check out the beta version of this script.
It has many bugs, but also most of the Skeleton.
◊ Usage
This script is intended for Automated Trading with AUTOVIEW or TVAUTOTRADER , on the 1 minute chart.
◊ Features Summary
Overlay Mode
Indicator Mode
Three RMI's
Trend adjustment
Pyramiding
Ignore first entries
Take Profit
Stop Loss
Interval between Entries
Multiring Fix
Alert signal Seperation
◊ Community
Wanna try this script out ? need help resolving a problem ?
CMYK :: discord.gg
AUTOVIEW :: discordapp.com
TRADINGVIEW UNOFFICIAL :: discord.gg
◊ Setting up Autoview Alerts
Use the study version of this script, To set up The Alerts Autoview Picks up on.
The Signals to work with are :
Open 1 Long
Use this to open one Long Position.
With quantity being : /
Once per bar
Being larger than 0
Comment example : e=exchange b=long q=amount t=market
Open 1 Short
Use this to open one Short Position.
With quantity being : /
Once per bar
Being larger than 0
Comment example : e=exchange b=short q=amount t=market
Close1 Position
Use this to Close The amount of one Open Position.
With quantity* being : /
Once per bar
Being larger than 0
Comment example : e=exchange c=position q=amount t=market
*Beware when using a percental % quantity, instead of an absolute quantity.
Percental Quantities are based on the , Not
And will change in absolute value relative to the amount of open trades.
Close All positions
Use this to Close All Open Positions.
With quantity being :
Once per bar
Being larger than 0
Comment example : e=exchange c=position t=market
For the specific Syntax used in the comment of the alert, visit Autoview .
◊ Setting up TVAutotrader
Use the strategy version of this script, And load it into TVAT .
◊ Backtesting
Use the strategy version of this script for backtesting.
◊ Contact
Wanna try this script out ? need help resolving a problem ?
CMYK :: discord.gg
CMYK XIAM OPEN◊ Introduction
This is project XIAM, a work in progress.
Recently i came across the repainting problem.
Since then i haven't seen any bot-code that makes > 5% profit in two weeks with 0.25% fees/trade.
People who make good bots either bluff or don't share the code.
they let you rent it.
I aim to understand, learn it, write it myself. And share my findings with whoever shares with me.
◊ Origin
Based on RMI (RSI with momentum) and SMA, and values derived from those.
◊ Usage
Currently an investigative script.
◊ Theoretical Approaches
Philosophy α :: Cleansignal
:: Cleaning up the signal, from irregularities that cause unpredictable results.
Merging available tickers of a pair into one.
Merging available tickers of different coins into one in the correct proportion. (eg. Crypto market cap)
Removing Jitter, and smoothing signal without delay.
Philosophy β :: Rythmic
:: Syncing into the rythm's, to never miss the que, and trade on every theoretical low/high
Searching Amplitude, Period, Phase Shift, Frequency's of the carrier waves.
Marking Acrivity/inactivity of the carrier waves.
Partial Fractal repetition asses-able with above data?
Philosophy γ :: consequential
:: Seeking for Indicatory events and causal relations
Probability / reward.
Confirmation and culmination.
...
◊ Community
Wanna share your findings ? or need help resolving a problem ?
CMYK :: discord.gg
AUTOTVIEW :: discordapp.com

Martingale Grid BotMartingale Grid Bot (MGB)
The strategy is designed to test grid trading with a possible increase in the size of each subsequent order based on the martingale principle. The strategy itself does not contain any trade decision logic and is fully driven by external signals coming from indicators used on the chart. A new grid of orders is created when an entry signal is received, provided that there is no active grid.
❗ Warning
Trading with leverage and martingale involves increased risk. This strategy is a rather rough tool and is intended for testing purposes only. The author is not responsible for any possible discrepancies between the strategy results and real trading.
Settings
Direction - Trading direction. Possible values: Long and Short.
Entry Signal Source - Source of the entry signal that initiates the creation of a new order grid. If one of the price sources (open, high, low, close, etc.) is selected, a new grid will be created automatically after the previous grid is fully closed.
Start Time - Date and time when the strategy starts operating. Marked on the chart with a vertical dashed line.
No Repainting Mode - A mode intended to reduce discrepancies between historical and real-time strategy behavior (repainting).
Enabled — a new grid is created only after the bar is closed. The first order can be filled no earlier than on the next bar.
Disabled — in real-time, a new grid can be created immediately upon receiving a signal or after the previous grid is closed by take profit or stop loss.
❗ Attention
For correct real-time operation, recalculation on every tick must be enabled in the strategy settings.
GRID
Grid Depth % - The depth of the order grid, specified as a percentage of the closing price at the moment the grid is created.
Orders Count - The number of orders in the grid. The first order is placed at the current closing price at the time of grid creation.
Martingale Multiplier - Position size multiplier. Each subsequent order in the grid will be increased by this factor. The size of the first order is defined in the strategy settings.
Leverage - Leverage multiplier for margin trading. Used to check available funds when creating grid orders. It is recommended to use it together with the margin parameters in the strategy settings.
Take Profit % - Calculated on each strategy update based on the average entry price. If none of the grid orders have been filled yet, the take-profit level for the first order is displayed on the chart.
Stop Loss % - Calculated from the price of the first grid order and does not change during the strategy operation. Orders whose price exceeds the stop-loss level will be automatically canceled.
TABLE
Show Table - Controls the display of the table with all orders of the current grid. If there is no active grid, no order data is displayed. Text and background colors are determined automatically based on the chart background color.
Order Size - Determines how the grid order size is displayed: in contracts or in currency.
Table Size - Font size in the table.
Timezone - Used to correctly display the order fill time relative to the chart time. The order fill time (status: filled) can be seen by hovering over the corresponding status cell in the table.
VISUAL
Long Entry - Color of the dotted lines representing grid orders when trading long. Also defines the color of the vertical line indicating the strategy start time.
Short Entry - Color of the dotted lines representing grid orders when trading short. Also defines the color of the vertical line indicating the strategy start time.
Take Profit - Color of the solid line representing the take-profit level.
Stop Loss - Color of the solid line representing the stop-loss level.

Shock Gap Bot [Enhanced]Shock Gap bot this to provide entry for pre market stocks , so you can get the bounce back


UT Bot + MACD BUY Delayed Confirm v6UT Bot + MACD BUY Delayed Confirm..even if macd cross happens afterwards signal arrives

Force of Multi Strategy Bot: Backtest Webhook Alert Adaptive MTFForce of Multi Strategy (FoMS) - Innovative solution designed for crypto trading 📈
Overview:
An intraday algorithmic trading bot with 29 strategies, up to 10 symbols, and multi-timeframe filters sends pre-configured Webhook Alerts in TTA format to major crypto exchanges and features a live strategy Switcher that selects the best-performing strategy based on real-time backtest data
Key Features:
29 non-repaint strategies on up to 10 symbols
Buy/Sell signals based on TV Technical Rating, as well as classic and adaptive indicators
Higher Timeframe filters (ADX, Volatility, Volume, ATR) with multipliers from chart TF
Advanced risk management and backtest metrics
Automated "Switcher” to pick the best-performing strategies from backtest data in real time
Webhook alerts in TTA format (tradingview to anywhere) pre-configured to major Crypto Exchanges: Binance, Bitget, BingX, Bybit, GateIO, KuCoin and OKX
Main Inputs:
"All Strategies" on/off - trading all strategies on chart symbol or one strategy for 10 symbols
HTF Mult 1/2 - multipliers for 2 higher timeframes filters
InitCap/Trade$/Leverage - position size of one trade and initial capital
Min ROI/WR/PF/SRP/MAR/Trades - minimal cutoff for key strategy performance metrics. When "All Strategies" is "on", the switcher will open trades for strategies which meet these criteria
"Check Last" on/off - check performance metrics for a specified number of recent trades.
If the option is disabled, metrics are checked for the entire duration of the backtest
BacktestDays/MaxBars - set how long the script will perform backtests in days, with a limitation on the number of bars for acceptable calculation speed
How it works:
Only one trade can be opened at a time for each symbol. Strategies or symbols are calculated using their own initial capital settings
FoMS operates in two modes: ‘All Strategies’ on and off. When ‘All Strategies’ is off, it focuses on a single, user-selected strategy for each symbol. If ‘All Strategies’ is on, it's continuously evaluates 29 strategies and uses the Switcher to select the most promising ones
“All Strategies” Off Mode:
When the ‘All Strategies’ option is disabled, the script executes trades and sends alerts based on a single, user-selected strategy for each symbol. The script records backtest results for the selected strategy, allowing you to analyze its performance
In attached example you see how FoMS works on 10 symbols (first ones in alphabetical order with a leverage of 50) with chosen strategy #2 and enabled ATR HTF filter. Summary Profit & Loss for Backtest strategy #2: +$162.20 across 119 trades, with a $10 per-trade margin
This mode ideal when you calibrate risk management options on different symbols, or if you find that one of 29 strategies is profitable on many symbols and want trade with many of them simultaneously. This opens up the possibility of mass diversification, for example, launching trading on 200 symbols with just 20 notifications
“All Strategies” On Mode:
When the ‘All Strategies’ enabled, FoMS continuously evaluates 29 strategies for chart symbol and records backtest results continuously from each of them enabling the switcher to work
In this example, you can see how FoMS operates with all 29 strategies on a single chart symbol, with a summary P&L of +554.7$ from the backtest across 403 trades. Over the last 20 days from the backtest starting point, each strategy executed a different number of trades, from 2 to 41, getting different P&L from -26.1$ to +74.2$. Based on the results obtained, it seems prudent to continue trading only with strategies that have been more successful in the backtest
This is where he comes into play: strategy switcher executes trades and send alerts only from strategies that meet your pre-defined performance criteria, based on backtest results of all strategies. This opens up opportunities, allowing you to not only test the performance of one or many strategies, but also test the logic behind switching them
In attached example switcher use next logic: trades opened only for strategies who reached in test minimal setting ROI >= 0.2, PF >= 1.75 and SRP >= 1. As a result of testing this given logic: profit/loss = $84 , return on investment = 0.33, number of trades in 20 days = 34 .
P&L per trade rises from 1,37$ (all strategies backtest trades) to 2.47$ (switcher work)
Another backtest of logic example, switcher does the same thing but after check 6 last trades for each strategy. This rise ROI from 0.33 to 0.43, P&L rises from 84$ to 98.7$, P&L per trade rises from 2.47$ (check 20 days test) to 3.3$ (check last 6 trades)
Also, switcher has abilities to check strategies and update decisions about their performance with setting time period , for example every 2 days, and additionally it’s can choose for trading only Top ROI Rated Strategies, at say for example it can open trades from only Top 3 of them all
Interface:
Labels: on chart show open long/short and result in USD for closed trades, when "All strategies" is active - labels at bottom of indicator window show which exactly number of strategy opens a deal. The "No" label means that none of the strategies that meet the performance criteria have opened a trade at this time
Lines: indicator window contained equity line (aqua) and HTF Technical rating area, chart contain SL/TP (red/green) and open price (blue) lines for opened trades
Table 1 (all strategies or all symbols):
- TR: count of closed trading deals; WR: Winning Rate; PF: Profit Factor
- MDD: Max Draw Down for all calculated time from initial capital
- R$: trading Profit & Losses Result in USD
First row shows some of script settings, in published example: initial capital 100$, leverage 50L, 20 backtest days, 10$ is invest in one deal, 15m is chart timeframe, 60m is higher timeframe 1 and 120m is higher timeframe 2.
The exchange name in the second row determines the alert messages format
If strategy meet cutoff criteria you will see "Ok" label, if strategy meet criteria and have maximum from other reached ROI they labeled "Best". Chart strategy labeled "Chart", Chart and Ok labels in one time is "Chart+", "Chart" and "Best" is labeled "Best+"
Green or red color of strategy number/symbol means a long or short trade is currently active
Table 2 (chart symbol):
- PT: Result in USD Per one Trade; PW: Result Per Win, PL: Result Per Loss
- ROI: Return On Investment; SR: Sharpe Ratio, MR: CalMAR ratio
- Tx: Commission Fee in $; R$: trading Profit & Losses Result in USD
There separate trade results of backtesting for longs and shorts. In first column you see how many USD were invested in one trade, taking into account possible position splitting
Update frequency: closed trades information updated every bar, but check "ok"/"best" labels in table 1 would be when chart have not open trade. Its need for calculation speed purpose
Risk management options:
When a buy or sell trade is opened, you'll see three lines on the chart: a red stop-loss line ( SL ), a green take-profit line ( TP ), and a blue line representing the entry price . The trade will be closed if the high price or low price reaches the line TP or SL (no wait for bar close) and alert will be triggered once per bar when script recalculates
Several options are available to control the behaviour of SL/TP lines, such as stop-loss by percent, ATR, Highest High (HH) and Lowest Low (LL) . Take Profit can be in percent, ATR, Risk Reward ratio . There some Trailing Stop with start trail trigger options - ATR, % or HH/LL
Available Kelly position sizing option with multiplier to reduce growth
Additionally, implemented a function for adding a position when the breakeven level expressed in the current ROI is reached for opened trade (splitting). The position is added within the bar
Webhook alerts in TTA format with message contained next info : Buy / Sell or adding Quantity, Leverage, SL price, TP price and close trade Result in USD
(for easy forward tests and check difference between actual trade result and alerts logs)
Backtest Engine:
Profit or Loss is USD = close trade price * open trade quantity - open trade price * open trade quantity - open trade quantity * (open trade price + close trade price)/2 * commission
Possible slippage or alert sending delay needed to be include in commission % which you will set in risk management settings block, default settings is 0.15% (0,06% for open, 0,06% for close and 0,03% for possible slippage or additional fees)
Maximum Draw Down Drawdown = (peak - current equity) / peak * 100 ;
Drawdown > maxDrawdown ? maxDrawdown = Drawdown
ROI = profit result in USD / sum of all positions margin
CalMAR Ratio = ROI / (-MaxDrawDown)
Sharpe Ratio = ROI / standard deviation for (Sum of all results) / (Sum of all Position Margins)
Strategies:
Before describing them, I’ll provide extensive statistics on the results of using the listed strategies:
Number 1, 2 and 3: based on Higher Timeframe TradingView Technical Ratings at self. 1 is summary total rating, 2 is oscillators and 3 is moving averages. When TR filter cross user setting filter levels trade will be open at chart bar close. By Default on chart you see Summary Technical Rating oscillator, but here the options for change it to Oscillator TR or Moving Average TR
Number 4, 5 and 6: based on Chart TimeFrame TR. Trades will open when its values (Summary, Oscillators and Moving Averages) reached setting buy/sell level. To seeing plot of Chart TF Technical Ratings you can just set HTF multipliers to 1
Number 7, 8 and 9: is Alternative buy sell logic for Chart TimeFrame TR, trades will open when counting rising or falling setting values will be reached
Number from 10 to 18: based on user-selected adaptive Moving Averages and Oscillators indicators. In settings you will see different types of Adaptive Algorithms, Moving Averages (By default: SMA, RMA, WMA, Hann, JMA) and Oscillators (By default: RSI, LRSI, MomentumRSI, RVI) - more than 30 options in total. The standard adaptive algorithm is unique, developed by the author and based on ADX: it shortens the length of the MA/OSC when the market is defined as trending, and increases it when the market is defined as sideways. Other available adaptive length algorithms options based on identification of Volatility, Market Cycles or Trending and works on a similar principle adjusting the length setting of MA/OSC within market condition. All adaptive strategies have their options for calibrating. You can plot on chart any MA/OSC and its length obtained from adaptive algorithms. Trades are opened when the MA/OSC are crossed user-specified in settings buy/sell levels
Number from 19 to 29: They are calibrated between two options "Fast React" or "Strong Signal" for avoid overfitting. "Fast React" mean trades would be more, indicators will detect buy/sell condition faster. "Strong Signal" buy/sell will identifies slower and open potentially more accurate trades. I tried to found mostly time worked classic strategies within thousands tests, at the time of publication this script uses :
- Swing HH LL ( 19 ): trades open when trend swing is determined by comparing the timing of the latest high vs. low within time window sensitive to Fast or Strong setting;
- Composite indicator ( 20 ): implemented Fast or Strong variations based on normalized and weighted 0.25 * SMA + 0.15 * RSI + 0.25 * MaCD + 0.35 * ROC, buy/sell signals trigger when overbought/oversell (ob/os) levels is crossed;
-%R ( 21,22 ): buy/sell signals occur when fast or strong long term Williams %R and short %R cross centre line or ob/os levels;
- Pivot Point SuperTrend ( 23 ): identifies pivot point centreline with ATR bands, buy/sell signal triggered when fast or strong trend direction is changed;
- Ichimoku ( 24 ): buy/sell when tenkan cross kijun with strong or fast cloud trend confirmation;
- TSI ( 25 ): trades open when fast/strong variations of true strength index crossing ob/os levels;
- Band Level RSI ( 26 ): identifies bands based on fast/strong close price wma and stdev, buy/sell signals triggered when RSI cross ob/os levels with price out of bands;
- RSI/MacD ( 27, 28 ): trades open when macd crossing signal line if RSI was in ob/os condition long time ago or short time ago in a fast or strong variations, and open trades when macd line (fast) or signal line (strong) crossed zero line;
- Bars UpDown( 29 ): trades open when last bars ups or downs in fast or strong variations
- Overbought/oversold levels are sensitive to the “Fast React” or “Strong Signal” settings
Why this mashup: No one single trading strategy works consistently in all conditions. I combine 29 unique strategies to dynamically identify the best-performing ones at any given time
You can enable or disable various Higher Timeframes Filters (ADX, Volume, Volatility, Tech rating). If enabled, trades will only open when the filter setting are reached for one of two HTF
And after this describe i will show you another great statistics:
In showed tables you see backtest results for all strategies on 100 random crypto coins. Uses default script settings: InitCap 20$, One trade 3$, L50, commission 0.15%, 15m chart TF and two HTF 60m and 120m, ATR 2.5 SL and ATR trailing with trigger at 7 ATRs by open price
What in this stats: First test was without any HTF filtering, second table show result for same strategies and coins, but with enabled ADX Filter. As you can see Filter reduce Losses radically
Without filtration just 24 crypto coins averages from 100 was profitable, with ADX filtration this number rises to 32 from 100 , note that after filter best performed become another strategies. Bear in mind, all filters or risk management options will affect their backtest performance
For clarity: classic indicators are not plotted on chart in this script to avoid overloading the interface. You can easily understand what exactly do listed upper strategies by the “Long” and “Short” labels on the chart and the trades counted in the tables. While you can collect the massive statistics by yourself as shown upper, it is not part of this script
Originality and Value:
Diverse: fully customizable rules for the first 18 strategies, as well as a choice of "fast" or "strong" signals for the remaining 11, allow you to build a suite with different trading frequency
Risk Control and Backtest: dynamic SL/TP and position sizing with immediate test performance of many assets/strategies in one framework help optimize the risk-reward profile
Automated Strategy Switching: author developed unique feature allows to pick on the best-performing strategies in real-time and can backtest the logic behind switching them.
It designed to finding profitable habits in market behaviours and to cut out unprofitable ones
This combination, along with the developer’s extensive research and testing, sets the “Force of Multi Strategy” apart from many other trading solutions available on the market
Another usage example:
Tips that I found through tests: Last 4 trades say more about the next one #5 than 10 do about #11. You can use many instances of FoMS on one symbol. An attached example demonstrates how 4 instances of FoMS work with different filter settings (No Filters, ADX, ATR, TV.TR)
All instances have the same settings : Symbol: PEPE, Chart TF 15m, HTF Mult 4/8, InitCap $100, One trade $10/50 Leverage. Strategies switch based on the same logic : choosing a strategy that achieved an ROI ≥ 0.4 and a win rate ≥ 50% over the last 4 trades. As you can see: the TV.TR filter opened 24 trades with best P&L 118.9$. The ATR filter (no trade if ATR 5 / ATR 20 < 1.2) performed best 1.37 ROI, achieving a P&L 95.9$ with 9 trades in 20 days of backtest
Now you can choose the preferred option and create a new alert with the Webhook address provided by TTA. That’s all. The next signal from the strategy that meets the set ROI and WR criteria from the last 4 trades with the HTF filter will be executed by the script and sent to the Webhook address to open a position on the exchange
Keep in mind , script open a market orders and alerts have slight delay, some negative or positive difference (usually 3-10%, L50) in close trade result between alert and actual trade results is possible, alert message example: Close 1000PEPEUSDT C=LINEAR +2.27$ Buy 1000PEPEUSDT Q=13276.2944 SL=0.006545 TP=0.010168 L=50 D=2 C=LINEAR St:21
Might be important , this script generates alerts for market orders that are then executed on pre-configured crypto exchanges via the TTA service, along with native SL/TP orders
Finally:
There is no universal instruction or ‘how to’ for profitability in all markets at any time. However, I will continue researching and will share more tips in the future. I believe that FoMS’s capabilities can revolutionize your understanding of intraday trading
Invite-only status safeguards the author’s unique multi-strategy framework, unavailable in public scripts, ensuring users access tailored tools without imitation risks.
To get access please see the Author's instructions!
Wishing you successful trades! Stay tuned for updates
DISCLAIMER: No sharing, copying, reselling, modifying, or any other forms of use are authorized for this script, and the information published with them. This script is strictly for individual use. No one knows the future and Investments are always made at your own risk. I am not responsible for any losses you may incur. Before investment make sure that your logic is profitable on demo account

CTAY Hive Worker 3.3 ProfessionalCTAY Hive Worker 3.3 Professional
Intelligent DCA Strategy for Structured, Rule-Based Trading
The CTAY Hive Worker 3.3 Professional is an advanced TradingView strategy designed for systematic, transparent, and fully deterministic trading.
It combines RSI-based logic, multi-timeframe analysis, and sophisticated DCA and budget management to deliver controlled and reproducible trading behavior.
This strategy is built for traders who value clarity, consistency, and risk awareness over black-box automation — both in backtesting and live operation.
Key Features:
Intelligent RSI-Based Entries
• Configurable RSI entry logic
• Optional Median-RSI filtering to reduce market noise
• Supports both rebound-based and trend-continuation setups
Multi-Timeframe Architecture (MTF)
• Independent timeframes for entries, filters, and trend evaluation
• Automatic validation to prevent indicators from running below chart timeframe
• Full synchronization between chart, strategy logic, and alerts
Advanced DCA Management
• Multi-level safety orders with linear or geometric spacing
• Clear separation of base investment, DCA budget, and reinvest budgets
• Dynamic safeguards to prevent over-allocation
Reinvest & Capital Flow Logic
• Optional reinvestment of profits
• Separate handling of bot capital, order reinvestment, and savings
• Full transparency of all internal capital movements
Exit & Take-Profit Logic
• Fixed Take-Profit
• Optional Trailing Take-Profit
• Cycle-based exit logic for clean and traceable trade closures
Trend & Market Filters
• Optional trend filters (e.g. SuperTrend)
• Independent logic for uptrend and downtrend phases
• Helps avoid trades against dominant market conditions
Deterministic Strategy Design
• 100% reproducible behavior across backtests, replay mode, and live trading
• No asynchronous side effects
• Ideal for systematic analysis and optimization
Extensive Visualization & Debug Information
• Investment, profit, and status plots
• Detailed tables for trades, cycles, and statistics
• All relevant internal states visible directly on the chart
Alert & Automation Ready
• Designed for TradingView alert integration
• Compatible with external automation platforms (e.g. API-based broker execution)
⸻
Who Is CTAY Hive Worker For?
• Advanced traders focused on structured DCA strategies
• Users who require reliable backtests and deterministic live behavior
• Educational and seminar environments where transparency matters more than black-box automation
⸻
Important Notice – Limited Demo Version
This script is a limited demo version of CTAY Hive Worker 3.3 Professional.
Certain features and configuration options are restricted and provided for demonstration and evaluation purposes only.
This strategy is intended solely for educational, analytical, and demonstration use and does not constitute financial, investment, or tax advice.
⸻
More Information
For further information about CTAY Hive Worker licenses, training content, and background materials, please contact:
• Email: demo@ctay.io
• YouTube: CTAY – Crypto Trading Academy
www.youtube.com

RONBO UT Bot BUY - SELL 4h rangethis script will draw a box between the BUY and SELL signal from the UT BOT indicator
It will calculate the delta so you can see the provit or losses
