Cerca negli script per "bot"


A-Bot Promax 2026USER GUIDE – BUY & SELL (MULTI-TIMEFRAME)
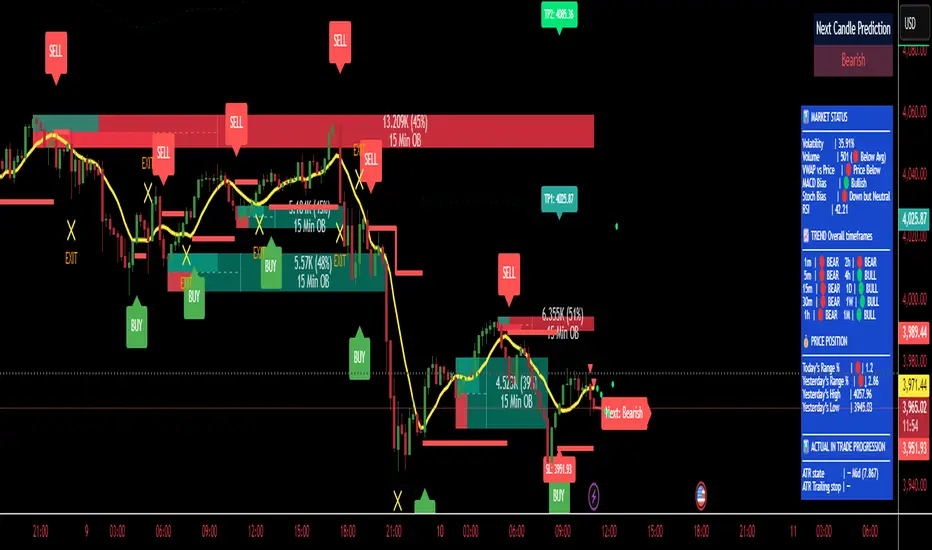
A-Bot Promax 2026 applies Multi-Timeframe Analysis with a TF × 3 confirmation rule.
🔹 BUY Setup
Select your preferred trading timeframe (TF).
When the white line generates a BUY signal, mark or note the exact candle/time.
Switch to the higher timeframe (HTF = TF × 3) for confirmation
Example: TF = Day → HTF = Week
TF = Week → HTF = Month
If the corresponding area on the HTF shows a green background, the BUY signal is considered valid.
Take profit / exit BUY when:
The HTF background turns red, or
The white line prints a SELL signal (from that point onward).
🔹 SELL Setup
Select your preferred trading timeframe (TF).
When the white line generates a SELL signal, mark or note the exact candle/time.
Switch to the higher timeframe (HTF = TF × 3) for confirmation.
If the corresponding area on the HTF shows a red background, the SELL signal is considered valid.
Take profit / exit SELL when:
The HTF background turns green, or
The white line prints a BUY signal (from that point onward).
⚠️ Disclaimer
This indicator is provided for educational and analytical purposes only. It does not constitute financial advice, investment recommendations, or guarantees of profit. Trading involves significant risk, and all trading decisions and outcomes are the sole responsibility of the user. The author assumes no liability for any losses incurred from the use of this indicator.

Tick-Tock (UT Bot Alert + Linear Regression Candles)The video stated to use LineReg Candels indicator combined with UT Bot Alerts
Setting the inputs to the defvalues i've setted
setting the chart on heiken ashi and a 30m interval
Have in mind to follow indicator signals as a strategy, the confirmation of the signal and the entry happen in the
next open. entering always late, yes but never failing and with automation possibilities. no fakouts real backtest
as proven by the backtest this is not a good strategy! i should make a ticktok strategies series to disprove them
Always backtest strategies published in ticktock! www.facebook.com
if you have more strategies from ticktok you want dissproven hit me.

Professional Grid & Reversal Bot v10 (Binance Style)Professional Grid & Reversal Bot v10 (Binance Style) – Open Source & Educational
About this Script:
This script is an advanced Grid Trading & Smart Reversal strategy, inspired by professional Binance-style execution. It is designed as an educational, open-source tool for traders who want to understand market dynamics, grid logic, and risk management.
How it Works:
1️⃣ Grid Execution:
• Divides the price range between the high and low into multiple levels (Grids).
• Opens Buy orders in the lower half and Sell orders in the upper half.
• Levels are calculated dynamically based on the highest and lowest prices over a selected lookback period.
2️⃣ Smart Reversal System:
• Detects price touches on the high or low range boundaries to identify potential reversal points.
• Opens Buy orders at the lows and Sell orders at the highs using a configurable confirmation percentage (revPct).
• Helps traders capture short-term price swings effectively.
3️⃣ Risk & Size Management:
• Position sizing based on USD amount and leverage.
• Automatic Take Profit (TP) and Stop Loss (SL) for every trade.
• Controls overtrading via the "pyramiding" parameter (max open trades).
4️⃣ Advanced Visualization:
• Plots the grid range with high/low levels and fills the background for clear context.
• Highlights potential Supply and Demand Zones.
• Displays a dynamic "Binance-style" Order Book table showing Side, Price, Quantity, and PnL.
5️⃣ Key Counters & Indicators:
• levelsArr → Stores all grid levels for execution and plotting.
• touchedHigh / touchedLow → Monitors range touches to trigger reversals.
• strategy.openprofit → Displays live open trade PnL directly on the chart.
Additional Features:
• Supports both English and Arabic languages.
• Dark Theme optimized for readability.
• Dynamic control panel updates on every bar.
• Flexible settings for Auto or Manual grid range updates.
User Guidance:
• This script is for educational purposes only; it does not guarantee profits.
• We recommend adjusting Grid Levels, Reversal Percentage, and Trade Size to experiment with different strategies.
Community Engagement:
• Suggestions and improvements are welcome! 💡
• If you have ideas for new features, let's develop them together to enhance learning.
• Please support the script with a Like & Boost if you find it useful.
• Encourages knowledge sharing to improve collective performance.
License:
Creative Commons Attribution-NonCommercial 4.0 International (CC BY-NC 4.0)
Free for educational use only. Please give credit to the author when sharing or modifying the script.

London Session + EMA 200 + UT BotCombined trading indicator featuring three powerful tools:🔵 London Session Box - Highlights the London trading session (0700-1600) with a customizable colored box to identify high-volume trading periods📈 EMA 200 - Exponential Moving Average for trend identification and dynamic support/resistance levels🎯 UT Bot - ATR-based trailing stop indicator with buy/sell signals and bar coloring for trend following

- Trading Bot - Stochastic MACD / SMA - Robot Strategy -Overview
This strategy is a complete algorithmic trading solution designed for traders looking to automate their positions on cryptocurrency or traditional markets. It combines the precision of the Stochastic Oscillator with the trend-following power of the MACD and a Multi-Timeframe SMA.
Unlike simple crossover strategies that often fail in ranging markets, this script uses a "Funnel Logic" to filter out low-probability trades, ensuring that entries are only taken when momentum and trend are aligned.
1. The Logic Behind the Strategy
The strategy operates on a three-layer confirmation system:
Layer 1: The Trend Filter (SMA MTF)
The strategy first checks the long-term trend using a Simple Moving Average (SMA).
Longs are only allowed if the price is above the SMA.
Shorts are only allowed if the price is below the SMA.
Note: You can select a higher timeframe for this SMA (e.g., viewing the 4H trend while trading on the 15m chart).
Layer 2: The Momentum Filter (MACD)
The MACD (Moving Average Convergence Divergence) ensures we are not trading against short-term momentum.
A Long signal requires the MACD line to be above the Signal line.
A Short signal requires the Signal line to be above the MACD line.
Layer 3: The Trigger (Stochastic)
Once the trend and momentum are validated, the strategy waits for a precise entry signal from the Stochastic Oscillator (%K and %D).
Entry: Occurs when the %K line crosses the defined threshold (e.g., oversold for longs).
Exit: Occurs when the %K line crosses the opposite threshold (e.g., 50% median line) or hits a Stop-Loss.
2. Key Features for Automation
This script is specifically engineered for third-party automation (custom webhooks) :
Clean Alert Messages: The comment= fields in the order alerts only contain the necessary entry/exit strings, keeping your logs clean.
JSON Data Plots: The script includes invisible plots (display.none) that output strategy values (leverage, quantity type, trade direction) specifically formatted to be picked up by dynamic placeholders in TradingView alerts.
Backtest Date Range: You can restrict the strategy to a specific date range to test performance over specific market cycles.
3. Risk Management & Safety
Stop-Loss: Configurable percentage-based Stop-Loss for Longs and Shorts.
Cooldown Mechanism: To prevent "revenge trading" or chopping in volatile markets, the script features a "Cooldown" system. If a Stop-Loss is hit, the strategy pauses for a set number of bars.
SMA Re-Cross Requirement: Optionally, you can force the strategy to wait for the price to re-cross the SMA after a cooldown before taking a new trade, adding an extra layer of safety.
4. How to use
Add the script to your chart (Recommended timeframes: 15m, 1h, 4h).
Open the settings to choose your Trading Mode (Long Only, Short Only, or Both).
Adjust the Stochastic and MACD settings to fit the volatility of your specific asset.
Enable the Filters (SMA/MACD) based on your preference.
Set up your alerts using the provided message placeholders for your trading bot.
Disclaimer
Past performance is not indicative of future results. This script is a tool for technical analysis and automation. Please use proper risk management and backtest thoroughly before using real funds.

ETH Trading bot H1 Money maker i dont know what i did but it is looking good ; make sure you arent in a trade before you start the bot

UT Bot Decimal + HA Signals + HA VWAP (Bold White Labels)Custom UT Bot with Built in VWAP and ability to use decimal sensitivity and signals fire off of Heikin Ashi candle

SMC + OB + FVG + Reversal + UT Bot + Hull Suite – by Fatich.id🎯 7 INTEGRATED SYSTEMS:
✓ Mxwll Suite (SMC + Auto Fibs + CHoCH/BOS)
✓ UT Bot (Trend Signals + Label Management)
✓ Hull Suite (Momentum Analysis)
✓ LuxAlgo FVG (Fair Value Gaps)
✓ LuxAlgo Order Blocks (Volume Pivots) ⭐ NEW
✓ Three Bar Reversal (Pattern Recognition)
✓ Reversal Signals (Momentum Count Style)
⚡ KEY FEATURES:
• Smart Money Structure (CHoCH/BOS/I-CHoCH/I-BoS)
• Auto Fibonacci (10 customizable levels)
• Order Block Detection (Auto mitigation)
• Fair Value Gap Tracking
• Session Highlights (NY/London/Asia)
• Volume Activity Dashboard
• Multi-Timeframe Support
• Clean Label Management
🎨 PERFECT FOR:
• Smart Money Concept Traders
• Order Flow & Liquidity Analysis
• Support/Resistance Trading
• Trend Following & Reversals
• Multi-Timeframe Analysis
💡 RECOMMENDED SETTINGS:
Clean Charts: OB Count 3, UT Signals 3, FVG 5
Detailed Analysis: OB Count 5-10, All Signals
Scalping: Low sensitivity, Hull 20-30
Swing Trading: High sensitivity, Hull 55-100

SFP + TP/SL + WT JSON BOT (Touch/Return)Smart Reversal Engine with Automated TP/SL & WunderTrading Integration
This invite-only indicator is designed for traders seeking highly responsive reversal detection and fully automated execution.
It combines multiple market conditions into a single confirmation system that identifies high-probability turning points with minimal delay.
The tool provides:
🔷 Key Features
✔ Real-time reversal detection
Signals are generated the moment specific market conditions align—no need to wait for candle closures.
This allows extremely early entries with minimal lag.
✔ Auto-calculated TP/SL levels
Profit-taking and protection levels are dynamically generated based on market structure.
Visual TP/SL lines appear directly on the chart for clarity.
✔ Backtesting suite
Last N trades statistics
Monthly performance summary (last 4 months)
Estimated PnL based on user-defined capital & leverage
On-chart TP/SL markers
Everything updates automatically as new signals appear.
✔ Fully automated execution through WunderTrading
When enabled, the indicator automatically sends structured JSON alerts compatible with WT bots:
Enter Long
Enter Short
Exit All
Including:
Market orders
Position size based on your capital settings
Exchange-level TP/SL placement
This allows the chart signals to translate directly into live trading actions.
🔷 Customization
Users can freely adjust:
Entry behavior mode
TP/SL model
Capital allocation
Leverage settings
Backtest window
Without exposing or modifying the underlying logic.
🔷 Notes
This script does not repaint after confirmation.
Real-time signals may update during candle formation (normal for intrabar processing).
Strategy logic is proprietary and not disclosed.
Access is invite-only.
If you would like access, contact me directly through TradingView messages.
Setup guide and WT integration instructions are provided for all subscribers.
智能反转引擎(Smart Reversal Engine)+ 自动 TP/SL + WunderTrading 全自动交易接口
这是一个 邀请制(Invite-Only) 指标,专为追求高响应性反转信号、自动化交易执行的用户打造。
它将多重市场条件整合成统一的判定系统,在极短延迟下识别潜在的高概率转折点。
不会披露策略逻辑、指标原理或内部结构。
🔷 主要功能
✔ 实时反转信号(无需等待收线)
当关键市场条件同时满足时,系统会即时给出提醒。
适用于希望提前布局、减少延迟的交易者。
✔ 自动计算 TP / SL
止盈/止损根据市场位置自动生成,图表上清晰显示,仅需跟随即可。
无需手动测量价格距离。
✔ 完整回测统计系统
最近 N 笔交易统计
最近 4 个月月度表现
根据本金与杠杆估算的 PnL
每一笔 TP / SL 自动打标
所有统计数据均实时更新。
✔ 完整支持 WunderTrading 全自动下单
启用后可自动发送结构化 JSON 信号,包括:
开多
开空
全部平仓
并自动附带:
市价单
依照用户设置的手数 / 杠杆
交易所级别 TP / SL 挂单
实现从图表信号 → 自动交易执行的全流程自动化。
🔷 自定义设置
你可以自由调整:
入场模式
TP/SL 比例
本金
杠杆
回测窗口长度
无需触碰或理解核心逻辑。
🔷 注意事项
指标在信号确认后不会重绘
实时信号在未收线时可能动态变化(属正常现象)
核心算法为私有内容,不会公开
采用 Invite-Only 授权方式

UT Bot (Combo)UT Bot (Combo), SoniR" can either stand for Sonic R, a technical indicator in trading, or Sonic, a new layer 1 blockchain platform developed from Fantom. Depending on the context, sonic R is a technical indicator used to analyze gold price trends based on EMAs (like EMA 34, 89, and 200). In contrast, Sonic is an EVM-compatible blockchain, capable of fast transaction processing.

4H RSI Buy/Sell BotBelow is a clean TradingView Pine Script v5 bot that analyzes the 4-hour timeframe and triggers alerts based on RSI (even though you mentioned RCI—if you actually need RCI, tell me and I’ll rewrite it)

Pivot Alert Bot - Multi-TimeframeOverview
Pivot Alert Bot automatically detects and labels pivot highs and pivot lows as they confirm across multiple timeframes. Designed for active traders who want clean, actionable signals without chart clutter.
Two-Tier Pivot System
📍 Main Pivots (Length 20)
Confirmed swing points that have proven themselves with 20 bars of price action on each side. Marked with clean PH (Pivot High) and PL (Pivot Low) labels. These are your high-conviction levels.
⭐ Temporary Pivots (Length 3)
Early-stage pivots marked with ***** labels in blue. These signal potential reversals before full confirmation — ideal for aggressive entries with tighter stops.
How to Trade
The indicator is built around a simple pivot-to-pivot strategy:
🔴 Short Setup: Enter short at a Pivot High → Target the previous Pivot Low
🟢 Long Setup: Enter long at a Pivot Low → Target the previous Pivot High
This approach gives you logical, structure-based profit targets instead of arbitrary calculations.
Multi-Timeframe Support
Scan for setups across:
⚡ 5 minute — Scalping and quick intraday moves
📊 15 minute — Primary day trading timeframe
📊 30 minute — Confirmation and larger moves
⏱️ 1 hour — Context and swing trade setups
Built-In Alerts
Never miss a pivot. Alert conditions included for:
Main Pivot High confirmed
Main Pivot Low confirmed
Temporary Pivot High detected
Temporary Pivot Low detected
Set alerts once and get notified on any timeframe.
Best Used On
High-volume, liquid instruments: SPY, QQQ, NVDA, TSLA, AMD, META, AMZN, COIN, and similar names with clean price action.
Settings
Adjustable pivot lengths for both main and temporary pivots
Toggle temporary pivot visibility on/off
Customizable label colors and sizes

stormytrading orb botshows entries for 15m orb based on 5m break and retest made solely for mnq or nq, works good with smt
shows trades for ldn, nyc, nyc overlap and Asia session, pls follow stormy trading on insta for more

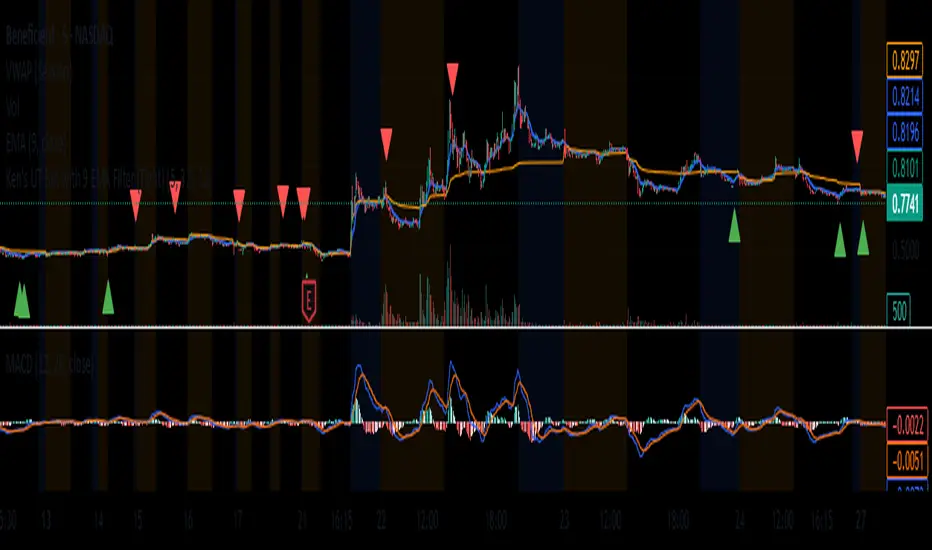
Inyerneck UT Bot with 9 EMA Filter With Signals (Tight) v: 4.20this script is a customized version of the UT bot, enhanced with 9ema trend filter for cleaner entries.designed for short term traders to reduce noise and avoid false signals during choppy price action. youll only see signals when price action confirms momentum aligned with trend as defined by EMA. try adjusting sensitivity and ATR period to your liking. my current setting is ATR 6,Sensitivity 3.8,EMA 9 to 11...

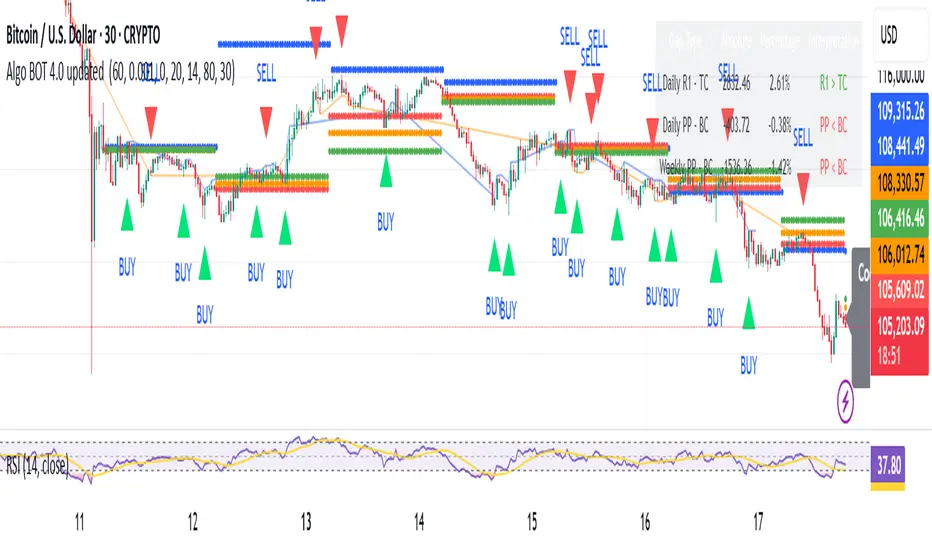
Algo BOT 4.0 updated Strategy Description:
Algo BOT 4.0 updated is a sophisticated multi-timeframe trading strategy that identifies high-probability reversal points using technical confluence. The strategy combines:
Core Components:
Multi-timeframe Pivot Analysis: Daily, Weekly, and Monthly pivot points with CPR (Central Pivot Range)
RSI Momentum Filter: Higher timeframe RSI (user-configurable) for trend bias
VWAP Dynamics: Volume-weighted average price with moving averages
Fibonacci Strength Analysis: Candle close positions relative to 38.2% Fib levels
Advanced Cooldown System: Prevents overtrading with dynamic gap requirements
Entry Logic:
Long Entries: RSI < 57 with bullish candle structure at key support levels
Short Entries: RSI > 43 with bearish candle structure at key resistance levels
Zone-based Filtering: Identifies trades near significant pivot points (D PP, D R1, D S1, W PP, M PP, VWAP)
Risk Management:
Dynamic cooldown periods between trades
Gap-based entry optimization to ensure sufficient price movement
Extreme price tracking for better entry timing
Multi-condition validation to reduce false signals
Alert System:
Real-time alerts for both long and short entries
Includes price, RSI value, and zone information
Visual signals with triangle markers on chart
Comprehensive status monitoring with cooldown timer
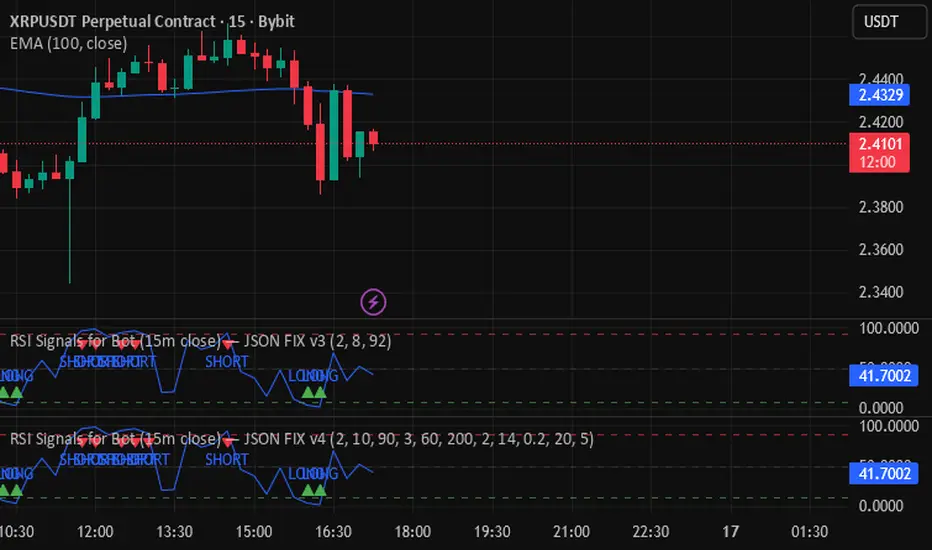
RSI Signals for Bot (15m close) — JSON FIX v4RSI Signals for Bot (JSON Ready) is a lightweight automation-friendly indicator that generates clean LONG and SHORT alerts based on RSI thresholds, fully formatted in JSON for webhook-based trading bots.
It’s designed primarily for 15-minute charts and sends one alert per confirmed bar close.
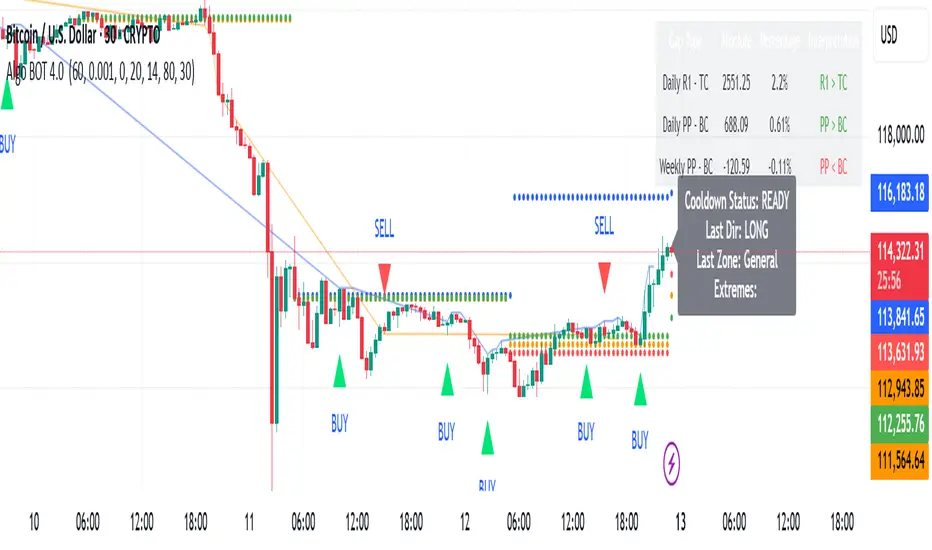
Algo BOT 4.0 Strategy Description:
Algo BOT 4.0 is a sophisticated multi-timeframe trading strategy that identifies high-probability reversal points using technical confluence. The strategy combines:
Core Components:
Multi-timeframe Pivot Analysis: Daily, Weekly, and Monthly pivot points with CPR (Central Pivot Range)
RSI Momentum Filter: Higher timeframe RSI (user-configurable) for trend bias
VWAP Dynamics: Volume-weighted average price with moving averages
Fibonacci Strength Analysis: Candle close positions relative to 38.2% Fib levels
Advanced Cooldown System: Prevents overtrading with dynamic gap requirements
Entry Logic:
Long Entries: RSI < 57 with bullish candle structure at key support levels
Short Entries: RSI > 43 with bearish candle structure at key resistance levels
Zone-based Filtering: Identifies trades near significant pivot points (D PP, D R1, D S1, W PP, M PP, VWAP)
Risk Management:
Dynamic cooldown periods between trades
Gap-based entry optimization to ensure sufficient price movement
Extreme price tracking for better entry timing
Multi-condition validation to reduce false signals
Alert System:
Real-time alerts for both long and short entries
Includes price, RSI value, and zone information
Visual signals with triangle markers on chart
Comprehensive status monitoring with cooldown timer
RUFUS GOLD BOT - TP/SL/ExitRUFUS GOLD BOT – Buy, Sell, and Exit (80% Accuracy)
This powerful indicator provides clear Buy, Sell, and Exit signals based on proven price action patterns, offering traders a simple yet effective tool for decision-making. With an impressive 80% accuracy rate, it helps identify high-probability trade setups and manage exits for optimal profits.
RSI Signals for Bot (15m close) — JSON FIX v3Bybit Bot RSi:
a lookback indicator that searches for potential short/long plays based on length parameters.

Ravi Raj rending Intraday BotTrend Reversal Catching
🔹 Features:
✅ Buy & Sell signals with proper confirmation
✅ Dynamic support & resistance levels
✅ Trend direction + reversal detection
✅ Risk management (Stop Loss & Target levels)
✅ Works on Nifty, BankNifty, Stocks & Options
🔹 Best Timeframe:
5 Min, 15 Min (Intraday Trading)
Works on both Index & Equity
🔹 Trading Style:
Scalping
Momentum Trading
Ravi Raj rending Intraday Bot
8102106608 udhwa
