RSI Trend CryptoDear community,
Today I want to present you one of my favorite and simple trading bots: The RSI Trend.
This bot is based on the RSI, which normally is used as a trend reversal indicator. However, here it’s used as a trend finding indicator, often with great success. This bot making long-only trades, which is quite successful in bull-markets like the one we’re currently in.
In case you want to use an emergency exit for your trade, toggle the Emergency Exit parameter. During bull-markets it’s better in the long term to keep this option off.
Currently the bot only makes one trade at a time (pyramiding = 1), for higher risk and higher rewards you can increase this parameter. More than 5 is not advised.
I’ve optimized this bot on 15min time frame. It has some decent results for most cryptos on this TF, feel free to test this out.
In case you want to hook this bot up to your exchange, feel free to edit the ALERT messages in the code.
Default Trading Rules:
Long: RSI crosses over 35
Close Long: RSI crosses under 75
Emergency Exit: RSI crosses under 10
Cerca negli script per "bot"

Ruckard TradingLatinoThis strategy tries to mimic TradingLatino strategy.
The current implementation is beta.
Si hablas castellano o espanyol por favor consulta MENSAJE EN CASTELLANO más abajo.
It's aimed at BTCUSDT pair and 4h timeframe.
STRATEGY DEFAULT SETTINGS EXPLANATION
max_bars_back=5000 : This is a random number of bars so that the strategy test lasts for one or two years
calc_on_order_fills=false : To wait for the 4h closing is too much. Try to check if it's worth entering a position after closing one. I finally decided not to recheck if it's worth entering after an order is closed. So it is false.
calc_on_every_tick=false
pyramiding=0 : We only want one entry allowed in the same direction. And we don't want the order to scale by error.
initial_capital=1000 : These are 1000 USDT. By using 1% maximum loss per trade and 7% as a default stop loss by using 1000 USDT at 12000 USDT per BTC price you would entry with around 142 USDT which are converted into: 0.010 BTC . The maximum number of decimal for contracts on this BTCUSDT market is 3 decimals. E.g. the minimum might be: 0.001 BTC . So, this minimal 1000 amount ensures us not to entry with less than 0.001 entries which might have happened when using 100 USDT as an initial capital.
slippage=1 : Binance BTCUSDT mintick is: 0.01. Binance slippage: 0.1 % (Let's assume). TV has an integer slippage. It does not have a percentage based slippage. If we assume a 1000 initial capital, the recommended equity is 142 which at 11996 USDT per BTC price means: 0.011 BTC. The 0.1% slippage of: 0.011 BTC would be: 0.000011 . This is way smaller than the mintick. So our slippage is going to be 1. E.g. 1 (slippage) * 0.01 (mintick)
commission_type=strategy.commission.percent and commission_value=0.1 : According to: binance . com / en / fee / schedule in VIP 0 level both maker and taker fees are: 0.1 %.
BACKGROUND
Jaime Merino is a well known Youtuber focused on crypto trading
His channel TradingLatino
features monday to friday videos where he explains his strategy.
JAIME MERINO STANCE ON BOTS
Jaime Merino stance on bots (taken from memory out of a 2020 June video from him):
'~
You know. They can program you a bot and it might work.
But, there are some special situations that the bot would not be able to handle.
And, I, as a human, I would handle it. And the bot wouldn't do it.
~'
My long term target with this strategy script is add as many
special situations as I can to the script
so that it can match Jaime Merino behaviour even in non normal circumstances.
My alternate target is learn Pine script
and enjoy programming with it.
WARNING
This script might be bigger than other TradingView scripts.
However, please, do not be confused because the current status is beta.
This script has not been tested with real money.
This is NOT an official strategy from Jaime Merino.
This is NOT an official strategy from TradingLatino . net .
HOW IT WORKS
It basically uses ADX slope and LazyBear's Squeeze Momentum Indicator
to make its buy and sell decisions.
Fast paced EMA being bigger than slow paced EMA
(on higher timeframe) advices going long.
Fast paced EMA being smaller than slow paced EMA
(on higher timeframe) advices going short.
It finally add many substrats that TradingLatino uses.
SETTINGS
__ SETTINGS - Basics
____ SETTINGS - Basics - ADX
(ADX) Smoothing {14}
(ADX) DI Length {14}
(ADX) key level {23}
____ SETTINGS - Basics - LazyBear Squeeze Momentum
(SQZMOM) BB Length {20}
(SQZMOM) BB MultFactor {2.0}
(SQZMOM) KC Length {20}
(SQZMOM) KC MultFactor {1.5}
(SQZMOM) Use TrueRange (KC) {True}
____ SETTINGS - Basics - EMAs
(EMAS) EMA10 - Length {10}
(EMAS) EMA10 - Source {close}
(EMAS) EMA55 - Length {55}
(EMAS) EMA55 - Source {close}
____ SETTINGS - Volume Profile
Lowest and highest VPoC from last three days
is used to know if an entry has a support
VPVR of last 100 4h bars
is also taken into account
(VP) Use number of bars (not VP timeframe): Uses 'Number of bars {100}' setting instead of 'Volume Profile timeframe' setting for calculating session VPoC
(VP) Show tick difference from current price {False}: BETA . Might be useful for actions some day.
(VP) Number of bars {100}: If 'Use number of bars (not VP timeframe)' is turned on this setting is used to calculate session VPoC.
(VP) Volume Profile timeframe {1 day}: If 'Use number of bars (not VP timeframe)' is turned off this setting is used to calculate session VPoC.
(VP) Row width multiplier {0.6}: Adjust how the extra Volume Profile bars are shown in the chart.
(VP) Resistances prices number of decimal digits : Round Volume Profile bars label numbers so that they don't have so many decimals.
(VP) Number of bars for bottom VPOC {18}: 18 bars equals 3 days in suggested timeframe of 4 hours. It's used to calculate lowest session VPoC from previous three days. It's also used as a top VPOC for sells.
(VP) Ignore VPOC bottom advice on long {False}: If turned on it ignores bottom VPOC (or top VPOC on sells) when evaluating if a buy entry is worth it.
(VP) Number of bars for VPVR VPOC {100}: Number of bars to calculate the VPVR VPoC. We use 100 as Jaime once used. When the price bounces back to the EMA55 it might just bounce to this VPVR VPoC if its price it's lower than the EMA55 (Sells have inverse algorithm).
____ SETTINGS - ADX Slope
ADX Slope
help us to understand if ADX
has a positive slope, negative slope
or it is rather still.
(ADXSLOPE) ADX cut {23}: If ADX value is greater than this cut (23) then ADX has strength
(ADXSLOPE) ADX minimum steepness entry {45}: ADX slope needs to be 45 degrees to be considered as a positive one.
(ADXSLOPE) ADX minimum steepness exit {45}: ADX slope needs to be -45 degrees to be considered as a negative one.
(ADXSLOPE) ADX steepness periods {3}: In order to avoid false detection the slope is calculated along 3 periods.
____ SETTINGS - Next to EMA55
(NEXTEMA55) EMA10 to EMA55 bounce back percentage {80}: EMA10 might bounce back to EMA55 or maybe to 80% of its complete way to EMA55
(NEXTEMA55) Next to EMA55 percentage {15}: How much next to the EMA55 you need to be to consider it's going to bounce back upwards again.
____ SETTINGS - Stop Loss and Take Profit
You can set a default stop loss or a default take profit.
(STOPTAKE) Stop Loss % {7.0}
(STOPTAKE) Take Profit % {2.0}
____ SETTINGS - Trailing Take Profit
You can customize the default trailing take profit values
(TRAILING) Trailing Take Profit (%) {1.0}: Trailing take profit offset in percentage
(TRAILING) Trailing Take Profit Trigger (%) {2.0}: When 2.0% of benefit is reached then activate the trailing take profit.
____ SETTINGS - MAIN TURN ON/OFF OPTIONS
(EMAS) Ignore advice based on emas {false}.
(EMAS) Ignore advice based on emas (On closing long signal) {False}: Ignore advice based on emas but only when deciding to close a buy entry.
(SQZMOM) Ignore advice based on SQZMOM {false}: Ignores advice based on SQZMOM indicator.
(ADXSLOPE) Ignore advice based on ADX positive slope {false}
(ADXSLOPE) Ignore advice based on ADX cut (23) {true}
(STOPTAKE) Take Profit? {false}: Enables simple Take Profit.
(STOPTAKE) Stop Loss? {True}: Enables simple Stop Loss.
(TRAILING) Enable Trailing Take Profit (%) {True}: Enables Trailing Take Profit.
____ SETTINGS - Strategy mode
(STRAT) Type Strategy: 'Long and Short', 'Long Only' or 'Short Only'. Default: 'Long and Short'.
____ SETTINGS - Risk Management
(RISKM) Risk Management Type: 'Safe', 'Somewhat safe compound' or 'Unsafe compound'. ' Safe ': Calculations are always done with the initial capital (1000) in mind. The maximum losses per trade/day/week/month are taken into account. ' Somewhat safe compound ': Calculations are done with initial capital (1000) or a higher capital if it increases. The maximum losses per trade/day/week/month are taken into account. ' Unsafe compound ': In each order all the current capital is gambled and only the default stop loss per order is taken into account. That means that the maximum losses per trade/day/week/month are not taken into account. Default : 'Somewhat safe compound'.
(RISKM) Maximum loss per trade % {1.0}.
(RISKM) Maximum loss per day % {6.0}.
(RISKM) Maximum loss per week % {8.0}.
(RISKM) Maximum loss per month % {10.0}.
____ SETTINGS - Decimals
(DECIMAL) Maximum number of decimal for contracts {3}: How small (3 decimals means 0.001) an entry position might be in your exchange.
EXTRA 1 - PRICE IS IN RANGE indicator
(PRANGE) Print price is in range {False}: Enable a bottom label that indicates if the price is in range or not.
(PRANGE) Price range periods {5}: How many previous periods are used to calculate the medians
(PRANGE) Price range maximum desviation (%) {0.6} ( > 0 ): Maximum positive desviation for range detection
(PRANGE) Price range minimum desviation (%) {0.6} ( > 0 ): Mininum negative desviation for range detection
EXTRA 2 - SQUEEZE MOMENTUM Desviation indicator
(SQZDIVER) Show degrees {False}: Show degrees of each Squeeze Momentum Divergence lines to the x-axis.
(SQZDIVER) Show desviation labels {False}: Whether to show or not desviation labels for the Squeeze Momentum Divergences.
(SQZDIVER) Show desviation lines {False}: Whether to show or not desviation lines for the Squeeze Momentum Divergences.
EXTRA 3 - VOLUME PROFILE indicator
WARNING: This indicator works not on current bar but on previous bar. So in the worst case it might be VP from 4 hours ago. Don't worry, inside the strategy calculus the correct values are used. It's just that I cannot show the most recent one in the chart.
(VP) Print recent profile {False}: Show Volume Profile indicator
(VP) Avoid label price overlaps {False}: Avoid label prices to overlap on the chart.
EXTRA 4 - ZIGNALY SUPPORT
(ZIG) Zignaly Alert Type {Email}: 'Email', 'Webhook'. ' Email ': Prepare alert_message variable content to be compatible with zignaly expected email content format. ' Webhook ': Prepare alert_message variable content to be compatible with zignaly expected json content format.
EXTRA 5 - DEBUG
(DEBUG) Enable debug on order comments {False}: If set to true it prepares the order message to match the alert_message variable. It makes easier to debug what would have been sent by email or webhook on each of the times an order is triggered.
HOW TO USE THIS STRATEGY
BOT MODE: This is the default setting.
PROPER VOLUME PROFILE VIEWING: Click on this strategy settings. Properties tab. Make sure Recalculate 'each time the order was run' is turned off.
NEWBIE USER: (Check PROPER VOLUME PROFILE VIEWING above!) You might want to turn on the 'Print recent profile {False}' setting. Alternatively you can use my alternate realtime study: 'Resistances and supports based on simplified Volume Profile' but, be aware, it might consume one indicator.
ADVANCED USER 1: Turn on the 'Print price is in range {False}' setting and help us to debug this subindicator. Also help us to figure out how to include this value in the strategy.
ADVANCED USER 2: Turn on the all the (SQZDIVER) settings and help us to figure out how to include this value in the strategy.
ADVANCED USER 3: (Check PROPER VOLUME PROFILE VIEWING above!) Turn on the 'Print recent profile {False}' setting and report any problem with it.
JAIME MERINO: Just use the indicator as it comes by default. It should only show BUY signals, SELL signals and their associated closing signals. From time to time you might want to check 'ADVANCED USER 2' instructions to check that there's actually a divergence. Check also 'ADVANCED USER 1' instructions for your amusement.
EXTRA ADVICE
It's advised that you use this strategy in addition to these two other indicators:
* Squeeze Momentum Indicator
* ADX
so that your chart matches as close as possible to TradingLatino chart.
ZIGNALY INTEGRATION
This strategy supports Zignaly email integration by default. It also supports Zignaly Webhook integration.
ZIGNALY INTEGRATION - Email integration example
What you would write in your alert message:
||{{strategy.order.alert_message}}||key=MYSECRETKEY||
ZIGNALY INTEGRATION - Webhook integration example
What you would write in your alert message:
{ {{strategy.order.alert_message}} , "key" : "MYSECRETKEY" }
CREDITS
I have reused and adapted some code from
'Directional Movement Index + ADX & Keylevel Support' study
which it's from TradingView console user.
I have reused and adapted some code from
'3ema' study
which it's from TradingView hunganhnguyen1193 user.
I have reused and adapted some code from
'Squeeze Momentum Indicator ' study
which it's from TradingView LazyBear user.
I have reused and adapted some code from
'Strategy Tester EMA-SMA-RSI-MACD' study
which it's from TradingView fikira user.
I have reused and adapted some code from
'Support Resistance MTF' study
which it's from TradingView LonesomeTheBlue user.
I have reused and adapted some code from
'TF Segmented Linear Regression' study
which it's from TradingView alexgrover user.
I have reused and adapted some code from
"Poor man's volume profile" study
which it's from TradingView IldarAkhmetgaleev user.
FEEDBACK
Please check the strategy source code for more detailed information
where, among others, I explain all of the substrats
and if they are implemented or not.
Q1. Did I understand wrong any of the Jaime substrats (which I have implemented)?
Q2. The strategy yields quite profit when we should long (EMA10 from 1d timeframe is higher than EMA55 from 1d timeframe.
Why the strategy yields much less profit when we should short (EMA10 from 1d timeframe is lower than EMA55 from 1d timeframe)?
Any idea if you need to do something else rather than just reverse what Jaime does when longing?
FREQUENTLY ASKED QUESTIONS
FAQ1. Why are you giving this strategy for free?
TradingLatino and his fellow enthusiasts taught me this strategy. Now I'm giving back to them.
FAQ2. Seriously! Why are you giving this strategy for free?
I'm confident his strategy might be improved a lot. By keeping it to myself I would avoid other people contributions to improve it.
Now that everyone can contribute this is a win-win.
FAQ3. How can I connect this strategy to my Exchange account?
It seems that you can attach alerts to strategies.
You might want to combine it with a paying account which enable Webhook URLs to work.
I don't know how all of this works right now so I cannot give you advice on it.
You will have to do your own research on this subject. But, be careful. Automating trades, if not done properly,
might end on you automating losses.
FAQ4. I have just found that this strategy by default gives more than 3.97% of 'maximum series of losses'. That's unacceptable according to my risk management policy.
You might want to reduce default stop loss setting from 7% to something like 5% till you are ok with the 'maximum series of losses'.
FAQ5. Where can I learn more about your work on this strategy?
Check the source code. You might find unused strategies. Either because there's not a substantial increases on earnings. Or maybe because they have not been implemented yet.
FAQ6. How much leverage is applied in this strategy?
No leverage.
FAQ7. Any difference with original Jaime Merino strategy?
Most of the times Jaime defines an stop loss at the price entry. That's not the case here. The default stop loss is 7% (but, don't be confused it only means losing 1% of your investment thanks to risk management). There's also a trailing take profit that triggers at 2% profit with a 1% trailing.
FAQ8. Why this strategy return is so small?
The strategy should be improved a lot. And, well, backtesting in this platform is not guaranteed to return theoric results comparable to real-life returns. That's why I'm personally forward testing this strategy to verify it.
MENSAJE EN CASTELLANO
En primer lugar se agradece feedback para mejorar la estrategia.
Si eres un usuario avanzado y quieres colaborar en mejorar el script no dudes en comentar abajo.
Ten en cuenta que aunque toda esta descripción tenga que estar en inglés no es obligatorio que el comentario esté en inglés.
CHISTE - CASTELLANO
¡Pero Jaime!
¡400.000!
¡Tu da mun!

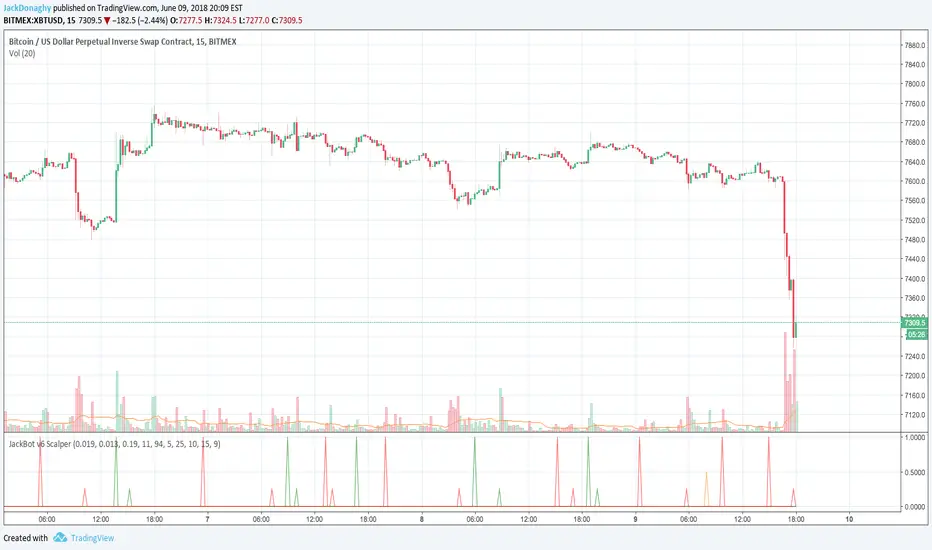
JackBot Scalper v6Jackbot Scalper v6 Update
In Version 6, Jackbot has improved performance on higher time frames with close to 85% success rate on 1-hour times frames and 70% success rate on 15-minute time frames.
Who
I am Jack Donaghy, a crypto trader and wealth strategist at an international asset management firm. I have traded billions in assets for clients and have grown a portfolio of personal assets by nearly 2200% within the last 1.5 years from trading. I originally invested in cryptocurrencies in November of 2016 and have been catching waves ever since. This bot is for those interested in scalping methods.
What
Jackbot Pro Scalper is a scalping study for Bitcoin that operates on small timeframes. It has a 60-70% success rate and operates with the goal of maximizing gains while minimizing losses. This bot works well with leveraged strategies as it pursues both long and short positions. While I primarily use the bot on BitMex, I have seen good success on Bitfinex with various USDT pairs including VEN and ETH.
When
With v6, the best results have come from 13, 15, and 17-minute charts with incredible success found on the 1-hour charts.
How
The bot works by 1. Defining its entry point. 2. Defining a take profit 3. Defining a stop loss. The magic of the bot is that it will not close a trade at the take profit, if volume and price are increasing, it will hold the exit until another indicator determines a reversal of the trend. More than that would ruin the logic so you will just have to see for yourself.
To Trade
Large Spikes = Entries (Green = Long, Red = Short)
Small Spikes = Take Profit (Green = Long Exit, Red = Short Exit)
Medium Spikes = Stop Loss (Purple = Long SL, Yellow = Short SL)
Previous Results
Backtested, Jackbot v6 shows that with 1 Bitcoin (unleveraged) you can make about 12K in a 1.5 month period. My personal experience was trading a test amount of Bitcoin on a particularly good run at 25x leverage using 25% of a test portfolio It went from 0.015 Bitcoin to 0.091 within 10 days. See ibb.co (This test was from V5.4 which V6 has improved upon.)
Disclaimer: This strategy is by no means perfect and not every trade will be a winner. It is a tool in your belt, not a perfect 100% trader. Previously, results show with a 25x leveraged position, the losses are ~20% before it will cut off the trade, however, the gains can be 40%+ (As the bot continues to run in certain conditions, it will often pick up major moves and hold them for longer.) It can have bad runs and a slew of poor entries, especially in tight volatile ranges.
PLEASE NOTE: This strategy can struggle with chop following major moves, if you are manually entering, consider other market conditions before entry if the price is in a tight range.
Cost
Jackbot will be offered for 0.1 Bitcoin and will be limited to the first 100 people who apply.
JackBot Scalper V5.4 Who
I am Jack Donaghy, a crypto trader and wealth strategist at an international asset management firm. I have traded billions in assets for clients and have grown a portfolio of personal assets by nearly 2200% within the last 1.5 years from trading. I originally invested in cryptocurrencies in November of 2016 and been catching waves ever since. This bot is for those interested in scalping methods.
What
Jackbot Pro Scalper is scalping study for bitcoin that operates on small timeframes. It has a 60-70% success rate and operates with the goal of maximizing gains while minimizing losses. This bot works well with leveraged strategies as pursues both long and short positions. While I primarily use it on BitMex, I have seen good success on Bitfinex.
When
5-30 minute charts, longer time frames can work but have not been successful enough to warrant publishing. Best results have come from 13 and 17-minute timeframes.
How
The bot works by 1. Defining its entry point. 2. Defining a take profit 3. Defining a stop loss. The magic of the bot is that it will not close a trade at the take profit, if volume and price are increasing, it will hold the exit until another indicator determines a reversal of the trend. More than that would ruin the logic so you will just have to see for yourself.
To Trade
Large Spikes = Entries (Green = Long, Red = Short)
Small Spikes = Take Profit (Green = Long Exit, Red = Short Exit)
Medium Spikes = Stop Loss (Purple = Long SL, Yellow = Short SL)
Previous Results
Backtested, this bot shows that with 1 Bitcoin (unleveraged) you can make about 10K in a 1.5 month period. My personal experience was trading a test amount of bitcoin on a particularly good run at 25x leverage using 25% of a test portfolio It went from 0.015 bitcoin to 0.091 within 10 days. See ibb.co
Disclaimer: This strategy is by no means perfect and not every trade will be a winner. Previously results show with a 25x leveraged position, the losses are ~20% before it will cut off the trade, however, the gains can be 40%+ (As the bot continues to run in certain conditions, it will often pick up major moves and hold them for longer.) It can have bad runs and a slew of poor entries, especially in tight volatile ranges.
PLEASE NOTE: This strategy can struggle with chop following major moves, if you are manually entering, consider other market conditions before entry if the price is in a tight range.

THE TRADE MEISTER PROTOCOL - VOLUME PROFILE EDITIONTHE TRADE MEISTER PROTOCOL - VOLUME PROFILE EDITION
The ATM Protocol is a regime-filtered trading framework that solves the fundamental problem causing retail trader losses: taking counter-trend signals during unfavorable market conditions.
It's a unified decision-making system where trade signals must pass through multiple layers of confirmation before execution. The core innovation is the Regime Filter - a proprietary logic system that gates all trade signals through RSI momentum states AND VWAP swing structure confirmation. Signals that fire during opposing regimes are blocked and marked with an X on your chart.
1. Regime Filter System - Multi-layered confirmation logic requiring RSI momentum (threshold-optimized at 65/32) AND VWAP swing alignment before allowing UT Bot signals to execute. When conditions don't align, signals are rejected in real-time.
2. Automated Trade Setup Calculator - Proprietary algorithm that scans support/resistance structure (100/500/1000-bar lookbacks), identifies nearest structural levels for stop placement, calculates two profit targets, and displays live Risk:Reward ratios. Falls back to ATR-based calculations when structure is absent.
3. Adaptive VWAP with Volatility Adjustment - Custom implementation using alpha decay functions and ATR-based volatility ratios to adjust tracking periods dynamically. Resets on swing highs/lows rather than session anchors, rendered as polylines for clarity.
Volume Profile Integration adds institutional context: Session-based profiling (Tokyo/London/NY/Daily/Weekly/Monthly/Quarterly/Yearly) with POC/VAH/VAL identification shows where institutions actually traded, not just where price went. Supports both Volume and Open Interest data types for futures traders.
Longevity Zone Tracking displays support/resistance age in Days/Months/Years with automatic violation removal, helping identify which levels have institutional significance based on duration.
The Problem This Solves
Most traders struggle with conflicting signals. RSI says oversold, MACD shows bearish, volume is declining, VWAP is below price - which do you trust? The result: analysis paralysis or worse, taking every signal and getting chopped to pieces.
The ATM Protocol's solution: Create a hierarchy where signals must satisfy multiple conditions simultaneously. The regime filter acts as the gatekeeper - no signal executes unless the market regime confirms the direction.
How the Regime Filter Works
The regime filter operates in three stages:
Stage 1 - RSI Momentum Assessment:
- RSI crossing above 65 while price shows upward EMA momentum = Bullish Regime
- RSI dropping below 32 with downward price momentum = Bearish Regime
- Neither condition = Neutral (no directional bias)
Stage 2 - VWAP Swing Structure:
- Most recent swing high > most recent swing low = VWAP Bullish
- Most recent swing low > most recent swing high = VWAP Bearish
- Uses 50-period swing detection (configurable)
Stage 3 - Signal Filtration:
- UT Bot buy signals only execute when: Bullish Regime + VWAP Bullish
- UT Bot sell signals only execute when: Bearish Regime + VWAP Bearish
- All other signals are rejected and marked
You can disable the filter or remove VWAP requirement in settings for more aggressive trading, but the default configuration prioritizes quality over quantity.
Volume Profile: Institutional Context
Standard indicators show where price moved. Volume Profile shows where volume accumulated - revealing where institutions made decisions.
Key Levels Explained:
Point of Control (POC): The price level with the most volume during the session. Institutions traded most heavily here. Acts as magnetic support/resistance.
Value Area High (VAH) / Value Area Low (VAL): The price range containing 70% of the session's volume (configurable). This is the "fair value" zone where institutions accepted prices.
Trading Above VAH: Bullish - price accepted above value, new buyers stepping in
Trading Below VAL: Bearish - price rejected, sellers in control
Inside Value Area: Choppy - expect range-bound behavior until breakout
Session Types:
- Intraday (Tokyo/London/NY): See where each major forex session traded
- Daily: Traditional market profile view
- Weekly/Monthly: Swing traders, identify major accumulation zones
- Quarterly/Yearly: Position traders, institutional long-term levels
The Volume Profile uses intra-bar data for precision and supports Open Interest for futures markets, showing delta OI changes that reveal institutional positioning in derivatives.
Automated Trade Setup Calculator
This is where theory becomes execution. When the regime filter confirms a setup, the calculator automatically:
For Long Setups:
1. Scans support levels (100, 500, 1000-bar lows)
2. Places stop at nearest support below current price
3. Identifies next two resistance levels above for targets
4. Calculates R:R ratio (Target 1 distance / Stop distance)
5. Displays all values in the dashboard in real-time
For Short Setups:
1. Scans resistance levels (100, 500, 1000-bar highs)
2. Places stop at nearest resistance above current price
3. Identifies next two support levels below for targets
4. Calculates R:R ratio
5. Updates live as price moves
Fallback Logic: If no structural levels exist nearby (new market, post-gap), the calculator uses ATR-based placement:
- Stop: 1.5 x ATR from entry
- Target 1: 2.0 x ATR from entry
- Target 2: 4.0 x ATR from entry
This removes the 15-20 minutes traders typically spend manually measuring setups. The math happens instantly.
Dashboard Intelligence
The dashboard provides command-center visibility:
Position State: Long/Short/Flat with UT Bot status
Regime Status: Locked (filter active) or Unlocked, showing current bias
VWAP Swing: Current swing structure (Bullish/Bearish)
Multi-Timeframe Matrix: 9 timeframes showing EMA trend alignment (1M to 1Month)
Market Data: Volume analysis, MACD, Stochastic, ATR state
AI Predictive: Synthesized trend bias using smoothed RSI + momentum
Trade Setup: Live entry, two targets, stop loss, R:R ratio
All information updates tick-by-tick. One glance tells you: Is there a setup? What's the regime? Where are my levels?
How to Use This Protocol
Philosophy: You Are the Sniper, This Is Your Scope
The ATM Protocol doesn't predict the future. It analyzes current structure and tells you when conditions favor high-probability setups. You decide when to pull the trigger.
Step-by-Step Workflow:
1. Check Regime (Dashboard Top Section)
Look for:
- 🔒LONG = Bullish regime confirmed, look for longs only
- 🔒SHORT = Bearish regime confirmed, look for shorts only
- ⚪NEUTRAL = No regime, stay flat or reduce size
2. Wait for UT Signal
- Green "Buy" label = Long signal (only appears during bullish regime)
- Red "Sell" label = Short signal (only appears during bearish regime)
- Gray X = Rejected signal (counter-trend attempt blocked by filter)
3. Confirm with Volume Profile
Ideal long setup:
- Price at or near VAL (value area low)
- Buy signal fires
- Regime is bullish
- POC is above current price (room to move)
Ideal short setup:
- Price at or near VAH (value area high)
- Sell signal fires
- Regime is bearish
- POC is below current price (room to fall)
4. Review Trade Setup (Dashboard AI Section)
Check:
- Entry: Current price
- Target 1: First profit objective
- Target 2: Full profit objective
- Stop Loss: Invalidation level
- R:R: Aim for minimum 1.5:1, preferably 2:1+
5. Execute and Manage
- Enter at current price when all conditions align
- Set stop at displayed level
- Take partial profits at Target 1 (50% position)
- Hold remaining for Target 2 or trail with LinReg candles
- Exit immediately if regime flips (dashboard shows change)
Position Management with LinReg:
The script plots linear regression candles colored by position state:
- Green candles = In long position
- Red candles = In short position
- Blue signal line = Dynamic trend
Use these to trail stops or add to winners during strong trends.
Longevity Zones: Time-Tested Levels
Support and resistance zones that have held for extended periods carry more weight. The longevity tracker shows:
- Zone age: Days, Months, or Years
- Bar count: Total bars since zone formation
- Auto-deletion: Zones disappear when price violates them
Why This Matters:
A resistance zone that has held for 6 months indicates institutional interest. A support zone that formed yesterday is untested. Longevity helps you prioritize which levels matter most.
Zones display as semi-transparent rectangles (red for resistance, green for support) with labels showing duration. Place stops beyond these zones for optimal invalidation points.
What This Tool Does NOT Do
Brutal Honesty Section:
❌ Does NOT predict the future - Past results never guarantee future performance. Markets change. Regimes shift. Volatility spikes. Nothing is certain.
❌ Does NOT work in all conditions - Ranging, low-volatility, or news-driven markets produce fewer quality setups. You'll have periods with no signals. This is intentional - we're filtering for quality.
❌ Does NOT eliminate losses - Even 3:1 R:R setups fail. Stops get hit. The goal is positive expectancy over 50+ trades, not winning every single one.
❌ Does NOT replace risk management - If you risk 10% per trade, you'll blow your account regardless of how good the tool is. Proper position sizing is YOUR responsibility.
❌ Does NOT guarantee profits - Anyone claiming otherwise is lying. Trading is probabilistic. This tool identifies favorable probabilities. Execution and discipline are on you.
What It Requires From You:
✅ Learning curve - 2-4 weeks to understand regime changes, volume profile context, and setup identification. This isn't "add indicator, print money."
✅ Discipline - Following regime filter means accepting fewer trades. If you force trades during neutral regimes, the tool can't help you.
✅ Risk management - Position sizing, stop losses, profit taking - these are ALWAYS your decisions. The calculator suggests levels. You execute.
✅ Psychological control - Rejected signals (gray X) protect you. Don't override them emotionally. Trust the process over dozens of trades, not individual setups.
Technical Specifications
Components:
- UT Bot (ATR-based trailing stop signals) - Public domain base, regime-filtered
- RSI (14-period default) - Momentum regime definition with optimized thresholds
- Adaptive VWAP - Custom volatility-adjusted implementation with swing resets
- Volume Profile - Session-based institutional level detection (8 session types)
- Linear Regression - Position state visualization with smoothing
- Fibonacci Bands - ATR or StdDev based volatility bands
- Support/Resistance - Multi-timeframe structural levels (100/500/1000 bars)
- Longevity Zones - Duration-tracked pivot-based S/R
Regime Filter Logic:
- Bullish = RSI > 65 AND VWAP Swing Bullish (optional)
- Bearish = RSI < 32 AND VWAP Swing Bearish (optional)
- Neutral = Neither condition met
- Configurable: Disable filter or remove VWAP requirement
Volume Profile Settings:
- Session Types: Tokyo/London/NY/Daily/Weekly/Monthly/Quarterly/Yearly
- Resolution: 5-100 rows (higher = more detail)
- Value Area: 60-80% configurable (default 70%)
- Data Types: Volume or Open Interest (futures)
- Display Modes: 3 visual styles
The ATM Protocol is a scope, not autopilot. It identifies high-probability setups when conditions align. The discipline to wait for confirmation, the courage to execute when signals fire, and the wisdom to honor stops - these come from you.
**Trading is hard.** Most retail traders lose because they take every signal, fight trends, or revenge trade after losses. This tool can't fix those problems. What it CAN do is show you when the market structure favors your direction and automatically calculate logical trade parameters.
**Use it as designed:**
- Trust the regime filter (let it block counter-trend trades)
- Respect the setup calculator (stops exist for a reason)
- Understand Volume Profile context (trade with institutions, not against them)
- Give it time (evaluate over 50+ trades minimum)
The goal isn't to win every trade. It's to create positive expectancy through better trade selection and execution. The regime filter handles selection. You handle execution.
Good hunting. 🎯
---
**Disclaimer:** This indicator is a tool for technical analysis and does not constitute financial advice. Trading carries significant risk of capital loss. Past performance of any trading methodology does not guarantee future results. The creator assumes no responsibility for trading outcomes. Users must develop their own trading plan, risk management system, and execution discipline. Never risk more than you can afford to lose.

Sn1P3r Assistant🎯 Sn1P3r Assistant - Smart Bot Control Dashboard
Your intelligent companion for managing the Sn1P3r Flip trading bot. This powerful indicator helps you make informed decisions about when to start, stop, or monitor your automated trading system based on real-time market conditions.
━━━━━━━━━━━━━━━━━━━━━━━━━━━━━━━━━━━━━━━━━━━
📊 KEY FEATURES
✅ Volatility Analysis
- Real-time ADX-based volatility monitoring
- Adaptive thresholds for different trading styles (Scalping, Intraday, Swing)
- Clear signals: Low volatility = Safe to run bot | High volatility = Stop bot
- Prevents bot operation during dangerous high-volatility conditions
🚫 Killzone Protection
- Automatic detection of major market manipulation zones
- Three critical killzones monitored (Asia, Europe, New York sessions)
- Advanced 30-60 minute pre-killzone warnings
- Live countdown timers showing time remaining/until killzone
- Cambodia/Bangkok timezone optimized (7-9 AM, 1-3 PM, 7-9 PM)
🔔 Smart Alert System
- Real-time notifications when conditions change
- Pre-killzone warnings (30-60 min advance notice)
- Killzone entry/exit alerts
- Bot start/stop recommendations
- Volatility status changes

ALT Risk Metric StrategyHere's a professional write-up for your ALT Risk Strategy script:
ALT/BTC Risk Strategy - Multi-Crypto DCA with Bitcoin Correlation Analysis
Overview
This strategy uses Bitcoin correlation as a risk indicator to time entries and exits for altcoins. By analyzing how your chosen altcoin performs relative to Bitcoin, the strategy identifies optimal accumulation periods (when alt/BTC is oversold) and profit-taking opportunities (when alt/BTC is overbought). Perfect for traders who want to outperform Bitcoin by strategically timing altcoin positions.
Key Innovation: Why Alt/BTC Matters
Most traders focus solely on USD price, but Alt/BTC ratios reveal true altcoin strength:
When Alt/BTC is low → Altcoin is undervalued relative to Bitcoin (buy opportunity)
When Alt/BTC is high → Altcoin has outperformed Bitcoin (take profits)
This approach captures the rotation between BTC and alts that drives crypto cycles
Key Features
📊 Advanced Technical Analysis
RSI (60% weight): Primary momentum indicator on weekly timeframe
Long-term MA Deviation (35% weight): Measures distance from 150-period baseline
MACD (5% weight): Minor confirmation signal
EMA Smoothing: Filters noise while maintaining responsiveness
All calculations performed on Alt/BTC pairs for superior market timing
💰 3-Tier DCA System
Level 1 (Risk ≤ 70): Conservative entry, base allocation
Level 2 (Risk ≤ 50): Increased allocation, strong opportunity
Level 3 (Risk ≤ 30): Maximum allocation, extreme undervaluation
Continuous buying: Executes every bar while below threshold for true DCA behavior
Cumulative sizing: L3 triggers = L1 + L2 + L3 amounts combined
📈 Smart Profit Management
Sequential selling: Must complete L1 before L2, L2 before L3
Percentage-based exits: Sell portions of position, not fixed amounts
Auto-reset on re-entry: New buy signals reset sell progression
Prevents premature full exits during volatile conditions
🤖 3Commas Automation
Pre-configured JSON webhooks for Custom Signal Bots
Multi-exchange support: Binance, Coinbase, Kraken, Bitfinex, Bybit
Flexible quote currency: USD, USDT, or BUSD
Dynamic order sizing: Automatically adjusts to your tier thresholds
Full webhook documentation compliance
🎨 Multi-Asset Support
Pre-configured for popular altcoins:
ETH (Ethereum)
SOL (Solana)
ADA (Cardano)
LINK (Chainlink)
UNI (Uniswap)
XRP (Ripple)
DOGE
RENDER
Custom option for any other crypto
How It Works
Risk Metric Calculation (0-100 scale):
Fetches weekly Alt/BTC price data for stability
Calculates RSI, MACD, and deviation from 150-period MA
Normalizes MACD to 0-100 range using 500-bar lookback
Combines weighted components: (MACD × 0.05) + (RSI × 0.60) + (Deviation × 0.35)
Applies 5-period EMA smoothing for cleaner signals
Color-Coded Risk Zones:
Green (0-30): Extreme buying opportunity - Alt heavily oversold vs BTC
Lime/Yellow (30-70): Accumulation range - favorable risk/reward
Orange (70-85): Caution zone - consider taking initial profits
Red/Maroon (85-100+): Euphoria zone - aggressive profit-taking
Entry Logic:
Buys execute every candle when risk is below threshold
As risk decreases, position sizing automatically scales up
Example: If risk drops from 60→25, you'll be buying at L1 rate until it hits 50, then L2 rate, then L3 rate
Exit Logic:
Sells only trigger when in profit AND risk exceeds thresholds
Sequential execution ensures partial profit-taking
If new buy signal occurs before all sells complete, sell levels reset to L1
Configuration Guide
Choosing Your Altcoin:
Select crypto from dropdown (or use CUSTOM for unlisted coins)
Pick your exchange
Choose quote currency (USD, USDT, BUSD)
Risk Metric Tuning:
Long Term MA (default 150): Higher = more extreme signals, Lower = more frequent
RSI Length (default 10): Lower = more volatile, Higher = smoother
Smoothing (default 5): Increase for less noise, decrease for faster reaction
Buy Settings (Aggressive DCA Example):
L1 Threshold: 70 | Amount: $5
L2 Threshold: 50 | Amount: $6
L3 Threshold: 30 | Amount: $7
Total L3 buy = $18 per candle when deeply oversold
Sell Settings (Balanced Exit Example):
L1: 70 threshold, 25% position
L2: 85 threshold, 35% position
L3: 100 threshold, 40% position (final exit)
3Commas Setup
Bot Configuration:
Create Custom Signal Bot in 3Commas
Set trading pair to your altcoin/USD (e.g., ETH/USD, SOL/USDT)
Order size: Select "Send in webhook, quote" to use strategy's dollar amounts
Copy Bot UUID and Secret Token
Script Configuration:
Paste credentials into 3Commas section inputs
Check "Enable 3Commas Alerts"
Save and apply to chart
TradingView Alert:
Create Alert → Condition: "alert() function calls only"
Webhook URL: api.3commas.io
Enable "Webhook URL" checkbox
Expiration: Open-ended
Strategy Advantages
✅ Outperform Bitcoin: Designed specifically to beat BTC by timing alt rotations
✅ Capture Alt Seasons: Automatically accumulates when alts lag, sells when they pump
✅ Risk-Adjusted Sizing: Buys more when cheaper (better risk/reward)
✅ Emotional Discipline: Systematic approach removes fear and FOMO
✅ Multi-Asset: Run same strategy across multiple altcoins simultaneously
✅ Proven Indicators: Combines RSI, MACD, and MA deviation - battle-tested tools
Backtesting Insights
Optimal Timeframes:
Daily chart: Best for backtesting and signal generation
Weekly data is fetched internally regardless of display timeframe
Historical Performance Characteristics:
Accumulates heavily during bear markets and BTC dominance periods
Captures explosive altcoin rallies when BTC stagnates
Sequential selling preserves capital during extended downtrends
Works best on established altcoins with multi-year history
Risk Considerations:
Requires capital reserves for extended accumulation periods
Some altcoins may never recover if fundamentals deteriorate
Past correlation patterns may not predict future performance
Always size positions according to personal risk tolerance
Visual Interface
Indicator Panel Displays:
Dynamic color line: Green→Lime→Yellow→Orange→Red as risk increases
Horizontal threshold lines: Dashed lines mark your buy/sell levels
Entry/Exit labels: Green labels for buys, Orange/Red/Maroon for sells
Real-time risk value: Numerical display on price scale
Customization:
All threshold lines are adjustable via inputs
Color scheme clearly differentiates buy zones (green spectrum) from sell zones (red spectrum)
Line weights emphasize most extreme thresholds (L3 buy and L3 sell)
Strategy Philosophy
This strategy is built on the principle that altcoins move in cycles relative to Bitcoin. During Bitcoin rallies, alts often bleed against BTC (high sell, accumulate). When Bitcoin consolidates, alts pump (take profits). By measuring risk on the Alt/BTC chart instead of USD price, we time these rotations with precision.
The 3-tier system ensures you're always averaging in at better prices and scaling out at better prices, maximizing your Bitcoin-denominated returns.
Advanced Tips
Multi-Bot Strategy:
Run this on 5-10 different altcoins simultaneously to:
Diversify correlation risk
Capture whichever alt is pumping
Smooth equity curve through rotation
Pairing with BTC Strategy:
Use alongside the BTC DCA Risk Strategy for complete portfolio coverage:
BTC strategy for core holdings
ALT strategies for alpha generation
Rebalance between them based on BTC dominance
Threshold Calibration:
Check 2-3 years of historical data for your chosen alt
Note where risk metric sat during major bottoms (set buy thresholds)
Note where it peaked during euphoria (set sell thresholds)
Adjust for your risk tolerance and holding period
Credits
Strategy Development & 3Commas Integration: Claude AI (Anthropic)
Technical Analysis Framework: RSI, MACD, Moving Average theory
Implementation: pommesUNDwurst
Disclaimer
This strategy is for educational purposes only. Cryptocurrency trading involves substantial risk of loss. Altcoins are especially volatile and many fail completely. The strategy assumes liquid markets and reliable Alt/BTC price data. Always do your own research, understand the fundamentals of any asset you trade, and never risk more than you can afford to lose. Past performance does not guarantee future results. The authors are not financial advisors and assume no liability for trading decisions.
Additional Warning: Using leverage or trading illiquid altcoins amplifies risk significantly. This strategy is designed for spot trading of established cryptocurrencies with deep liquidity.
Tags: Altcoin, Alt/BTC, DCA, Risk Metric, Dollar Cost Averaging, 3Commas, ETH, SOL, Crypto Rotation, Bitcoin Correlation, Automated Trading, Alt Season
Feel free to modify any sections to better match your style or add specific backtesting results you've observed! 🚀Claude is AI and can make mistakes. Please double-check responses. Sonnet 4.5

SFP + Binance Hedge Direct (Full)RSI SFP + Binance Direct Auto-Trading (Hedge Mode)
RSI SFP + 币安直连自动交易脚本 (双向持仓模式)
🇨🇳 中文说明 (Chinese)
简介 / Introduction 这是一个专为 Binance Futures Signal Bot(币安合约信号机器人) 深度定制的 RSI SFP(假突破)策略脚本。它移除了对第三方中间商(如 WunderTrading)的依赖,实现了 TradingView 到币安的毫秒级直连下单,极大降低了滑点。
核心功能 / Key Features
SFP 针尖策略: 基于 RSI 背离 + 前高/前低假突破(Swing Failure Pattern)捕捉反转机会。支持 "触碰即入场" 或 "收线确认" 模式。
币安直连 (Binance Direct): 内置符合币安 Hedge Mode (双向持仓) 标准的 JSON 生成器。支持自动挂入 TP/SL (止盈止损) 单。
智能资金管理: 无需手动计算总金额。只需输入 本金 (Margin) 和 杠杆 (Leverage),脚本自动计算总名义价值 (Notional Value) 并发送给交易所。
多重过滤系统: 集成 布林带 (Bollinger Bands) 和 成交量 (Volume) 过滤器,有效过滤震荡中的假信号。
双重报警支持:
机器人端: 发送标准 JSON 指令,包含开单、金额、止盈止损价。
手机端: 通过隐藏绘图输出,支持发送清晰易读的文本消息(如 "BTC Long, Entry: 95000, TP: 96000")。
设置指南 / Setup Guide
参数设置:
在 🤖 Bot Connection 中填入币安提供的 signalId 和 uid。
在 Position & Money 中设置您的单笔本金和杠杆(如 1000 U, 100x)。
币安设置:
在币安创建信号机器人时,务必选择 Order Size 单位为 USDT。
报警设置 (双报警模式):
自动交易: 创建报警 -> 选择 Any alert() function call -> 填入 Webhook URL -> 消息框留空。
手机提醒: 创建报警 -> 选择 Bullish/Bearish Reversal -> 填入 {{plot("Alert_Entry")}} 等占位符 -> 发送到 App。
🇺🇸 English Description
Introduction This is a specialized RSI SFP (Swing Failure Pattern) strategy script tailored for the Binance Futures Signal Bot. It eliminates the need for third-party middleware (like WunderTrading), enabling direct, low-latency execution from TradingView to Binance with minimal slippage.
Key Features
SFP Strategy: Captures reversals based on RSI Divergence + Structure False Breakouts (Wick-based). Supports "Touch Only" or "Close Return" entry modes.
Binance Direct Integration: Built-in JSON generator strictly compliant with Binance Hedge Mode. Automatically attaches TP/SL (Take Profit & Stop Loss) orders directly to the entry signal.
Smart Money Management: No need to calculate position sizes manually. Simply input your Margin (USDT) and Leverage. The script auto-calculates the Total Notional Value to send to the exchange.
Advanced Filtering: Integrated Bollinger Bands and Volume filters to reduce false signals during choppy markets.
Dual Alert System:
For Bot: Sends raw JSON commands with execution details.
For Phone: Uses hidden plots to allow clean, human-readable text alerts (e.g., "BTC Long, Entry: $...", "TP: $...").
Setup Guide
Script Settings:
Paste your Binance signalId and uid in the 🤖 Bot Connection section.
Set your Margin and Leverage in Position & Money (e.g., 1000 USDT, 100x).
Binance Settings:
When creating the Signal Bot on Binance, ensure Order Size unit is set to USDT.
Alert Setup (Double-Alert Method):
For Auto-Trading: Create Alert -> Select Any alert() function call -> Check Webhook -> Leave Message empty.
For Phone Notification: Create Alert -> Select Bullish/Bearish Reversal -> Use placeholders like {{plot("Alert_Entry")}} -> Notify on App.
⚠️ Risk Warning
This script automates high-leverage trading. Ensure your Binance Futures account is set to Hedge Mode before running. Use at your own risk.

UTBotLibrary "UTBot"
is a powerful and flexible trading toolkit implemented in Pine Script. Based on the widely recognized UT Bot strategy originally developed by Yo_adriiiiaan with important enhancements by HPotter, this library provides users with customizable functions for dynamic trailing stop calculations using ATR (Average True Range), trend detection, and signal generation. It enables developers and traders to seamlessly integrate UT Bot logic into their own indicators and strategies without duplicating code.
Key features include:
Accurate ATR-based trailing stop and reversal detection
Multi-timeframe support for enhanced signal reliability
Clean and efficient API for easy integration and customization
Detailed documentation and examples for quick adoption
Open-source and community-friendly, encouraging collaboration and improvements
We sincerely thank Yo_adriiiiaan for the original UT Bot concept and HPotter for valuable improvements that have made this strategy even more robust. This library aims to honor their work by making the UT Bot methodology accessible to Pine Script developers worldwide.
This library is designed for Pine Script programmers looking to leverage the proven UT Bot methodology to build robust trading systems with minimal effort and maximum maintainability.
UTBot(h, l, c, multi, leng)
Parameters:
h (float) - high
l (float) - low
c (float)-close
multi (float)- multi for ATR
leng (int)-length for ATR
Returns:
xATRTS - ATR Based TrailingStop Value
pos - pos==1, long position, pos==-1, shot position
signal - 0 no signal, 1 buy, -1 sell

ICT FVG Buy/Sell SignalsThis bot is built on ICT (Inner Circle Trader) concepts such as:
Fair Value Gaps (FVGs) – imbalance zones between candles.
Consequent Encroachment (CE) – the midpoint of a gap.
Premium / Discount Arrays – dealing ranges split into premium (sell-side) and discount (buy-side) zones.
Displacement candles – strong impulsive moves that confirm intent.
The bot scans for FVGs, marks CE levels, and waits for price to return to these levels.
When price revisits a valid FVG zone with displacement confirmation and in the correct PD array, the bot generates a BUY or SELL signal.
✅ Signal Rules
Buy Signal
Price trades back into a Bullish FVG.
Current bar shows bullish displacement (large bullish body relative to ATR).
Price is in discount territory of the current dealing range (if PD filter is enabled).
Close is above the CE line of the FVG.
Sell Signal
Price trades back into a Bearish FVG.
Current bar shows bearish displacement.
Price is in premium territory of the current dealing range.
Close is below the CE line of the FVG.
🎯 What You’ll See on the Chart
Green “BUY” labels below candles when long signals trigger.
Red “SELL” labels above candles when short signals trigger.
Shaded background:
Red = Premium zone (sell side).
Teal = Discount zone (buy side).
Yellow line = dealing range midpoint (equilibrium).
Dots on CE lines = midpoints of the latest bullish/bearish FVG.
🔔 Alerts
ICT Buy → Triggers when a bullish setup confirms.
ICT Sell → Triggers when a bearish setup confirms.
You can connect these alerts to:
TradingView notifications.
Webhooks (for brokers or bots like MetaTrader, NinjaTrader, or Discord).
⚙️ Settings
Swing length – how many bars to use when detecting swing highs/lows for the dealing range.
Use PD filter – toggle ON/OFF for requiring discount/premium alignment.
Displacement ATR multiple – how strong the candle body must be compared to ATR to count as a displacement.
ATR length – used for displacement filter.
📈 Supported Markets
Works on all symbols and timeframes.
Commonly applied to:
NASDAQ (NQ, QQQ)
S&P500 (ES, SPX, SPY)
Forex pairs
Crypto (BTC, ETH, etc.)
⚠️ Disclaimer
This bot is for educational purposes only. It does not guarantee profits and should be tested on demo accounts first.
Always apply proper risk management before trading live.

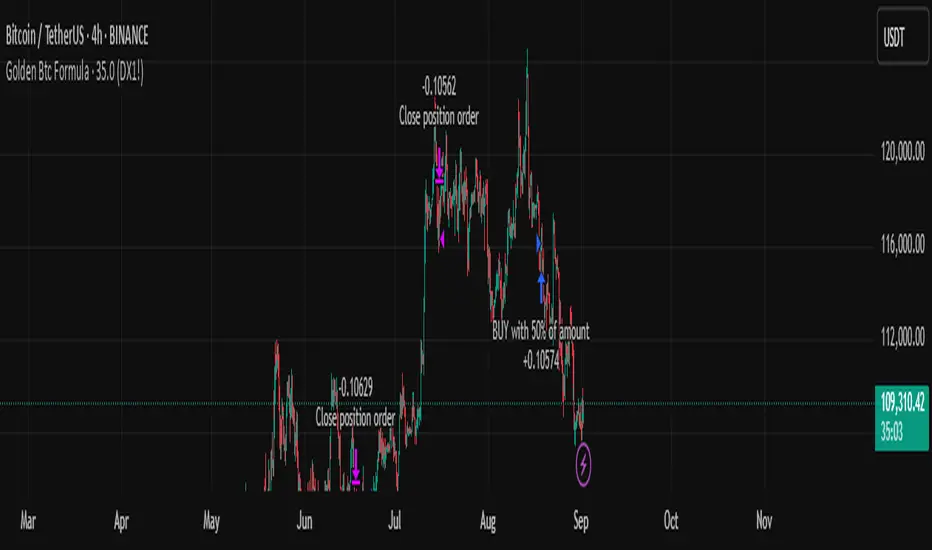
Golden Btc Formula🏆 Golden BTC Formula Bot
Introducing the Golden BTC Formula Bot — a smart trading strategy built specifically for Bitcoin on TradingView, designed to combine algorithmic precision with solid risk management.
📊 Backtest Overview:
The backtest shows that starting with a $10,000 balance and using a position size of 50% of equity per trade, the bot has delivered impressive, consistent returns over the tested period. The equity curve illustrates steady growth, minimal drawdowns, and controlled risk exposure — proving its robustness even in volatile market conditions.
⚙️ How It Works:
The bot automatically detects high-probability entries based on carefully tuned indicators and price action logic.
Targets and stop-loss levels are dynamically calculated to adapt to market volatility.
Built entirely in Pine Script for TradingView, so you can watch trades live or backtest historically.
🛡️ Risk Management Tips:
Even with a strong backtest, real trading always involves risk. Here’s how to use the Golden BTC Formula Bot responsibly:
✅ Use only part of your capital (e.g., 30–50%) for the bot.
✅ Set reasonable leverage (or stick to spot trading).
✅ Withdraw profits periodically instead of letting them fully compound forever.
✅ Always backtest and forward-test before going live, and consider running it in paper trading mode at first.
MetaFOX DCA (ASAP-RSI-BB%B-TV)Welcome To ' MetaFOX DCA (ASAP-RSI-BB%B-TV) ' Indicator.
This is not a Buy/Sell signals indicator, this is an indicator to help you create your own strategy using a variety of technical analyzing options within the indicator settings with the ability to do DCA (Dollar Cost Average) with up to 100 safety orders.
It is important when backtesting to get a real results, but this is impossible, especially when the time frame is large, because we don't know the real price action inside each candle, as we don't know whether the price reached the high or low first. but what I can say is that I present to you a backtest results in the worst possible case, meaning that if the same chart is repeated during the next period and you traded for the same period and with the same settings, the real results will be either identical to the results in the indicator or better (not worst). There will be no other factors except the slippage in the price when executing orders in the real trading, So I created a feature for that to increase the accuracy rate of the results. For more information, read this description.
Below I will explain all the properties and settings of the indicator:
A) 'Buy Strategies' Section: Your choices of strategies to Start a new trade: (All the conditions works as (And) not (OR), You have to choose one at least and you can choose more than one).
- 'ASAP (New Candle)': Start a trade as soon as possible at the opening of a new candle after exiting the previous trade.
- 'RSI': Using RSI as a technical analysis condition to start a trade.
- 'BB %B': Using BB %B as a technical analysis condition to start a trade.
- 'TV': Using tradingview crypto screener as a technical analysis condition to start a trade.
B) 'Exit Strategies' Section: Your choices of strategies to Exit the trades: (All the conditions works as (And) not (OR), You can choose more than one, But if you don't want to use any of them you have to activate the 'Use TP:' at least).
- 'ASAP (New Candle)': Exit a trade as soon as possible at the opening of a new candle after opening the previous trade.
- 'RSI': Using RSI as a technical analysis condition to exit a trade.
- 'BB %B': Using BB %B as a technical analysis condition to exit a trade.
- 'TV': Using tradingview crypto screener as a technical analysis condition to exit a trade.
C) 'Main Settings' Section:
- 'Trading Fees %': The Exchange trading fees in percentage (trading Commission).
- 'Entry Price Slippage %': Since real trading differs from backtest calculations, while in backtest results are calculated based on the open price of the candle, but in real trading there is a slippage from the open price of the candle resulting from the supply and demand in the real time trading, so this feature is to determine the slippage Which you think it is appropriate, then the entry prices of the trades will calculated higher than the open price of the start candle by the percentage of slippage that you set. If you don't want to calculate any slippage, just set it to zero, but I don't recommend that if you want the most realistic results.
Note: If (open price + slippage) is higher than the high of the candle then don't worry, I've kept this in consideration.
- 'Use SL': Activate to use stop loss percentage.
- 'SL %': Stop loss percentage.
- 'SL settings options box':
'SL From Base Price': Calculate the SL from the base order price (from the trade first entry price).
'SL From Avg. Price': Calculate the SL from the average price in case you use safety orders.
'SL From Last SO.': Calculate the SL from the last (lowest) safety order deviation.
ex: If you choose 'SL From Avg. Price' and SL% is 5, then the SL will be lower than the average price by 5% (in this case your SL will be dynamic until the price reaches all the safety orders unlike the other two SL options).
Note: This indicator programmed to be compatible with '3COMMAS' platform, but I added more options that came to my mind.
'3COMMAS' DCA bots uses 'SL From Base Price'.
- 'Use TP': Activate to use take profit percentage.
- 'TP %': Take profit percentage.
- 'Pure TP,SL': This feature was created due to the differences in the method of calculations between API tools trading platforms:
If the feature is not activated and (for example) the TP is 5%, this means that the price must move upward by only 5%, but you will not achieve a net profit of 5% due to the trading fees. but If the feature is activated, this means that you will get a net profit of 5%, and this means that the price must move upward by (5% for the TP + the equivalent of trading fees). The same idea is applied to the SL.
Note: '3COMMAS' DCA bots uses activated 'Pure TP,SL'.
- 'SO. Price Deviation %': Determines the decline percentage for the first safety order from the trade start entry price.
- 'SO. Step Scale': Determines the deviation multiplier for the safety orders.
Note: I'm using the same method of calculations for SO. (safety orders) levels that '3COMMAS' platform is using. If there is any difference between the '3COMMAS' calculations and the platform that you are using, please let me know.
'3COMMAS' DCA bots minimum 'SO. Price Deviation %' is (0.21)
'3COMMAS' DCA bots minimum 'SO. Step Scale' is (0.1)
- 'SO. Volume Scale': Determines the base order size multiplier for the safety orders sizes.
ex: If you used 10$ to buy at the trade start (base order size) and your 'SO. Volume Scale' is 2, then the 1st SO. size will be 20, the 2nd SO. size will be 40 and so on.
- 'SO. Count': Determines the number of safety orders that you want. If you want to trade without safety orders set it to zero.
'3COMMAS' DCA bots minimum 'SO. Volume Scale' is (0.1)
- 'Exchange Min. Size': The exchange minimum size per trade, It's important to prevent you from setting the base order Size less than the exchange limit. It's also important for the backtest results calculations.
ex: If you setup your strategy settings and it led to a loss to the point that you can't trade any more due to insufficient funds and your base order size share from the strategy becomes less than the exchange minimum trade size, then the indicator will show you a warning and will show you the point where you stopped the trading (It works in compatible with the initial capital). I recommend to set it a little bit higher than the real exchange minimum trade size especially if you trade without safety orders to not stuck in the trade if you hit the stop loss
- 'BO. Size': The base order size (funds you use at the trade entry).
- 'Initial Capital': The total funds allocated for trading using your strategy settings, It can be more than what is required in the strategy to cover the deficit in case of a loss, but it should not exceed the funds that you actually have for trading using this strategy settings, It's important to prevent you from setting up a strategy which requires funds more than what you have. It's also has other important benefits (refer to 'Exchange Min. Size' for more information).
- 'Accumulative Results': This feature is also called re-invest profits & risk reduction. If it's not activated then you will use the same funds size in each new trade whether you are in profit or loss till the (initial capitals + net results) turns insufficient. If it's activated then you will reuse your profits and losses in each new trade.
ex: The feature is active and your first trade ended with a net profit of 1000$, the next trade will add the 1000$ to the trade funds size and it will be distributed as a percentage to the BO. & SO.s according to your strategy settings. The same idea in case of a loss, the trade funds size will be reduced.
D) 'RSI Strategy' Section:
- 'Buy': RSI technical condition to start a trade. Has no effect if you don't choose 'RSI' option in 'Buy Strategies'.
- 'Exit': RSI technical condition to exit a trade. Has no effect if you don't choose 'RSI' option in 'Exit Strategies'.
E) 'TV Strategy' Section:
- 'Buy': TradingView Crypto Screener technical condition to start a trade. Has no effect if you don't choose 'TV' option in 'Buy Strategies'.
- 'Exit': TradingView Crypto Screener technical condition to exit a trade. Has no effect if you don't choose 'TV' option in 'Exit Strategies'.
F) 'BB %B Strategy' Section:
- 'Buy': BB %B technical condition to start a trade. Has no effect if you don't choose 'BB %B' option in 'Buy Strategies'.
- 'Exit': BB %B technical condition to exit a trade. Has no effect if you don't choose 'BB %B' option in 'Exit Strategies'.
G) 'Plot' Section:
- 'Signals': Plots buy and exit signals.
- 'BO': Plots the trade entry price (base order price).
- 'AVG': Plots the trade average price.
- 'AVG options box': Your choice to plot the trade average price type:
'Avg. With Fees': The trade average price including the trading fees, If you exit the trade at this price the trade net profit will be 0.00
'Avg. Without Fees': The trade average price but not including the trading fees, If you exit the trade at this price the trade net profit will be a loss equivalent to the trading fees.
- 'TP': Plots the trade take profit price.
- 'SL': Plots the trade stop loss price.
- 'Last SO': Plots the trade last safety order that the price reached.
- 'Exit Price': Plots a mark on the trade exit price, It plots in 3 colors as below:
Red (Default): Trade exit at a loss.
Green (Default): Trade exit at a profit.
Yellow (Default): Trade exit at a profit but this is a special case where we have to calculate the profits before reaching the safety orders (if any) on that candle (compatible with the idea of getting strategy results at the worst case).
- 'Result Table': Plots your strategy result table. The net profit percentage shown is a percentage of the 'initial capital'.
- 'TA Values': Plots your used strategies Technical analysis values. (Green cells means valid condition).
- 'Help Table': Plots a table to help you discover 100 safety orders with its deviations and the total funds needed for your strategy settings. Deviations shown in red is impossible to use because its price is <= 0.00
- 'Portfolio Chart': Plots your Portfolio status during the entire trading period in addition to the highest and lowest level reached. It's important when evaluating any strategy not only to look at the final result, but also to look at the change in results over the entire trading period. Perhaps the results were worryingly negative at some point before they rose again and made a profit. This feature helps you to see the whole picture.
- 'Welcome Message': Plots a welcome message and showing you the idea behind this indicator.
- 'Green Net Profit %': It plots the 'Net Profit %' in the result table in green color if the result is equal to or above the value that you entered.
- 'Green Win Rate %': It plots the 'Win Rate %' in the result table in green color if the result is equal to or above the value that you entered.
- 'User Notes Area': An empty text area, Feel free to use this area to write your notes so you don't forget them.
The indicator will take care of you. In some cases, warning messages will appear for you. Read them carefully, as they mean that you have done an illogical error in the indicator settings. Also, the indicator will sometimes stop working for the same reason mentioned above. If that happens then click on the red (!) next to the indicator name and read the message to find out what illogical error you have done.
Please enjoy the indicator and let me know your thoughts in the comments below.

SVMKR_UT_Bot_HMA_UCS_LRSThis Pine Script code is a TradingView study script titled "SVMKR_UT_Bot_HMA_UCS_LRS". It combines two separate trading indicators: the UT Bot (Ultimate Trailing Stop Bot) and the UCS_LRS (Linear Regression Slope) indicator.
UT Bot (Ultimate Trailing Stop Bot):
The UT Bot is designed to provide buy and sell signals based on a trailing stop strategy.
It calculates the trailing stop level using the Average True Range (ATR) and Heikin Ashi candle signals if enabled.
Buy signals are generated when the price crosses above the trailing stop, while sell signals occur when the price crosses below the trailing stop.
Additionally, buy and sell signals are visually represented on the chart with corresponding labels and shapes.
The script also includes options to customize the sensitivity of the trailing stop and to color the bars based on buy or sell signals.
Hull Moving Average (HMA):
This section calculates and plots the Hull Moving Average, a type of moving average that reduces lag and improves smoothing compared to traditional moving averages.
It uses the weighted moving average (WMA) to compute the HMA, which helps to identify trend direction and potential reversal points.
UCS_LRS (Linear Regression Slope):
The UCS_LRS indicator calculates the linear regression slope of the closing prices over a specified period.
It then applies exponential smoothing to the slope values and calculates an average slope.
Buy signals are generated when the current slope is greater than the average slope and positive, indicating an uptrend.
Conversely, sell signals are generated when the current slope is less than the average slope and negative, suggesting a downtrend.
The linear regression slope and its average are plotted on the chart, allowing traders to visually identify trend strength and potential reversal points.
Overall, this combined script provides traders with a comprehensive set of tools for trend following and momentum trading strategies, integrating trailing stop analysis, moving average smoothing, and linear regression slope analysis into a single script for technical analysis on TradingView charts.

Price Action Pattern Breakout Strategy: Wedge,Triangle,ChannelIntroducing the Price Action Pattern Breakout Strategy: Wedge,Triangle,Channel 💹🚀
The "Price Action Pattern Breakout Strategy: Wedge, Triangle, Channel" is a dynamic and automated trading strategy that excels in recognizing and capitalizing on breakout opportunities within the realm of powerful price action patterns. It is finely tuned to achieve exceptional precision in detecting three distinct pattern types: Wedge, Triangle, and Channel. This diversity equips you to confidently navigate a wide range of market scenarios and opportunities.
This strategy automates trade entries and exits upon confirmed pattern breakouts, this eliminates human errors in correctly recognizing patterns and prevents emotional decisions. This strategy is designed to work across different time frames, making it suitable for both short-term and long-term traders. Whether you're a day trader, swing trader, or investor, this strategy provides the flexibility you need to thrive in diverse market conditions.
💎 How it Works:
▶️ In this strategy, three price action patterns have been utilized, one of which is the "Wedge" pattern. The Wedge pattern has consistently demonstrated a high level of credibility, typically resulting in sharp and rapid price movements following a confirmed breakout from this pattern. This characteristic makes the Wedge pattern highly noteworthy in our strategy. The second pattern is the "Triangle" pattern, which, depending on its formation, whether ascending or descending, can indicate a strong continuation or reversal of the trend. The last pattern is the "Channel" pattern. The reason for using the Channel pattern is its versatility in various market conditions and its tendency to produce reliable results.
In the snapshot below, you can observe the types of patterns that this strategy is capable of identifying at a glance:
▶️ This strategy employs two types of targeting systems: Fixed Targets and Trailing Targets.
Fixed Targets is the default targeting system of the strategy, incorporating two primary targets: TP1 (Target Point 1) and TP2 (Target Point 2). These targets are thoughtfully adjusted in alignment with specific rules for each pattern. With Fixed Targets, you have the flexibility to designate the position size percentage for your exits at TP1 and TP2. For instance, should you opt to allocate 60% of your position size to TP1, as soon as the price triggers the first take profit level, 60% of your initial position is gracefully closed, leaving the remaining 40% to exit the trade upon reaching TP2.
Trailing Targets represent the strategy's alternative targeting system. With this system, the trailing stop becomes active once the price reaches the specified trigger point. The strategy then exits the trade based on the defined offset percentage and price retracement from the trailing limit.
▶️ This strategy relies on a single type of stop loss, determined by previous pivot points and adjusted based on the trade's direction, whether long or short, placing the stop loss above or below the prior pivot. This stop loss approach has demonstrated reliability when used alongside price action patterns.
In addition to this fixed stop loss, you can specify a percentage buffer, offering protection against potential stop hunting due to market fluctuations. This buffer helps protect your positions from sudden price swings. For example, selecting a 1% buffer means your stop loss will be positioned 1% higher or lower concerning the last pivot, depending on your trade's direction. This added layer of security ensures your trades remain resilient and less vulnerable to market volatility.
▶️ A practical feature of this strategy is the "Risk-Free" option. Once activated, it continuously monitors price movements, and as soon as the price progresses in the trade's direction and surpasses the designated Risk-Free Trigger Point in percentage, the stop loss is dynamically shifted from its initial position to the entry price, effectively making the trade "risk-free." This means that if the trade doesn't go as expected, we exit at the entry point, incurring neither profit nor loss from the trade.
Additionally, you have the flexibility to fine-tune the modified stop loss, positioning it slightly above or below the entry price through the configuration of a specified percentage. This allows for effective consideration of commission fees in your trading strategy.
▶️ Risk management is a crucial concept in trading, playing a significant role in a trader's long-term success. This strategy introduces a unique feature called "Fixed Loss Position Sizing", where upon activation, you can limit the risk exposure to a specified percentage of your capital per trade. Set your preferred risk percentage along with the intended leverage. The strategy independently considers your available capital and designated leverage, determining the position size before executing any trade.
In the case of a stop loss, your loss is limited to the specified risk percentage. For instance, with a $1000 account and a 1% risk set, the strategy adjusts each trade's size to ensure a maximum loss of $10 if the stop loss is triggered. Enabling this feature will ensure disciplined risk management, aligning potential losses precisely with your predetermined risk percentage, contingent upon your total available capital.
▶️ Another feature of this strategy is a sophisticated mechanism called "Loss Compensation". When enabled, Loss Compensation dynamically adjusts the position size after a loss, aiming to recover from previous losses in subsequent trades. This adaptive mechanism continually modifies the position size to mitigate the impact of consecutive losses until reaching a user-defined limit for consecutive loss compensations.
The feature's configurability allows users to set the maximum number of consecutive losses to compensate for and also includes an option to factor in trading fees from prior trades into the compensation calculation. Loss Compensation operates in conjunction with the 'Fixed Loss Position Sizing' setting, ensuring that once losses are sufficiently compensated, subsequent entries revert to the predefined configurations within the 'Fixed Loss Position Sizing' settings.
This advanced tool ensures a stable risk management approach by changing trade sizes dynamically according to past results during consecutive loss periods.
▶️ This strategy incorporates a feature known as the "Counter-Pattern Breakout", altering its approach to wedge, triangle, and channel pattern breakouts. Normally, the strategy relies on standard pattern signals to determine whether to enter long or short positions based on breakout directions.
For example, in an ascending channel or a rising wedge pattern, the strategy typically seeks a short position opportunity upon a confirmed breakout in the lower line, and breakouts from the upper line are disregarded by the strategy. But with this feature enabled, strategy disregards the conventional pattern signals, seizing breakouts from upper or lower lines to open corresponding positions. For instance, in the ascending channel or the rising wedge pattern example, the strategy might enter a long position if the upper line breaks or a short position if the lower line breaks.
This introduces a more adaptive and opportunistic trading style, allowing you to capitalize on price movements, irrespective of the typical signal direction indicated by the pattern.
▶️ This strategy is fully compatible with third-party trading bots, allowing for easy connectivity to popular trading platforms. By leveraging the TradingView webhook functionality, you can effortlessly link the strategy to your preferred bot and receive accurate signals for position entry and exit. The strategy provides all the necessary alert message fields, ensuring a smooth and user-friendly trading experience. With this integration, you can automate the execution of trades, saving time and effort while enjoying the benefits of this powerful strategy.
⚙️ How to Use & Configure User Settings:
To fully utilize the "Price Action Pattern Breakout Strategy: Wedge, Triangle, Channel," it's essential to consider and comprehend the following steps. They play a crucial role in enhancing its functionality and achieving its utmost potential outcomes:
1. General Strategy Settings:
Enable Dark Mode if using a dark TradingView theme for improved chart visibility.
Select the Strategy's Trade Direction: Long, Short, or Both.
Choose Pattern Recognition Accuracy: High for precise recognition but fewer positions, Low for more positions with slightly less accuracy.
Enable 'Prevent New Entry on Opposite Signal While In Position' to avoid new trades if the opposite signal occurs.
Switch to Indicator Mode if solely using the strategy as an indicator or in combination with other strategies.
2. Pattern and Pivot Configuration:
Consider configuring the Number of Patterns and Pivot Lookback Lengths. Here, you can personalize the pivot lookback lengths for wedge, triangle, and channel patterns across eight different settings on your chart. For lower time frames, consider larger lengths to reduce chart noise. Alternatively, to maintain clarity on your chart, you can disable multiple patterns with different lengths while ensuring at least one pattern remains enabled.
Note that enabling more patterns doesn't always equate to increased potential profit. Sometimes, fewer patterns result in greater profit potential, and vice versa. Experiment with lengths and the number of patterns to determine the most profitable and optimal outcome for your trading symbol and timeframe.
3. Targeting System Selection:
Choose between 'Fixed Targets' or 'Trailing Targets' for your targeting system.
'Fixed Targets' is the default setting, operational when 'Trailing Targets' are turned off.
Set the TP1 Position Size as a percentage, defining the size for TP1, and the rest exits at TP2.
Optionally activate 'Skip Entry if TP1 is Passed' to bypass entering positions if the price has exceeded TP1.
Alternatively, opt for the 'Trailing Target' for dynamic exits based on trigger points and offsets. Note that this option disables fixed targets.
4. Stop Loss Configuration:
Determine the number of candles to consider for stop loss placement based on the last pivot.
Optionally add a percentage to the stop loss to create a buffer against market fluctuations, guarding your positions from sudden price swings.
5. Risk Management Configuration:
You can activate the 'Risk-Free' feature, making your trades risk-free by moving the stop loss to the entry price upon reaching a specified trigger point.
You have the possibility to enable 'Fixed Loss Position Sizing' to limit risk to a percentage of total capital per trade, ensuring prudent risk management.
You can employ 'Use Real-Time Balance for Each Entry' to precisely calculate fixed loss position sizing according to the real-time balance for every entry.
The 'Loss Compensation' feature can be activated to automatically adjust trade sizes during consecutive losses and compensate for prior incurred losses.
Loss compensation continues adjusting trade sizes until it reaches the defined limit of consecutive losses specified in the 'Maximum Consecutive Losses To Compensate' field.
You can factor in commission fees by specifying a percentage in the 'Include Trading Fees in Compensation (%)' field, providing an option for more accurate loss compensation calculations.
You have the option to enable 'Limit Compensation to Real-Time Balance' to prevent consecutive loss compensation from exceeding your current real-time account balance.
It's important to note that for the 'Loss Compensation' feature to operate, the 'Fixed Loss Position Sizing' must be enabled.
6. Counter-Pattern Breakout Configuration:
In this section you have the option to enable the "Counter-Pattern Breakout" feature to adjust the strategy's approach to wedge, triangle, and channel pattern breakouts. Once enabled, the strategy disregards traditional pattern signals and capitalizes on breakouts from either the upper or lower lines, initiating corresponding positions accordingly.
Choose between 'Fixed Target' or 'Trailing Target' for your targeting system. If you opt for the 'Fixed Target', set a specific target point as a percentage, serving as the default target for counter-pattern breakouts. Alternatively, choose the 'Trailing Target' for dynamic exits based on trigger points and offsets. Do keep in mind that selecting the 'Trailing Target' option disables the fixed target setting.
Keep in mind that for standard, non-counter-pattern breakouts, the target point settings in their respective sections remain applicable, distinct from the settings configured for targeting within this section.
Note that the stop loss configurations are shared across standard pattern and counter-pattern breakouts and can be adjusted within the stop loss section.
7. Info Tables:
In the info tables section, you can show or hide different tables on the charts. This includes the backtest table, the current balance table displaying available funds, and a table showcasing Maximum Consecutive Wins or Losses. Choose which to display according to your preferences and specific needs.
8.Date & Time Range Filter:
Utilize the Date & Time Range filter feature to precisely select a start and end date, including time, to filter data within the chosen range.
When connecting this strategy to a trading bot for automated trades, ensure to set the start date and time to the intended initiation moment to avoid undesired outcomes as this directly affects the real-time balance calculations of the strategy.
8. Integration with Third-Party Bots:
To automate trading, leverage the strategy's compatibility with third-party trading bots. Seamlessly integrate the strategy into well-known trading platforms by using alert message fields to input commands from third-party trading bots, enabling automated trade execution for both long and short positions.
By furnishing these adjustable settings, the strategy empowers you to personalize it according to your unique requirements, thereby bolstering the adaptability and efficacy of your trading approach.
🔐 Source Code Protection:
The 'Price Action Pattern Breakout Strategy: Wedge, Triangle, Channel' source code is engineered for precision, reliability, and effectiveness. Its original and innovative design warrants protection and restricted access, preserving the strategy's exclusivity. Safeguarding the code maintains the strategy's integrity and distinctiveness, providing users with a competitive advantage in their trading endeavors.

USD Liquidity Conditions Index Swing Stock Strategy Original credits goes to @ElDoggo22 www.tradingview.com
I looked in the post created by him, of USD liquidity and I have noticed that if you are going to apply a percentile top and bottom to it, can become an interesting swing strategy for US Stocks.
So in this case I decided to create a 99th percentile for top and 4th percentile for bot with a big length, preferably 100+ candles, for this example i took 150.
Rules for entry :
Long : either bot or top lines are ascending
We exit long either the top line is descending, or we have sudden cross of the moving average with both top and bot within the same candle
Short: we enter short when we have a sudden cross down of the moving average with both top and bot within the same candle
We exit short when we have a cross over of the moving average with both top and bot within the same candle ( or we have a long entry condition)
If there are qny questions, please let me know !

X48 - Strategy | MA Type Cross + TPSL | Future&Spot | V.2Thank You For Open Source Code, This Strategy Ref. By 1.Simple Strategy Like MA Crossover For Long/Short or Spot Trade, 2. CDC Action Zone V.2 for BarPaint
This Strategy Mixing With MA Crossover Strategy and BarPaint By CDC Action Zone and TP/SL by Varbara
### How To Use Strategy : Setting EMA/SMA Crossover EMA/SMA, Any Value If You Want
For Long Position : Cross Up
For Short Position : Cross Down
Can Use With Spot Trade : Cross Up = Buy, Cross Down = Sell
TP/SL When Your OrderSize Change From any % Of Your TP/SL Value
### In Strategy Setting
Intitial Capital = Ex. 200
Order Size = Should Be Money Management Not Use 100% of Capital Ex. 10% of Capital (200$) = Order Size 20$
StopLoss and Take Profit = If You Run Trend TF 4H+ or 1D+ You Can Change TP% = 1,000% for nonlimit and Stop Loss 5 - 20% from your order size
Ex. Stoploss 15% = OrderSize / 100 x %SL = 20$/100 x 15% = 3$ Loss from order size 20$ (if you not set stop loss.)
Base Currency = (Your Currency) # Ex. USD
Commission = (Your Trading Fee) # Ex. Future Fee Can Check At Binance Fee Rate > www.binance.com > Choose Your Fee Type, Ex. USD M Future (Regular User) = 0.02 (Maker), 0.04 (Taker)
Commission Symbol Type = % # (Ref. By Binance Fee Rate)
### Notice ####
Default Setting It's Realistic From Normal Life Ex. Capital 200$ / Ordersize 20$ (10%)/ Commission 0.1% (Buy+Sell) / Slippage = 2 / TP = 1000% (nonlimit) / SL = 15%/OrderSize
Low Risk But High Return, Good Luck
### Bot Auto Trade by X4815162342 ###
if you wanna try my bot auto trade X48-3in1-bot : Contact My Line ID : x4815x
Full Command Alert For This Strategy If You Wanna See It's
'{"ex":"'+markettype+'","side": "'+longcommand+'", "amount": "@{{strategy.order.contracts}}", "symbol": "{{ticker}}", "passphrase": "'+passphrase+'","leverage":"'+str.tostring(leveragex)+'"}'
'{"ex":"'+markettype+'","side": "'+shortcommand+'", "amount": "@{{strategy.order.contracts}}", "symbol": "{{ticker}}", "passphrase": "'+passphrase+'","leverage":"'+str.tostring(leveragex)+'"}'
But Easy Than Full Command Just Use Thisssssss !! Strategy Be Manage Auto Long and Short or TPSL Position
You Don't Do Anything Just Use This Message to Alerts Message
{{strategy.order.alert_message}}
### If you don't use bot but just looking for strategy test ####
Just Pass Bot Setting Function It's Nothing Effect For Strategy !!!!!!
Let's Enjoy With Your Strategy BackTest 😁
Remember Beware Max drawdown%. I'm Recommend Lower Than 10% It's Very Good.

3C Crossover with TTP & TSLThis is not a set and forget strategy. It needs constant tweaking to maintain a high winrate. Also what works on one pair can be horrible on another.
This strategy works best on the 1 min or 5 min TF but also works well on the 15 min. Haven't done any testing in higher TF's as im only interested in scalping.
If enabled you can retrive data for the filters on any TF.
The strategy do not repaint.
You do not need a 3c subscription to run this strategy as the bot turns on and off the bot itself.
Instructions for the 3commas connector:
1. First, you need to prepare 3commas Long/Short bots that will only listen to custom TV signals.
2. Inputs for the 3commas bot can be found at the end of the user inputs.
3. Once you have entered the required details into the inputs, turn on 3commas comments. They should appear on the chart (looks messy).
4. Now you can add the alert where you should paste the 3commas Webhook URL: 3commas.io
5. For the alert message text insert the placeholder {{strategy.order.comment}} and delete the rest. 6. Once the alert is saved, you can turn off those 3commas comments to have a clearer chart.
7. With a new alert, the bot and trade should launch.
Long or Short trades are determined with a crossing of the fast MA over the slow MA for Long and the opposite for Short. By checking Close position on MA cross the deal will close on a crossover/under of the 2 MA's
You can select from various different MA's and of course lenghts. You can add both EMA filter on any lenght aswell as ATR to determine to go long or short.
Using the MA gap can help you to not enter trades in a low volatile ranging market.
The RSI filter, sets the maximum RSI threshold for a long position and the minimum for a short. By default and what i recomend is that you enter Longs when RSI is above 50 and shorts when RSI are below 50.
-You can set confirmation of the trade direction with RSI , i.e. for Long the RSI must rise a specified number of bars back, vice versa for Short.
Enabling the pullback filter is great to avoid Longing tops and Shorting bottoms.
Stop loss can be set be either a fixed percentage or by using ATR
Take profit can be set by using percentage, ATR or RiskReward ratio(RR). if you use ATR as a stoploss i recomend using RR as the TP.
Yu can choose to trail the TP with either Percentage or ATR
Whats ahead. I really want to incorporate RSI divergencies, but haven't figured out how yet. Any other ideas would be greatly appreciated.
Have a look at my other strategies. They are similar to this but works abit differently.

Fibonacci Zone Study w/Candles - R3c0nTraderCredits:
Thank you "eykpunter" for granting me permission to use "Fibonacci Zones" to create this study
What does this do? How is it different?
This study was created so it can be used with the strategy 'Fibonacci Zone DCA Strategy - R3c0nTrader' in order to generate buy/sell signals for a 3Commas bot.
I was not able to use "eykpunter's" "Fibonacci Zones" to create these signals as it was missing the code for this. To create the buy or sell signal you need to be able to create an alert for when the price moves through the Fib levels. Unfortunately, the "price" is not available to be selected when creating an alert with the original study. Hence the need to create this new study and to resolve the issue.
This study has overlay turned off by default so it will appear in a separate pane below your active chart. I did this so I can clearly view and separate the strategy from the study.
Steps Overview:
Add the study to your chart
Configure the study to match the Fib length you used in the strategy.
Create Alerts from the study to generate the buy or sell signals to 3Commas
The below steps for creating signals are just examples! Since there are numerous ways you can open or close a trade from a signal, please do your own testing. This cannot be understated.
Example of how to generate buy signals:
After adding the study, select the three dots for this study and click on "Add an alert on Fibonacci Zone Study /w Candles…"
Setup the condition to trigger the alert. If you want to initiate a buy when the price crosses over the top of the lower Fib zone (downtrend zone), then use the following:
Condition>Fibonacci Zone Study>Price High>Crossing Up>Fibonacci Zone Study>Top-Low Fib Border
Options>Once per bar
Expiration>Open-ended
Alert actions>Webhook URL (use the 3Commas webhook URL)
Alert name>Enter a name, "BUY Paper-Fib-Bot"
Message>Use the 3Commas message from the paper bot to open the trade
Example of how to generate sell signals:
After adding the study, select the three dots for this study and click on "Add an alert on Fibonacci Zone Study /w Candles…"
Setup the condition to trigger the alert. If you want to initiate a sell when the price reaches the top of the High Fib zone (uptrend zone), then try the following:
Condition>Fibonacci Zone Study>Price High>Crossing Up>Fibonacci Zone Study>Top-High Fib Border
(Note: I used "Crossing Up" but "Crossing" is another option; I just haven't tested it yet with a paper bot)
Options>Once per bar
Expiration>Open-ended
Alert actions>Webhook URL (use the 3Commas webhook URL)
Alert name>Enter a name, "SELL Paper-Fib-Bot"
Message>Use the 3Commas message from the paper bot to close the trade

5min Williams Fractals scalping (3commas)Another strategy I'm learning Pine Script on. It is inspired by a MoneyZG youtube strategy called "Easy 5 Minute Scalping Strategy (Simple to Follow Scalping Trading Strategy)".
Again this is a one order per trade strategy compatible with the 3commas bot (works also with the free 3commas subscription). This strategy is based on the signals from Williams Fractals, taking the signals in reverse - red triangle indicates a bottom and hence we go long. The green triangle indicates a top so we go short. By default these signals are only accepted if they occur between the two Emas. However, you can also turn this off and when a WF signal comes in, only the current price has to be between the Emas. Stop loss is set to the current Ema slow and the take profit is a multiple of the distance to the slow ema.
Like previously I have added different filters as well as the ability to view essential things like the WF signal and Emas. I hope the script will help you to be more successful and if so it would be great if you could share here your setups, or tips on what would be good to refine to make it an even a more profitable strategy. Kind of a community approach so that we help each other out :).
Instructions for the 3commas connector:
1. First, you need to prepare 3commas Long/Short bots that will only listen to custom TV signals.
2. Inputs for the 3commas bot can be found at the end of the user inputs.
3. Once you have entered the required details into the inputs, turn on 3commas comments. They should appear on the chart (looks messy).
4. Now you can add the alert where you should paste the 3commas Webhook URL: 3commas.io
5. For the alert message text insert the placeholder {{strategy.order.comment}} and delete the rest.
6. Once the alert is saved, you can turn off those 3commas comments to have a clearer chart.
7. With a new alert, the bot and trade should launch.
In the near future I would like to publish more scripts that will carry similar elements as the first two, incl. compatibility with 3commas (I don't have access to another bot system). I will choose some strategies myself, but I will also be glad for some tips on what strategy would be good to do and is still missing here on Tradingview (short youtube videos or brief strategy manuals would be great).
Thanks and keep it up
PS: My screen values starting at Long Target Profit and ending at Pullback NOT greater than: 1.5; 1.5; 0; ON; 1; 2; OFF; 17; 36; ON; 0.05; ON; Chart; 14; 46; 50; 48.5; 51; OFF; 1; ON; 4; 2.

Investment Boat(Yatırım Botu)English:
The investment bot plugin works according to past 90 bar(candle) statistics. It shows goals that you can use to detect cheap products and products that you buy that you can easily sell. Invest bot add-on at the best price 1 (2 (Method:) to apply the technique of buying piece by piece, or the price becomes cheaper as it increases the amount of the purchase, make an average near the bottom, and opportunity all at once and decreases capital input blocks missing bottom: method of capture: the product helps to obtain.
Features:
The investment bot does not trade for you, it informs you at the most convenient times, purchases are made manually.
By automating all reviews of the product you want to review, it eliminates the human and error factor that doesn't leave a feature you forgot to review.
According to past statistics, it examines whether the price of the product being studied is suitable for profit, you can instantly determine which product is cheaper, and avoid getting caught up in FOMO.
Shows the correct Trading Method to be made in the trend determined by Trend Tracking. (Hold in rising trend, buy - sell in horizontal trend, buy opportunity in falling trend)
It shows Trend turns with colored candles and you get push notifications in important areas when the alarm is set. This feature is very important, it helps you capture the product from the bottom and continue the process by moving your stop level.
According to Old statistics examined when collecting and selling goods, it shows possible price return zones where you can easily buy and sell the product with red(buy) and green(sell) lines.
You may receive notifications in overbought and sold zones. Even if you don't follow the important price movements associated with the product with the alarm when you install an Alarm, you know that your eyes will not stay behind.
Keep the plugin to yourself with customizable settings.
Method 1:
The investment bot piecemeal purchase technique plugin scores between 0 and 6 based on the price of the product; 3x, 5x. Let's think of the X value as $ 100. It looks like a $ 500 transaction will open for 3x points, 300 points, 5x points. thanks to purchases made using the piecemeal purchase technique, you provide an average price close to the lower price of the product that returns from the bottom. A 0x score indicates that this product is not suitable for medium-and long-term purchases, its price is expensive, but it is your job to green lines hit-and-run operations.
Example usage: we decided to buy Bitcoin we want to buy Bitcoin we divide the capital you set aside to buy Bitcoin into 21 parts (1x+2x+3x+4x+5x+6x=21x) if Bitcoin were at the current 3x level (3x+4x+5x=12x) we would divide it into 12 parts. Our initial purchase support and resistance lines after raising the price if the price rises, we thought we would make a left turn at the profit level we made, but it could be pulled down if it goes according to the price level we continue to add, in the process of adding each, when adding the product, to give a signal to return the price if we don't. Sometimes it can drop from 2 to 3 levels without adding products skipped level we can shop by adding your purchases to the current level you have decided. If you have collected enough products, all that remains is to wait for the rise, so you can collect the investment you have created from the appropriate levels, piece by piece or wholesale, at targets indicated by Green lines created according to the old statistics. Don't forget to make a profit.
Method 2:
The yellow candle and purple candle that come in trend turns indicate the most accurate times for us to get in and out of the process. The price is to see the yellow candle, we get the product from here and immediately between 1-3% here now the goal is that if the circuit does not occur and the drop will be lower, we catch the product from the bottom, but thanks to the product caught from the bottom, we can not stop a few times until this return to get the product out of the process, when there should be a stop under the yellow candle, stop losses that turn from the bottom area are very easily compensated. After you purchase the product, a rising trend if the trend breaks the current trend continues to fall, if the process exits, but does not continue to decline-a trend we expect to see goals worsen purple candle purple candle means to sell, but when we see these purple candles, how much you sell doesn't mean we're going to stop level under the purple candle, cheap and easy to buy products we don't sell if the rising trend continues, we are constantly moving under the purple candle to the stop level. You get maximum profit at the end of the transaction, but sometimes Future fake moves and needles will cause you to stop unnecessarily, unfortunately there is no solution or measure for this.
Warning: the investment bot plugin aims to shop at the right time, but before buying, supports must be withdrawn, it must be verified that the price does not fall only to act according to the plugin and to trade non-stop (even when collecting goods 10-20% should be placed, even better than losing 70-80% in possible large falls) is wrong. Depending on the chart time you use, the results calculated by the plugin may vary, and smaller time statistics give less reliable results.
Türkçe:
Yatırım Botu eklentisi geçmiş 90 bar(mum) istatistiklerine göre çalışmaktadır. Ucuzlayan ürünleri tespit etmek için kullanabileceğiniz gibi aldığınız ürünleri rahatça satabileceğiniz hedefleri de göstermektedir. Yatırım Botu eklentisi size tepeden ürün aldırmaz ürünü en uygun fiyattan alabilmeniz için (Yöntem 1:) parçalı alım tekniği uygulamanıza yada (Yöntem 2:) dip yakalamanıza yardımcı olur: Fiyat ucuzladıkça alım miktarını arttırarak ortalamanızın dibe yakın olmasını sağlar ayrıca tüm sermayeniz ile tek seferde girip düşüşlerde fırsatları kaçırmanıza engel olur.
Özellikleri:
Yatırım Botu sizin yerinize alım satım yapmaz en uygun zamanlarda sizi bilgilendirir, alımlar manuel yapılır.
İncelenmek istenen ürün ile ilgili tüm incelemeleri otomatik yaparak incelemeyi unuttuğunuz bir özellik bırakmaz insan ve hata faktörünü ortadan kaldırır.
İncelenen ürün fiyatının kazanç elde edilebilmesi için uygun durumda olup olmadığını geçmiş istatistiklere göre inceler hangi ürünün daha fazla ucuzladığını anında tespit edebilirsiniz, FOMO'ya kapılmanızın önüne geçer tepeden malı elinize veremezler.
Trend takibi ile tespit edilen trend'te yapılması doğru olan trade yöntemini gösterir. (Yükselen Trend'te Alınan Tutulur, Yatay Trend'te Al - Sat, Düşen Trend'te ise Fırsat Alımı)
Trend dönüşlerini renkli mumlar ile gösterir ve alarm kurulduğunda önemli bölgelerde anlık bildirimler alırsınız. Bu özellik çok önemlidir ürünü en dipten yakalamanıza ve stop seviyenizi taşıyarak işleme devam etmenize yardımcı olur.
Mal toplarken ve satarken incelenen eski istatistiklere göre ürünü kolayca alabileceğiniz ve satabileceğiniz muhtemel fiyat dönüş bölgelerini kırmızı(alış) ve yeşil(satış) çizgiler ile gösterir.
Aşırı alım ve satım bölgelerinde bildirim alabilirsiniz. Alarm kurduğunuzda alarm bulunan ürün ile ilgili önemli fiyat hareketlerini takip etmeseniz bile bilirsiniz, gözünüz arkada kalmaz.
Özelleştirilebilir ayarlar ile eklentiyi kendinize uydurun.
Yöntem 1:
Yatırım Botu Parçalı Alım Tekniği Eklentisi ürünün fiyatına bakarak ucuzlama durumunu 0 ile 6 arasında puanlar; 3x, 5x gibi. X değerini 100 dolar olarak düşünelim. 3x olan puana 300 dolarlık 5x olan puana 500 dolarlık işlem açılacak gibi. Parçalı alım tekniği ile yapılan alımlar sayesinde fiyatı dipten dönen ürünün dip fiyatına yakın bir ortalama sağlarsınız. 0x puanı o ürünün orta uzun vade alım için uygun olmadığını fiyatının pahalı olduğunu gösterir ancak yeşil hedeflere kadar vur kaç işlemleri yapmak sizin bileceğiniz iştir.
Örnek Kullanım: Bitcoin almaya karar verdik alım yapmak istiyoruz Bitcoin almak için ayırdığınız sermayeyi 21 parçaya bölüyoruz (1x+2x+3x+4x+5x+6x=21x) eğer Bitcoin şuan 3x alınabilir seviyede olsaydı (3x+4x+5x=12x) 12 parçaya bölecektik. İlk alımımızı destek ve direnç çizgilerini çektikten sonra fiyatın yukarı dönüş yapacağını düşündüğümüz seviyeden yapıyoruz fiyat yukarı giderse hemen kar ediyoruz ancak oldu da aşağı giderse alınabilir fiyat seviyelerine göre ekleme yapmaya devam ediyoruz her ekleme işlemi yapılırken fiyatın yukarı dönüş için bir sinyal vermesi şart ürün düşerken ekleme yapmıyoruz. Bazen ürün biz ekleme yapmadan 2 3 seviye birden düşebilir burada karar sizin atlanan seviye alımlarını mevcut seviyeye ekleyerek alım yapabilirsiniz. Yeterince ürün topladıysanız geriye sadece yükselişi beklemek kalır uygun seviyelerden toplayarak oluşturduğunuz yatırımı eski istatistiklere göre oluşturulan Yeşil Çizgilerle gösterilen hedeflerde parça parça yada toptan satabilirsiniz. Kar almayı ihmal etmeyin.
Yöntem 2:
Trend dönüşlerinde gelen sarı mum ve mor mum işleme girmemiz ve çıkmanız için en doğru zamanları gösterir. Sarı mum'u gördüğünüzde fiyat dip bölgesinden dönüş yapıyordur ürünü buradan alır ve hemen sarı mum altına stop koyarız %1-3 arasında olmalı daha fazla değil burada amaç eğer dönüş gerçekleşmez ve düşüş devam ederse işlemden çıkıp ürünü daha aşağıda gerçekleşecek dönüşten tekrar almaktır, ürünü dipten yakalayana kadar birkaç sefer stop olabiliriz ancak dipten yakalanan ürün sayesinde stop zararları çok rahat telafi edilmektedir. Ürünü aldıktan sonra bulunduğumuz trend yükselen bir trend ise kolay al-sat hedeflerinde ürünü ucuza satmıyoruz mor mum görmeyi bekliyoruz mor mum trend'in bozulabileceği anlamını taşıyor ancak kesin bozulacak elindekini sat kaç demek değildir bu nedenle mor mum'u gördüğümüzde stop seviyemizi mor mum altına taşıyoruz trend bozulur düşüş devam ederse işlemden çıkmış oluyoruz ancak düşüş devam etmez yükselen trend devam ederse stop seviyemizi sürekli mor mum altına taşıyarak ilerliyoruz. Sonunda maximum kar alarak işlemden çıkıyoruz ancak bazen gelecek fake hareketler ve iğneler gereksiz stop olmanıza neden olacaktır bunun bir çözümü yada önlemi yok malesef.
Uyarı: Yatırım Botu eklentisi doğru zamanlarda alım yaptırmayı amaçlar ancak alım yapmadan önce destekler çizilmeli fiyatın aşağı gitmediği onaylanmalıdır sadece eklentiye göre hareket etmek ve stopsuz işlem yapmak (Mal toplarken dahi %10-20 aşağıya bile olsa mutlaka konulmalıdır olası büyük düşüşlerde %70-80 kaybetmekten iyidir) yanlıştır. Kullandığınız grafik zamanına göre eklentinin hesapladığı sonuçlar değişebilir, küçük zaman istatistikleri daha az güvenilir sonuçlar verir.

Strategy - Bobo PAPATRHi I've revamped this bot mentioned in the linked idea to make it work with v4 of pine. In doing so there are some very significant changes to how it works. The main one is that it no longer uses traditional daily pivot calculations to calculate the bands. It creates a more dynamic intraday set of pivot points based on recent price action rather than yesterday's ohlc. As published, the bot is tuned for a 15 min time frame. But it actually works well on lower time frames you just need to adjust the lookback periods in settings a bit to re tune it. It's also tuned to ES really but will need tweaking for a different instrument at the very least.
The basic concept is recent price action is used to calculate a 'middle' around which red and green bands are located. Their position or width is largely determined by recent volatility. The middle line is again calculated from recent price action. The three lines from that form a tradeable range with green at the top and red at the bottom. The strategy is simple enough, it shorts as it sinks from outside red, and longs when rising above green. The basic principle being that once you enter that range you have a high probability of hitting the middle before you hit your stop loss. So the basic principle is you are trying to capture the inherent ranginess of liquid indices like S&P 500. That back and forth movement that happens. The bot is capturing this by fading extremes of a recent range but the problem with that is you'dd get murdered in a strong trend. To mitigate that there is a trend calculation running in the background the will prevent trading against firm trends mostly. So the bot should trade mostly in rangy conditions because that is what it is trying to do.
Bot will close issue close signals automatically upon crossing the middle, it also will close automatically at predefined stops or limits. These values are denominated in market mintick values. For example the CFD SPX500 has a mintick of 0.1. Therefore a stop value of 100 will equate to 10 points on the index. If trading the same market via ES1! the mintick value is different - 0.25. So in this case a value of 40 is required to set the stop at 10 points.
Anyway shout if you have questions. Hope it's useful.
TVC:SPX OANDA:SPX500USD

Kairos [Signals]Kairos bot looks for the opportune time to buy low and sell high at targets
It provides signals to open and close trades, and indicates favorable positions for a stop loss and profit taking
The Kairos bot can be used on any chart and on any time frame
---BACKTESTER---
Using the backtester script the user can look at a chart's history between selected dates to find optimal bot settings and optimal time frames
The backtester is based on general percentages for profit taking as indicated below:
-------------T1 T2 T3 T4 T5 T6 CLOSE
1 Target: 50% 50%
2 Targets: 50% 25% 25%
3 Targets: 40% 30% 20% 10%
4 Targets: 40% 25% 20% 10% 5%
5 Targets: 35% 25% 20% 10% 5% 5%
6 Targets: 30% 25% 20% 10% 5% 5% 5%
ie: If 2 targets are selected:
- 50% of investment will be taken at target 1
- 25% of investment will be taken at target 2
- and the remainder 25% will be taken when the trade is closed on a close signal
However, it is up to the user's own risk appetite to determine where and how much profit to take
Note that the backtester does not have any on screen indicators other than OPEN and CLOSE, however profit taking can be indicated by ticking the Style -> Trades on Chart tick box on the settings userform
---SIGNALS---
The signals script can be used for automation and can indicate up to 6 potential Profit Targets, as well as a Stop Loss based on how many bars back needs to be taken into consideration
The signals (Open/Close) can be automated using TradingView alerts, however the Stop Loss and Profit Taking are only indicators and are for the users own interpretation
The user does not have to place a Stop Loss or take profit at the Targets if so wished, the bot can be used to simply buy on an OPEN signal and sell on a CLOSE signal, however, the backtester will indicate that it is far more profitable to take profits.
It is advised to take profits just below indicated Targets as these are potentially high selling zones and price action can sometimes turn down just short of these targets.
---INVITE-ONLY SCRIPT---
This is an invite-only script, so if you would like to try out Kairos Bot, send me a message

Kairos [Backtester]Kairos bot looks for the opportune time to buy low and sell high at targets
It provides signals to open and close trades, and indicates favorable positions for a stop loss and profit taking
The Kairos bot can be used on any chart and on any time frame
---BACKTESTER---
Using the backtester script the user can look at a chart's history between selected dates to find optimal bot settings and optimal time frames
The backtester is based on general percentages for profit taking as indicated below:
-------------T1 T2 T3 T4 T5 T6 CLOSE
1 Target: 50% 50%
2 Targets: 50% 25% 25%
3 Targets: 40% 30% 20% 10%
4 Targets: 40% 25% 20% 10% 5%
5 Targets: 35% 25% 20% 10% 5% 5%
6 Targets: 30% 25% 20% 10% 5% 5% 5%
ie: If 2 targets are selected:
- 50% of investment will be taken at target 1
- 25% of investment will be taken at target 2
- and the remainder 25% will be taken when the trade is closed on a close signal
However, it is up to the user's own risk appetite to determine where and how much profit to take
Note that the backtester does not have any on screen indicators other than OPEN and CLOSE, however profit taking can be indicated by ticking the Style -> Trades on Chart tick box on the settings userform
---SIGNALS---
The signals script can be used for automation and can indicate up to 6 potential Profit Targets, as well as a Stop Loss based on how many bars back needs to be taken into consideration
The signals (Open/Close) can be automated using TradingView alerts, however the Stop Loss and Profit Taking are only indicators and are for the users own interpretation
The user does not have to place a Stop Loss or take profit at the Targets if so wished, the bot can be used to simply buy on an OPEN signal and sell on a CLOSE signal, however, the backtester will indicate that it is far more profitable to take profits.
It is advised to take profits just below indicated Targets as these are potentially high selling zones and price action can sometimes turn down just short of these targets.
---INVITE-ONLY SCRIPT---
This is an invite-only script, so if you would like to try out Kairos Bot, send me a message
