Crypto Market Change in BTC [Fingers]Crypto Market Change provides an indication of whether the value of a basket of 19 coins traded in BTC on Binance (as of July 12, 2018) are headed up or down. A simple moving average of the percentage change in BTC price for each coin is calculated. The moving averages are then summed and displayed. A measure of price volatility of indicated by standard deviation bands. Period, moving average length, and number of standard deviations are adjustable.
Cerca negli script per "crypto"

Crypto Market Change in USDT [Fingers]Crypto Market Change provides an indication of whether the value of a basket of 16 coins traded in USDT on Binance (as of July 12, 2018) are headed up or down. A simple moving average of the percentage change in USDT price for each coin is calculated. The moving averages are then summed and displayed. A measure of price volatility of indicated by standard deviation bands. Period, moving average length, and number of standard deviations are adjustable.

Crypto Market Maker w/ AlertsUltimate Trading Tool. Simple af 1.07% 1.07% . Follow signals, chart if you want to confirm.
Takes only trades with proper risk to reward ratio.
At times calls absolute top and bottom.
Can be used on ALTs as well.
Based on Neural Networks.
Can be used on 60m,30m,15m,5m, 3m 0.32% 0.32% 0.32% -0.88% - As this is basically a SCALPER. (use with leverage)
Works best in my experience on 15m.
This is the indicator for alerts, check my profile for the strategy with backtest.
Alerts -> Crypto Market Maker -> Plot -> Long/Short - Once Per Bar Close
This Level of Strategy, will not be free. PM for access - Monthly Subscription.

Crypto Ichimoku V.1Ichimoku Cloud with settings recommended for crypto by trader IAmSatoshi . Includes a handy checkbox to double inputs, and alerts that can be set for when the price crosses the bottom or top of the cloud.
This script also includes an ichimoku signal count. The signal count is an unweighted sum of positive or negative ichimoku signals with the greatest total being shown in either green(long>short) or red(short>long) or white(0, long==short). The signal count is only shown when their is a new signal or a signal is no longer valid.

Cryptocurrency StrengthMulti-Currency Analysis: Monitor up to 19 different currencies simultaneously, including major pairs like USD, EUR, JPY, and GBP, as well as emerging market currencies such as CNY, INR, and BRL.
Customizable Display: Easily toggle the visibility of each currency and personalize their colors to suit your preferences, allowing for a tailored analysis experience.
Real-Time Strength Measurement: The indicator calculates and displays the relative strength of each currency in real-time, helping you identify potential trends and trading opportunities.
Clear Visual Representation: With color-coded lines and a dynamic legend, the indicator presents complex currency relationships in an easy-to-understand format.
Advantages
Comprehensive Market View: Gain insights into the broader forex market dynamics by analyzing multiple currencies at once.
Trend Identification: Quickly spot strong and weak currencies, aiding in the identification of potential trending pairs.
Divergence Detection: Use the indicator to identify divergences between currency strength and price action, potentially signaling reversals or continuation patterns.
Flexible Time Frames: Apply the indicator across various time frames to align with your trading strategy, from intraday to long-term analysis.
Enhanced Decision Making: Make more informed trading decisions by understanding the relative strength of currencies involved in your trades.
Unique Qualities
TSI-Based Calculations: Utilizes the True Strength Index for a more nuanced and responsive measure of currency strength compared to simple price-based indicators.
Adaptive Legend: The indicator features a dynamic legend that updates automatically based on the selected currencies, ensuring a clutter-free and relevant display.
Emerging Market Inclusion: Unlike many standard currency strength indicators, this tool includes a wide range of emerging market currencies, providing a truly global perspective.
Whether you're a seasoned forex trader or just starting out, this Currency Strength Indicator offers valuable insights that can complement your existing strategy and potentially improve your trading outcomes. Its combination of comprehensive analysis, customization options, and clear visualization makes it an essential tool for navigating the complex world of currency trading.

Crypto Punk [Bot] (Zeiierman)█ Overview
The Crypto Punk (Zeiierman) is a trading strategy designed for the dynamic and volatile cryptocurrency market. It utilizes algorithms that incorporate price action analysis and principles inspired by Geometric Brownian Motion (GBM). The bot's core functionality revolves around analyzing differences in high and low prices over various timeframes, estimating drift (trend) and volatility, and applying this information to generate trading signals.
█ How to use the Crypto Punk Bot
Utilize the Crypto Punk Bot as a technical analysis tool to enhance your trading strategy. The signals generated by the bot can serve as a confirmation of your existing approach to entering and exiting the market. Additionally, the backtest report provided by the bot is a valuable resource for identifying the optimal settings for the specific market and timeframe you are trading in.
One method is to use the bot's signals to confirm entry points around key support and resistance levels.
█ Key Features
Let's explain how the core features work in the strategy.
⚪ Strategy Filter
The strategy filter plays a vital role in the entries and exits. By setting this filter, the bot can identify higher or lower price points at which to execute trades. Opting for higher values will make the bot target more long-term extreme points, resulting in fewer but potentially more significant signals. Conversely, lower values focus on short-term extreme points, offering more frequent signals focusing on immediate market movements.
How is it calculated?
This filter identifies significant price points within a specified dynamic range by applying linear regression to the absolute deviation of the range, smoothing out fluctuations, and determining the trend direction. The algorithm then normalizes the data and searches for extreme points.
⚪ External AI filter
The external AI filter allows traders to incorporate two external sources as signal filters. This feature is particularly useful for refining their signal accuracy with additional data inputs.
External sources can include any indicator applied to your TradingView chart that produces a plot as an output, such as a moving average, RSI, supertrend, MACD, etc. Traders can use these indicators of their choice to set filters for screening signals within the strategy.
This approach offers traders increased flexibility to select filters that align with their trading style. For instance, one trader might prefer to take trades when the price is above a moving average, while another might opt for trades when the MACD is below the MACD signal line. These external filters enable traders to choose options that best fit their trading strategies. See the example below. Note that the input sources for the External AI filter can be any indicator applied to the chart, and the input source per se does not make this strategy unique. The AI filter takes the selected input source and applies our function to it. So, if a trader selects RSI as an input filter, RSI is not unique, but how the source is computed within the AI functions is.
How is it calculated?
Once the external filters are selected and enabled within the settings panel, our AI function is applied to enhance the filter's ability to execute trades, even when the set conditions of the filter are not met. For instance, if a trader wants to take trades only when the price is above a moving average, the AI filter can actually execute trades even if the price is below the moving average.
The filter works by combining k-nearest Neighbors (KNN) with Geometric Brownian Motion (GBM) involves first using GBM to model the historical price trends of an asset, identifying patterns of drift and volatility. KNN is then applied to compare the current market conditions with historical instances, identifying the closest matches based on similar market behaviors. By examining the drift values of these nearest historical neighbors, KNN predicts the current trend's direction.
The AI adaptability value is a setting that determines how flexible the AI algorithm is when applying the external AI filter. Setting the adaptability to 10 indicates minimal adaptability, suggesting that the bot will strictly adhere to the set filter criteria. On the other hand, a higher adaptability value grants the algorithm more leeway to "think outside the box," allowing it to consider signals that may not strictly meet the filter criteria but are deemed viable trading opportunities by the AI.
█ Examples
In this example, the RSI is used to filter out signals when the RSI is below the smoothing line, indicating that prices are declining.
Note that the external filter is specifically designed to work with either 'LONG ONLY' or 'SHORT ONLY' modes; it does not apply when the bot is set to trade on 'BOTH' modes. For 'LONG ONLY' positions, the filter criteria are met when source 1 is greater than source 2 (source 1 >= source 2). Conversely, for 'SHORT ONLY' positions, the filter criteria require source 1 to be less than source 2 (source 1 <= source 2).
Examples of Filter Usage:
Long Signals: To receive long signals when the closing price is higher than a moving average, set Source 1 to the 'close' price and Source 2 to a moving average value. This setup ensures that signals are generated only when the closing price exceeds the moving average, indicating a potential upward trend.
█ Settings
⚪ Set Timeframe
Choosing the correct entry and exit timeframes is crucial for the bot's performance. The general guideline is to select a timeframe that is higher than the one currently displayed on the trading chart but still relatively close in duration. For instance, if trading on a 1-minute chart, setting the bot's Timeframe to 5 minutes is advisable.
⚪ Entry
Traders have the flexibility to configure the bot according to their trading strategy, allowing them to choose whether the bot should engage in long positions only, short positions only or both. This customization ensures that the bot aligns with the trader's market outlook and risk tolerance.
⚪ Pyramiding
Pyramiding functionality is available to enhance the bot's trading strategy. If the current position experiences a drawdown by a specified number of points, the bot is programmed to add new positions to the existing one, potentially capitalizing on lower prices to average down the entry cost. To utilize this feature, access the settings panel, navigate to 'Properties,' and look for 'Pyramiding' to specify the number of times the bot can re-enter the market (e.g., setting it to 2 allows for two additional entries).
⚪ Risk Management
The bot incorporates several risk management methods, including a regular stop loss, trailing stop, and risk-reward-based stop loss and exit strategies. These features assist traders in managing their risk.
Stop Loss
Trailing Stop
⚪ Trading on specific days
This feature allows trading on specific days by setting which days of the week the bot can execute trades on. It enables traders to tailor their strategies according to market behavior on particular days.
⚪ Alerts
Alerts can be set for entry, exit, and risk management. This feature allows traders to automate their trading strategy, ensuring timely actions are taken according to predefined criteria.
█ How is Crypto Punk calculated?
The Crypto Punk Bot is a trading bot that utilizes a combination of price action analysis and elements inspired by Geometric Brownian Motion (GBM) to generate buy and sell signals for cryptocurrencies. The bot focuses on analyzing the difference between high and low prices over various timeframes, alongside estimates of drift (trend) and volatility derived from GBM principles.
Timeframe Analysis for Price Action
The bot examines multiple timeframes (e.g., daily, weekly) to identify the range between the highest and lowest prices within each period. This range analysis helps in understanding market volatility and the potential for significant price movements. The algorithm calculates the trading range by applying maximum and minimum functions to the set of prices over your selected timeframe. It then subtracts these values to determine the range's width. This method offers a quantitative measure of the asset's price volatility for the specified period.
Estimating Drift (Trend)
The bot estimates the drift component, which reflects the underlying trend or expected return of the cryptocurrency. The algorithm does this by estimating the drift (trend) using Geometric Brownian Motion (GBM), which involves determining an asset's average rate of return over time, reflecting the asset's expected direction of movement.
Estimating Volatility
Volatility is estimated by calculating the standard deviation of the logarithmic returns of the cryptocurrency's price over the same timeframe used for the drift calculation. Geometric Brownian Motion (GBM) involves measuring the extent of variation or dispersion in the returns of an asset over time. In the context of GBM, volatility quantifies the degree to which the price of an asset is expected to fluctuate around its drift.
Combining Drift and Volatility for Signal Generation
The bot uses the calculated drift and volatility to understand the current market conditions. A higher drift coupled with manageable volatility may indicate a strong upward trend, suggesting a potential buy signal. Conversely, a low or negative drift with increasing volatility might suggest a weakening market, triggering a sell signal.
█ Strategy Properties
This script backtest is done on the 1 hour chart Bitcoin, using the following backtesting properties:
Balance (default): 10 000 (default base currency)
Order Size: 10% of the equity
Commission: 0.05 %
Slippage: 500 ticks
Stop Loss: Risk Reward set to 1
These parameters are set to provide an accurate representation of the backtesting environment. It's important to recognize that default settings may vary for several reasons outlined below:
Order Size: The standard is set at one contract to facilitate compatibility with a wide range of instruments, including futures.
Commission: This fee is subject to fluctuation based on the specific market and financial instrument, and as such, there isn't a standard rate that will consistently yield accurate outcomes.
We advise users to customize the Script Properties in the strategy settings to match their personal trading accounts and preferred platforms. This adjustment is crucial for obtaining practical insights from the deployed strategies.
-----------------
Disclaimer
The information contained in my Scripts/Indicators/Ideas/Algos/Systems does not constitute financial advice or a solicitation to buy or sell any securities of any type. I will not accept liability for any loss or damage, including without limitation any loss of profit, which may arise directly or indirectly from the use of or reliance on such information.
All investments involve risk, and the past performance of a security, industry, sector, market, financial product, trading strategy, backtest, or individual's trading does not guarantee future results or returns. Investors are fully responsible for any investment decisions they make. Such decisions should be based solely on an evaluation of their financial circumstances, investment objectives, risk tolerance, and liquidity needs.
My Scripts/Indicators/Ideas/Algos/Systems are only for educational purposes!

Cryptocurrency Cointegration Matrix (SpiritualHealer117)This indicator plots a cointegration matrix for the pairings of 100 cryptocurrencies. The matrix is populated with ADF t-stats (from an ADF-test with 1 lag). An ADF-test (Augmented Dickey-Fuller test) tests the null hypothesis that an AR process has a unit root. If rejected, the alternative hypothesis is usually that the AR process is either stationary or trend-stationary. This model extends upon Lejmer's Cointegration Matrix for forex by enabling the indicator to use cryptocurrency pairs and allows for significantly more pairs to be analyzed using the group selection feature. This indicator arose from collaboration with TradingView user CryptoJuju.
This indicator runs an ADF-test on the residuals (spread) of each pairing (i.e. a cointegration test). It tests if there is a unit root in the spread between the two assets of a pairing. If there is a unit root in the spread, it means the spread varies randomly over time, and any mean reversion in the spread is very hard to predict. By contrast, if a unit root does not exist, the spread (distance between the assets) should remain more or less constant over time, or rise/fall in close to the same rate over time. The more negative the number from an ADF-test, the stronger the rejection of the idea that the spread has a unit root. In statistics, there are different levels which correspond with the confidence level of the test. For this indicator, -3.238 equals a confidence level of 90%, -3.589 equals a confidence level of 95% and -4.375 equals a confidence level of 99% that there is not a unit root. So the colors are based on the confidence level of the test statistic (the t-stat, i.e. the number of the pairing in the matrix). So if the number is greater than -3.238 it is green, if it's between -3.238 and -3.589 it's yellow, if it's between -3.589 and -4.375 it's orange, and if its lower than -4.375 it's red.
There are multiple ways to interpret the results. A strong rejection of the presence of a unit root (i.e. a value of -4.375 or below) is not a guarantee that there is no unit root, or that any of the two alternative hypotheses (that the spread is stationary or trend-stationary) are correct. It only means that in 99% of the cases, if the spread is an AR process, the test is right, and there is no unit root in the spread. Therefore, the results of this test is no guarantee that the result proves one of the alternative solutions. Green therefore means that a unit root cannot be ruled out (which can be interpreted as "the two cryptocurrencies probably don't move together over time"), and red means that a unit root is likely not present (which can be interpreted as "the two cryptocurrencies may move together over time").
One possible way to use this indicator is to make sure you don't trade two pairs that move together at the same time. So basically the idea is that if you already have a trade open in one of the currency pairs of the pairing, only enter a trade in the other currency pair of that pairing if the color is green, or you may be doubling your risk. Alternatively, you could implement this indicator into a pairs trading system, such as a simple strategy where you buy the spread between two cryptocurrencies with a red result when the spread's value drops one standard deviation away from its moving average, and conversely sell when it moves up one standard deviation above the moving average. However, this strategy is not guaranteed to work, since historical data does not guarantee the future.
Specific to this indicator, there are 100 different cryptocurrency tickers which are included in the matrix, and the cointegration matrices between all the tickers can be checked by switching asset group 1 and asset group 2 to different asset groups. The ADF test is computed using a specified length, and if there is insufficient data for the length, the test produces a grayed out box.
NOTE: The indicator can take a while to load since it computes the value of 400 ADF tests each time it is run.

Crypto Coin Strength by News Crypto
This indicator calculates the strength score of a cryptocurrency and categorizes it into four categories - Very Weak, Weak, Strong, and Very Strong. The strength score is determined by calculating the RSI of the cryptocurrency's price, multiplied by the trend direction based on the fast and slow moving averages.
Long description: This indicator is designed to help cryptocurrency traders determine the strength of a particular cryptocurrency. It calculates a strength score based on the RSI of the cryptocurrency's price, multiplied by the trend direction based on the fast and slow moving averages. The strength score is then categorized into four categories - Very Weak, Weak, Strong, and Very Strong. Traders can use this indicator to make informed decisions about when to enter or exit trades based on the strength of the cryptocurrency.
Inputs:
Fast MA Period: The period used for the fast moving average (default 10).
Slow MA Period: The period used for the slow moving average (default 30).
Strength Threshold: The threshold for the strength score to be considered strong (default 50.0).
Usage: To use this indicator, simply add it to your TradingView chart and adjust the input parameters as desired. The strength score and threshold line will be plotted on the chart, and a label will display the strength category at the last point of the indicator. Traders can use the strength score and category to make informed trading decisions based on the strength of the cryptocurrency.

Crypto Leverage Ratio [Market Cap / Open Interest in %]This indicator calculates what percentage of market cap data corresponds to open interest data.
Leverage Ratio = 1/(Market Cap / 100 * Open Interest)
Market Cap data comes from TradingView -> CRYPTOCAP:YOURCOINSYMBOL
Open Interest data comes from IntoTheBlock -> INTOTHEBLOCK:YOURCOINSYMBOL_PERPETUALOPENINTEREST
IntoTheBlock refresh perpetual data at the end of the day. It means there is no intraday data.
It can only be used in Daily or higher time intervals.
This indicator and any other indicator can not precisely calculate real leverage ratio except exchanges itself. This calculation is just based on assumption.
You can see the exact same result by just adding:
1/(CRYPTOCAP:BTC/100*INTOTHEBLOCK:BTC_PERPETUALOPENINTEREST)
to your symbol search, if your chart is a BTC chart.
"
The Futures Open Interest Leverage Ratio is calculated by dividing the market open contract value, by the market cap of the asset (presented as %). This returns an estimate of the degree of leverage that exists relative to market size as a gauge for whether derivatives markets are a source of deleveraging risk.
High Values indicate that futures market open interest is large relative to the market size. This increases the risk of a short/long squeeze, deleveraging event, or liquidation cascade.
Low Values indicate that futures market open interest is small relative to the market size. This is generally coincident with a lower risk of derivative led forced buying/selling and volatility.
Deleveraging Events such as short/long squeezes, or liquidation cascades can be identified by rapid declines in OI relative to market cap, and vertical drops in the metric.
-glassnode
"
says glassnode. I think it is more than that. Especially with MAs.

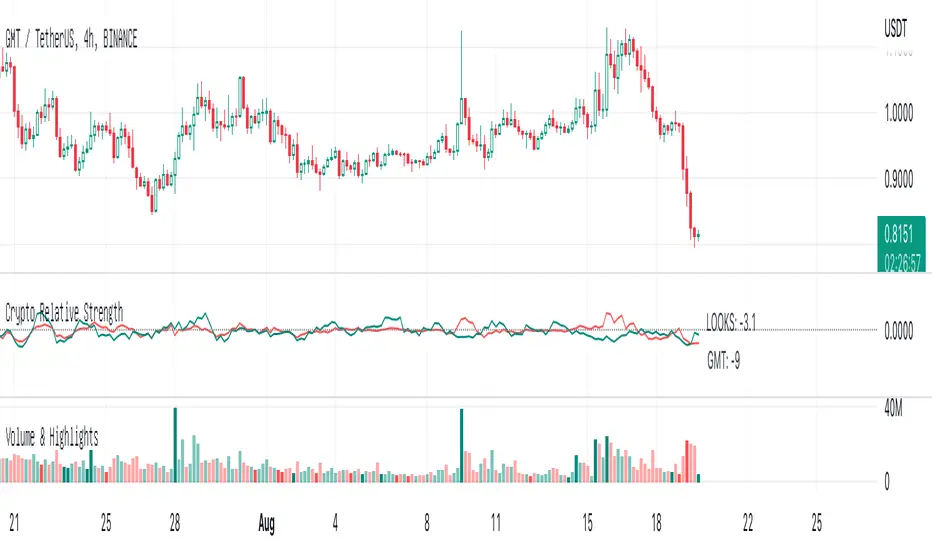
Crypto Relative StrengthCompare the percentage change of 8 most popular cryptocurrencies with BTC in last 5 periods, and mark out the best and worst performing cryptocurrency.
Crypto Breakout Buy/Sell Sequence
⚙️ Components & Sequence Multiple Timeframe (What It Does)
1. Bollinger Bands – Form the foundation by measuring volatility and creating the dynamic range where squeezes and breakouts occur.
2. Squeeze Dots – Show when price compresses inside the bands, signaling reduced volatility before expansion.
3. Breakout Event (Brk Dot) – Fires when price expands beyond the squeeze zone, confirming volatility expansion. (This paints Intra, before candle close)
4. Buy Signal – Confirms entry after a breakout is validated. (This paints at candle close)
5. Pump Signal – Flags sudden surges that extend sharply from the bands, often linked to strong inflows.
6. Momentum Stream – Tracks the strength of movement following the breakout, from continuation (🟢) to slowing (🟡) to exhaustion (🔴). (Resets at Pump Signal)
7. Overbought Indicator – Confirms when momentum has reached overheated conditions, often aligning with band extremes.
8. Sell Signal – Prints when exhaustion/reversal conditions are met, closing the trade cycle.
The Crypto Breakout Buy/Sell Sequence is a no-repaint event indicator that maps a full trade cycle using Bollinger-band-based volatility states: Bollinger Bands → Squeeze → Breakout → Buy → Pump → Momentum → Top Test → Overbought → Sell. Each stage is rule-based and designed to be read on standard candlesticks.
How It Works (System Logic)
Volatility framework: Bollinger Bands define dynamic range and compression/expansion.
Initiation: Squeeze → Breakout confirms expansion; Buy validates participation after expansion begins.
Management: Pump highlights unusual acceleration; Momentum stream tracks continuation → slowing → exhaustion.
Exhaustion/Exit: Top Testing + Overbought build the exhaustion case; Sell marks the sequence end.
How To Use (Quick Guide)
Wait for Squeeze → Breakout → Buy to establish a structured start.
Manage with Momentum:
🟢 continuation, 🟡 slowing, 🔴 exhaustion pressure.
Monitor extremes: Top Testing and/or Overbought = tighten risk.
Exit on Sell or on your risk rules when exhaustion builds.
Limitations & Good Practice
Signals reflect price/volatility behavior, not certainty.
Strong trends can remain extended; Overbought/Top Test ≠ instant reversal.
Always confirm with your own risk rules, position sizing, and market context.
Initial public release: integrated Squeeze/Breakout/Buy → Momentum → Exhaustion → Sell cycle; improved label clarity; cleaned defaults.
Disclaimer
For educational purposes only. Not financial advice. Past performance does not guarantee future results. Test before live use.
Thank You

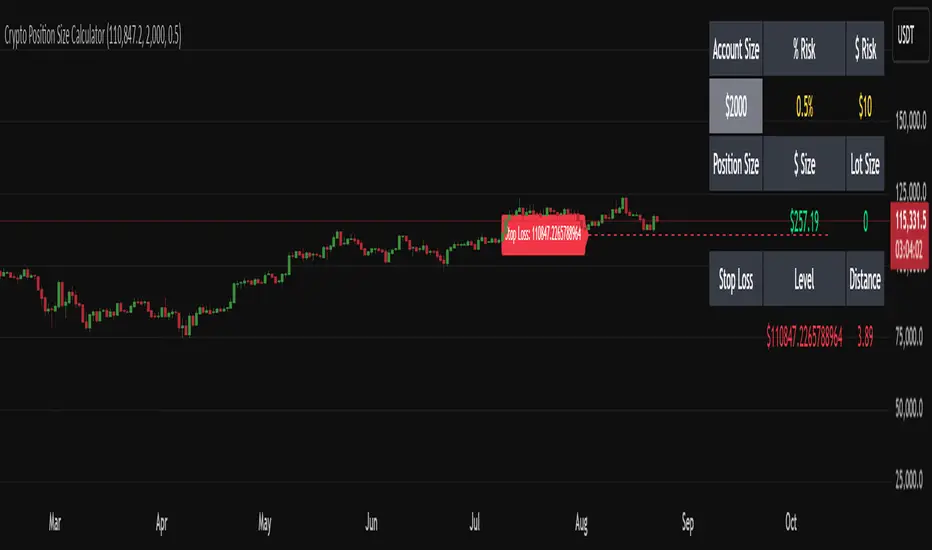
Crypto Position Size CalculatorPosition Size Calculator for Crypto.
This indicator uses the current price and a selected stop loss to calculate your position size without having to work it out elsewhere!
Simply set your account size, desired risk percentage and stop loss level and it will work out how many lots and the dollar value of your desired position.
Hope you enjoy!
Crypto Volume Data (VAH,POC,VAL)Crypto Volume Data (VAH, POC, VAL) — Multi-Exchange Aggregated Volume Zones
This indicator delivers a high-precision volume profile for crypto assets by aggregating real traded volume across Binance, Bybit, Coinbase, Kraken, OKX, and MEXC. It auto-detects multiple quote pairs (USD, USDT, USDC, FDUSD, USDT.P, USDC.P) and merges the live volume distribution respecting each exchange’s volume for that symbol to calculate institutional-grade VAH, POC, and VAL levels.
No matter which symbol or pair from which exchange is open on the chart, the script dynamically detects the base asset and fetches volume from all matching pairs on supported exchanges. For example, whether you load BTC/USDT, ETH/USDT.P, or SOL/FDUSD, the system identifies the symbol and aggregates volume from all relevant pairs of that symbol across all mentioned exchanges, weighting them based on real volume. This leads to significantly more accurate value areas — especially compared to single-source or single-pair profiles that miss fragmented liquidity and the real volume of each exchange.
This script is fully plug-and-play. There’s no need to select lookback windows or configure pairs — it's already optimized with pre-set internal parameters for common trading timeframes. (Still, you can adjust for your needs in the settings, but keep in mind more lookback is not necessarily a good thing — it might affect the accuracy of your output depending on the timeframe.)
Key Features:
Live aggregation of volume across 5 exchanges
Supports most listed altcoins with reliable quote pair coverage
Dynamic auto symbol/quote detection and normalization
Automatically adapts to any crypto chart without user setup
Real institutional zones — not synthetic, not heuristic
Why It Matters:
In fragmented crypto markets, liquidity isn’t centralized. Volume for a coin like ETH may be split between USDT on Binance, USD on Kraken, or USDC on MEXC. Most indicators ignore that. This tool doesn’t. It brings that volume together to provide the most contextually accurate VAH/POC/VAL levels possible, tailored to the charted asset and timeframe.
This isn't just another volume indicator. It’s built from the ground up to capture where the real trades happen — not just where price moved — and shows you the zones that institutions and large players respect.
Disclaimer:
This tool is for educational and informational purposes only. It does not constitute financial advice or an invitation to trade. Always do your own research and manage risk responsibly.
Credits:
Volume unification logic, cross-pair normalization, and exchange weighting system developed by me. No third-party libraries or reused scripts involved. Original architecture built from scratch for high-resolution crypto volume profile analysis.
Note:
Script designed to respect TradingView limits for both free and paid accounts, with a smart fallback system in case of hitting the limit. If you find any bug, error, or issue, kindly comment below. I will address and fix them ASAP.
Enjoy and cheers.

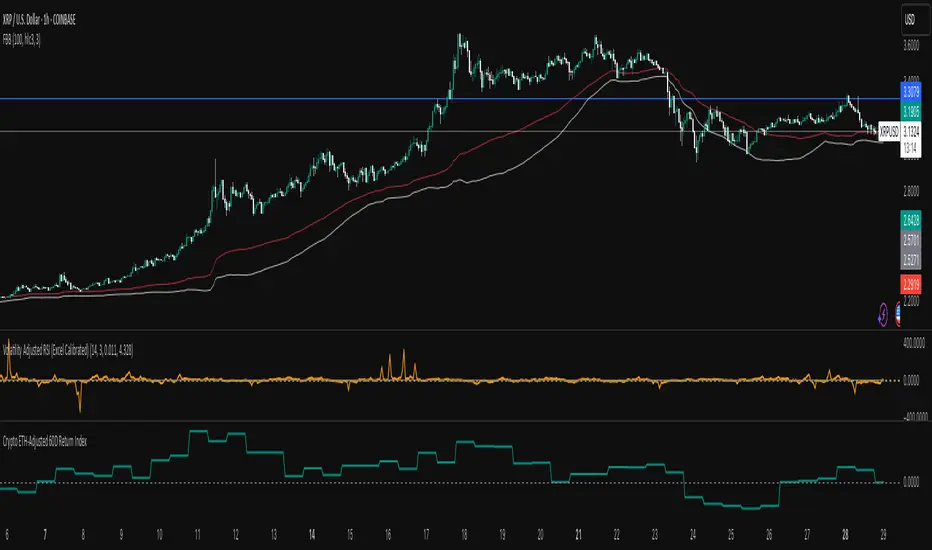
Crypto Weighted 60 Day Return Index60 Day Return of Crypto Index (Volatility Adjusted) weightings based on Holdings
BTC
ETH
SOL
AAVE
XRP
Crypto Risk Management Calculator BY MUNASARName:
📊 Crypto Risk Management Calculator by Munasar
Short Description:
A powerful tool to calculate daily risk, reward, position size, and risk-reward ratio for crypto trades.
Full Description:
This indicator is built for cryptocurrency traders who want to manage their risk with precision. It calculates your daily risk and reward based on account size, stop loss %, and take profit %.
You'll also get:
Position size per trade
Risk & reward per trade in $ and %
Take Profit levels
Risk-to-Reward ratio
Support for multiple trades per day
Perfect for both beginners and advanced traders who want to protect their capital and follow a consistent plan.
Created by Munasar

Crypto Narratives: Relative Strength V2Simple Indicator that displays the relative strength of 8 Key narratives against BTC as "Spaghetti" chart. The chart plots an aggregated RSI value for the 5 highest Market Cap cryopto's within each relevant narrative. The chart plots a 14 period SMA RSI for each narrative.
Functionality:
The indicator calculates the average RSI values for the current leading tokens associated with ten different crypto narratives:
- AI (Artificial Intelligence)
- DeFi (Decentralized Finance)
- Memes
- Gaming
- Level 1 (Layer 1 Protocols)
- AI Agents
- Storage/DePin
- RWA (Real-World Assets)
- BTC
Usage Notes:
The 5 crypto coins should be regularly checked and updated (in the script) by overtyping the current values from Rows 24 - 92 to ensure that you are using the up to date list of highest marketcap coins (or coins of your choosing).
The 14 period SMA can be changed in the indicator settings.
The indicator resets every 24 hours and is set to UTC+10. This can be changed by editing the script line 19 and changing the value of "resetHour = 1" to whatever value works for your timezone.
There is also a Rate of Change table that details the % rate of change of each narrative against BTC
Horizontal lines have been included to provide an indication of overbought and oversold levels.
The upper and lower horizontal line (overbought and oversold) can be adjusted through the settings.
The line width, and label offset can be customised through the input options.
Alerts can be set to triggered when a narrative's RSI crosses above the overbought level or below the oversold level. The alerts include the narrative name, RSI value, and the RSI level.

Crypto Cycle Projection📈 Crypto Cycle Projection – Indicator Description
This indicator is designed to visually track and forecast repeating price cycles in the crypto market. It highlights a defined time-based cycle starting from a chosen date or the latest bar on the chart. By identifying cycle Start, Midpoint, and End zones, traders can gain insights into timing-based market structure and possible pivot periods.
⚙️ User Settings Explained
Start Point
Start from Last Candle (useLastCandle) – When enabled, the cycle begins from the most recent candle on the chart.
Manual Date (Year / Month / Day) – If Start from Last Candle is disabled, you can manually set a specific start date for the cycle.
Display Options
- Show Projection (showZone) – Toggles the display of the main cycle projection.
- Show Outer Bars (showOuter) – Adds faded edge bars around the key cycle zones for better visual emphasis.
- Show Previous Cycle (showPreviousCycle) – Adds the prior cycle to the chart, going one full cycle period back from the main start point.
Show Next Cycle (showNextCycle) – Projects one additional cycle forward beyond the current.
Cycle Parameters
Cycle Period (cyclePeriod) – Defines the number of bars in a full cycle (e.g., 60 = 60 bars). This sets the spacing between Start → Midpoint → End.
Each cycle section is color-coded:
Start = White
Midpoint = Yellow
End = Green
These reference lines and zones help you align trades with cycle timing for potential reversals, continuations, or volatility expansions.
Co-author Credit:
Matthew Hyland @ParabolicMatt

Crypto Strategy SUSDT 10 minThis strategy is designed to trade the **SUSDT** pair on a **10-minute time frame**, using a combination of an Exponential Moving Average (EMA) and percentage-based Stop Loss (SL) and Take Profit (TP) levels.
### How the strategy works:
1. **EMA Calculation**:
- The strategy calculates a 24-period Exponential Moving Average (EMA) based on the closing price.
- This EMA serves as the primary trend indicator.
2. **Entry Conditions**:
- **Long Position**: A long position is entered when the closing price is above the EMA and the opening price is below the EMA. This indicates a potential upward trend.
- **Short Position**: A short position is entered when the closing price is below the EMA and the opening price is above the EMA. This indicates a potential downward trend.
3. **Stop Loss and Take Profit**:
- Both Stop Loss (SL) and Take Profit (TP) are calculated based on the entry price of the position.
- **For Long Positions**:
- Stop Loss is set as a percentage below the entry price.
- Take Profit is set as a percentage above the entry price.
- **For Short Positions**:
- Stop Loss is set as a percentage above the entry price.
- Take Profit is set as a percentage below the entry price.
- The percentage values for SL and TP can be adjusted in the strategy's settings (default: SL = 2%, TP = 4%).
4. **Exit Conditions**:
- The position is closed automatically when either the Stop Loss or Take Profit level is reached.
5. **Visualization**:
- The 24-period EMA is plotted on the chart as a blue line, helping visualize the trend direction.
### Key Features:
- **Pair and Time Frame**: The strategy is optimized for the SUSDT pair on a 10-minute time frame.
- **Customizable Parameters**: Users can adjust the Stop Loss and Take Profit percentages to suit their risk tolerance and trading style.
- **Trend-Following Approach**: The strategy uses the EMA to identify and follow the current market trend.
This strategy is simple yet effective for capturing trends while managing risk through predefined Stop Loss and Take Profit levels.

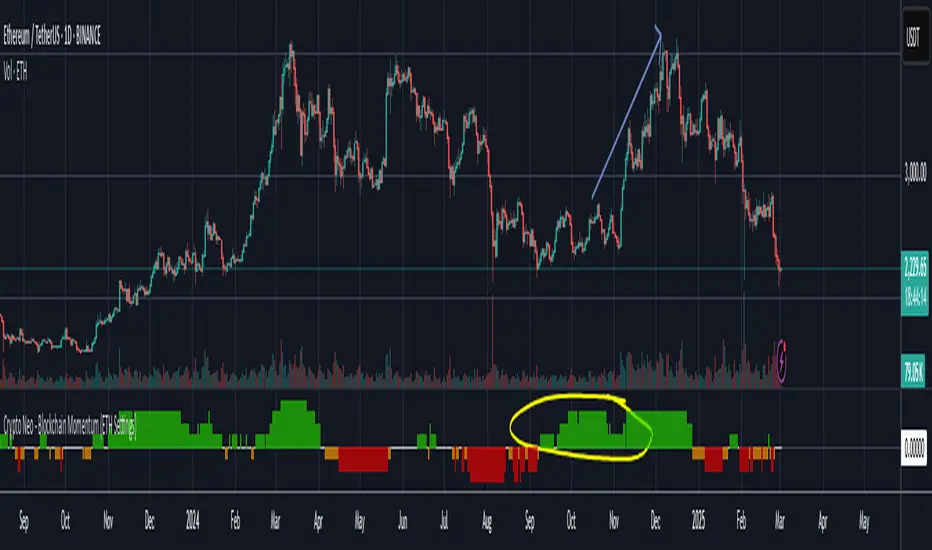
Crypto Neo - Blockchain Momentum (ETH Settings)The Crypto Neo - Blockchain Momentum indicator analyzes Ethereum’s on-chain activity to gauge bullish or bearish trends. It combines multiple on-chain metrics and applies different moving average strategies to assess Ethereum’s momentum.
This indicator is designed to track key blockchain data sources, such as:
Hash Rate
Active Addresses
Transactions per Second
Transfers per Second
Trader Behavior
Long-Term Holders (Cruisers)
Money Flow In/Out
Total Value Locked
It processes these inputs using various Moving Average (MA) types, including SMA, EMA, DMA, to generate a Bullish Momentum Score, which is visually displayed on the chart.
How to Use:
Select MA Type – Choose between SMA, EMA, MIXMA, or DMA to determine how moving averages are applied.
Set MA Lengths – Adjust MA1 Length and MA2 Length to define short-term vs. long-term trend comparison.
Customize Data Sources – Select different on-chain metrics for the indicator to analyze.
Interpret the Bullish Momentum Score:
🟢 Green (Strong Bullish Momentum) – Bullish on-chain signals dominate.
🟡 Yellow (Moderate Bullish Momentum) – Weak bullish trend forming.
⚪ White (Neutral) – No clear trend.
🟠 Orange (Moderate Bearish Momentum) – Weak bearish signals emerging.
🔴 Red (Strong Bearish Momentum) – Bearish on-chain signals dominate.
Important Notes
* This indicator does not generate trading signals but helps interpret blockchain trends for informed decision-making.
* Since it relies on daily on-chain data, it is best used on the 1D timeframe for accurate readings.
* Real-time calculations may vary slightly due to different bar update behaviors.
This indicator is very useful to confirm market turns early. Here are a few an example setups:
1. Back in 2022 on chain metrics started trending down after the market was consolidating at the top. On chain data predicted momentum moving to the downside.
2. Around October 2024, on-chain metrics showed bullish momentum while ETH was consolidating. It led to a rally in November.
Crypto Fear and GreedThe Crypto Fear and Greed indicator is a custom Pine Script (version 6) indicator designed to measure market sentiment in the cryptocurrency market. It combines three main components: volatility, momentum, and volume, to create a composite score ranging from 0 to 100.
Interpretation
- 0-20: Extreme Fear** - The market is in a state of panic, potentially indicating a buying opportunity for contrarian investors.
- 20-40 : Fear** - Investors are cautious, but not panicking.
- 40-60: Neutral** - The market sentiment is balanced.
- 60-80: Greed** - Investors are becoming optimistic, potentially indicating overbought conditions.
- 80-100: Extreme Greed** - The market is euphoric, potentially indicating a selling opportunity for contrarian investors.
Limitations
1. The indicator uses the TOTAL3 cryptocurrency market cap data, which may not perfectly represent individual cryptocurrency movements.
2. Historical data limitations may affect the accuracy of the volume component, especially when first applying the indicator to a chart.
3. The indicator is based on technical factors and does not account for fundamental or external market influences.

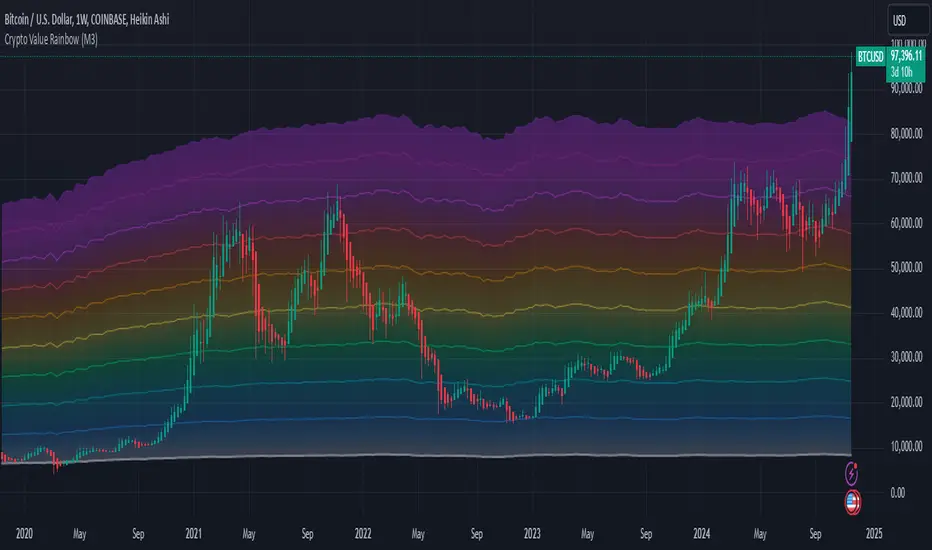
Crypto Value RainbowThe best way to value Crypto value is comparing Crypto price against the available money supply circulating in the economy. There are 3 different 4 different type of money supply M0/M1/M2/M3 which denotes the level of money printed by central government to the final credit lend out to the economy via fractional banking system. This rainbow valuation measures the relative Crypto price against the M0/M1/M2/M3 from most popular currency that account for more than 75% of money supply in the world.
CV = US MS + EU MS + CN MS + JP MS + UK MS
CV = Crypto Value
MS = Money Supply
This can only be applied to a few crypto currency:
- BTCUSD Bitcoin
- ETHUSD Ehereum
- BNBUSD BNB
- SOLUSD Solana
- XRPUSD XRP
- TONUSD Toncoin
- DOGEUSD Dogecoin
- TRXUSD Tron
- ADAUSD Cardano
- AVAXUSD Avalanche
The rainbow color is the multiplier for the total Crypto Value by 1x,2x,3x,...,10x
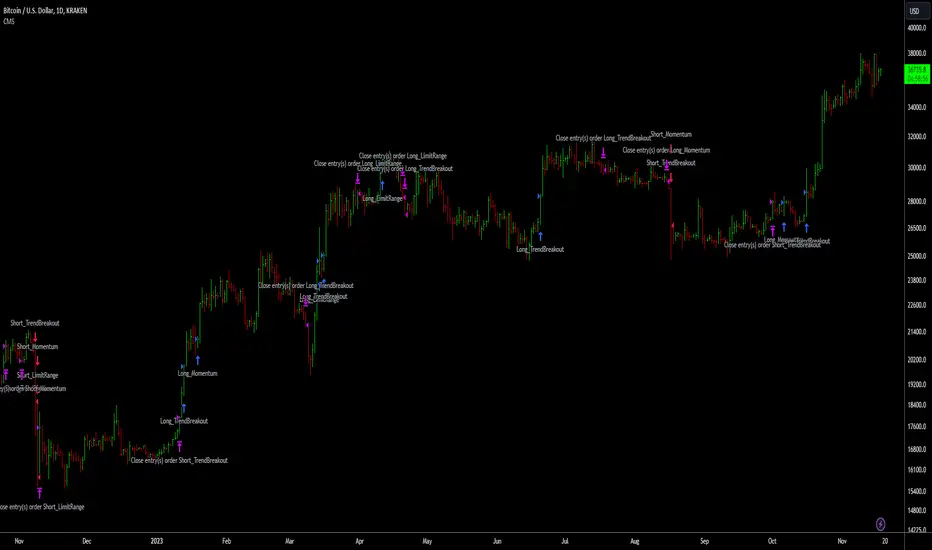
Crypto Market Strategy (CMS)/Introduction
The Crypto Market Strategy (CMS) is a composite strategy for the cryptocurrency market. It integrates multiple strategies (called signals) to ensure you are exploiting multiple patterns/anomalies in the market.
/Signals
The three distinct strategies, each providing signals based on specific market conditions are explained below:
1. Limit Range: This signal targets stable market periods, triggering signals based on micro breakouts in price. The market during this period is described as stable because of the short lookback period required for breakout, four bars is the default.
2. Trend Breakout: This signal seeks to capitalize on significant market movements following consolidation periods, it triggers when large price breakouts occur. The market during this period is described as volatile because of the long lookback period required for breakout, forty bars is the default.
3. Momentum: After breakouts, price uptrends may persist for a long time, typically weeks to months. This signal captures long term trends.
An upward blue arrow signifies a long entry signal, a downward red arrow indicates a short entry signal, while an upward/downward pink arrow indicates an exit signal. All signals will have a label indicating the triggering strategy and number of units (this can be disabled in the style settings).
/Construction
The strategy is constructed using minimal indicators, it is basically price action and moving averages.
/Settings
The settings are organised according to the signals;
1. Limit range
Entry - This is the size of breakout
+Exit - Closes the trade in profit
-Exit - Closes the trade to minimise loss
2. Trend breakout
Entry - This is the size of the breakout
Exit - Closes the trade to minimise loss
3. Momentum
Entry - This determines how quickly a signal is triggered
Lookback - This is the duration considered for the entry
/Results
The backtest results are based on a starting capital of $13,700 (convenient amount for retail traders) with 5% of equity for the position size and pyramiding of 3 consecutive positions because there are three signals. Commissions vary from broker to broker with some charging zero commissions, so commissions is set to an exorbitant $3 per order to ensure profitability in backtests is reproducible in live trading. Slippage of 3 ticks is used to ensure the results are representative of real world, market order, end-of-day trading. The backtest results are available to view at the bottom of this page.
Note:
Past performance in backtesting does not guarantee future results. Cryptocurrency markets are particularly volatile, and individual execution and market changes can significantly affect strategy performance. Price data may also vary across exchanges.
/Tickers
CMS has been backtested primarily on BTCUSD. It also performs well on ETHUSD.
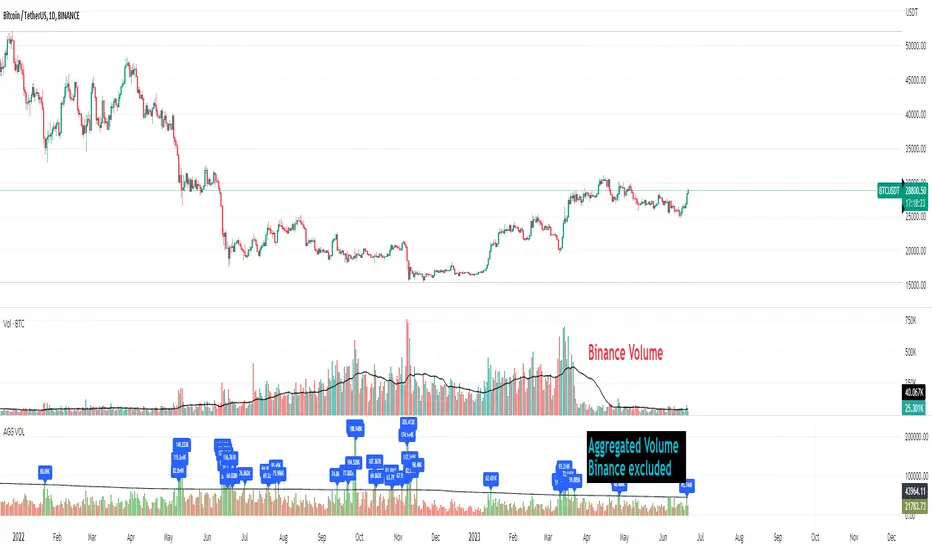
Crypto Aggregated Volume «NoaTrader»If you use volume in your crypto analysis, you may have encountered the situation which an exchange's policy change can affect your judgement falsely. For example, you can see the huge difference of volume on the given chart since binance transferred its fee discount from USDT to TUSD pair.
This script sums up volume of all major centralized exchanges ( according to coinmarketcap ) on the symbol you are visiting and has an option to exclude Binance's volume which can give you a more stable understanding for judgement when needed (and you can see the difference on the chart).
The colors also give a good vision about the relative volume in the area which can show the interest of market in trading.
The script only aggregates the same symbol on different exchanges and does not get the volume from other pairs.
Included CEXs are:
binance
bitstamp
coinbase
huobi
kraken
bitfinex
bybit
okx
kucoin
bithumb