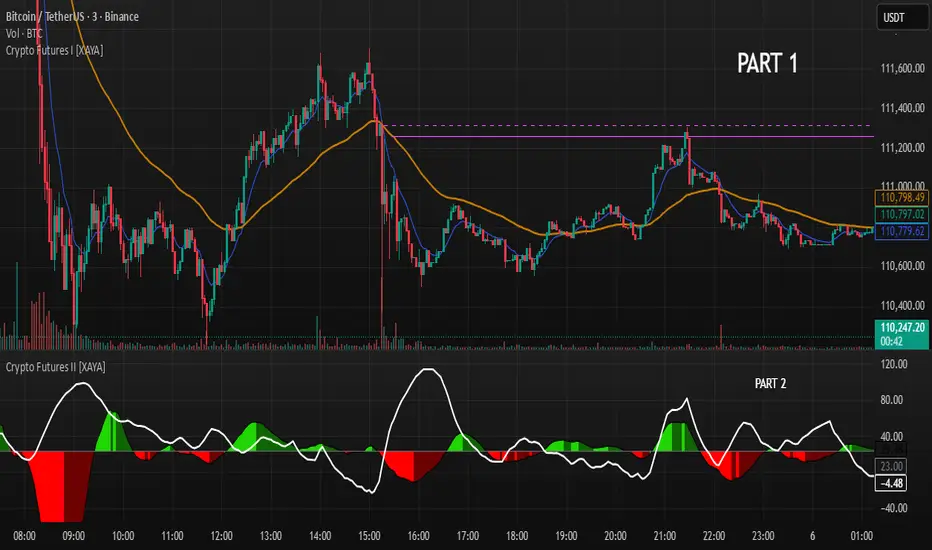
Crypto Futures I [XAYA]Crypto Futures Indicator, by XAYA.
PART 1.
Crypto Futures Indicator it's a full build-in strategy used to trade top 200 Crypto Tokens in any Time Frame from 1H to 1D.
The full strategy uses 5 separated indicators:
- Price Action
- 2 EMAS, 10 and 55
- Volume
- Squeeze Momentum
- ADX
PART 1 of Crypto Futures Indicator plots 2 EMAs (10 and 55) and an horizontal line at the cross of them, to use as areas of future interest. This cross lines that are named "Chris Cross" in honor to my mentor, come in 2 variations:
- Dashed line indicates a cross of EMAS in the present Time Frame.
- Solid line indicates a cross of EMAs in the Higher Time Frame above the present TF.
"Chris Cross" lines are hidden by default since are not needed to execute strategy, but they are good areas or Support and Resistence that can be use in confluence with the rest of the strategy as Buy or Sell points.
XAYA 2025
Cerca negli script per "crypto"

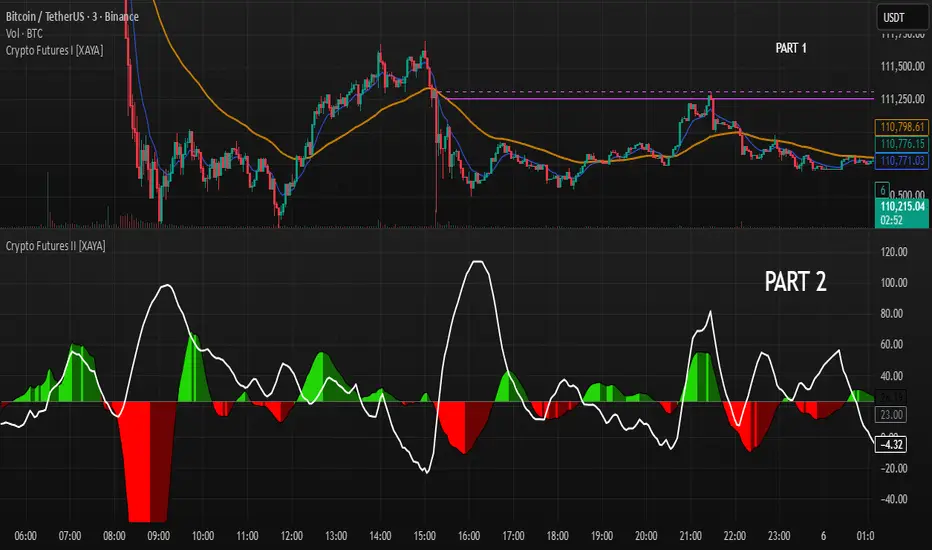
Crypto Futures II [XAYA]Crypto Futures Indicator, by XAYA.
PART 2.
Crypto Futures Indicator it's a full build-in strategy used to trade top 200 Crypto Tokens from, in any Time Frame from 1H to 1D. The full strategy uses 5 separated indicators:
- Price Action
- 2 EMAS, 10 and 55
- Volume
- Squeeze Momentum
- ADX
PART 2 of Crypto Futures Indicator plots the Squeeze Momentum Indicator in conyunction with ADX+ Levels, to find better entry points based on TIME (squeeze momentum) and STRENGHT (ADX). Used in confluence with Crypto Futures Indicator PART 1, can unleash the reading for a full strategy based on the 5 indicators previously mentioned.
XAYA 2025
Crypto Futures I [XAYA]Crypto Futures Indicator, by XAYA.
PART 1.
Crypto Futures Indicator it's a full build-in strategy used to trade top 200 Crypto Tokens from, in any Time Frame from 1H to 1D. The full strategy uses 5 separated indicators:
- Price Action
- 2 EMAS, 10 and 55
- Volume
- Squeeze Momentum
- ADX
PART 1 of Crypto Futures Indicator plots 2 EMAs (10 and 55) and an horizontal line at the cross of them, to use as areas of future interest. This cross lines that are named "Chris Cross" in honor to my mentor, come in 2 variations:
- Dashed line indicates a cross of EMAS in the present Time Frame.
- Solid line indicates a cross of EMAs in the Higher Time Frame above the present TF.
"Chris Cross" lines are hidden by default since are not needed to execute strategy, but they are good areas or Support and Resistence that can be use in confluence with the rest of the strategy as Buy or Sell points.
XAYA 2025


Crypto Smart ScalperCrypto Smart Scalper V 1.0
Indicator designed to assist in trend identification utilising Open/Close Price for up and down moves.
This is NOT a trading system and should be used with supporting information and data. It is not identifying or is meant to represent a standalone trading system.
Open/Closed Price identified for potential trend direction once swings are complete.
If you would like to enquire about access to this invite only script please send me a private message on trading view and I will be happy to assist. Thank you.
Crypto Multi Exchange Volume (CMEV)Crypto Multi Exchange Volume (CMEV) aggregates and plots trading volumes for supported cryptoasset pairs over multiple different cryptoasset exchanges. For developers looking for more information and for those who want to compile their own version of CMEV, please check out my GitHub (jakobpredin/crypto-multi-exchange-volume).
Configuration
CMEV comes with two configurable settings - whether base volume or quote volume is plotted and the length of the volume's EMA. By default, the base volume is used for plotting and the length of the EMA is set to 12 periods.
Use cases
The indicator was primarily developed in order to be able to chart using the trading pair with the longest available trading history. Due to the fast-changing preferences of where cryptoassets are traded, volumes tend to be very inconsistent and can give a distorted picture of a pairs history. For illustration, check out the SC-BTC pair from Poloniex using their native volume and compare it to the CMEV volume.
The other use case is to be able to spot divergences in volume. A great example here is bitcoin's 2019 rally where volumes from derivatives exchanges are at all time highs but volumes from retail/spot exchanges are not.
Supported exchanges
CMEV currently supports asset pairs from the following exchanges:
Binance
Bitfinex
Bitstamp
Bittrex
Coinbase
Gemini
Kraken
Poloniex
Limitations
Because of the fact that CMEV is pulling data from from multiple different exchanges and is computationally intensive it can take a couple of seconds to load while charting certain cryptoasset pairs.
Additionally, due to Tradingview's various limitations only a certain number of pairs can be supported at a time. By default, only pairs with a BTC or USD quote are supported and many non-unique pairs with consistently low trading volumes have been removed. For a full explanation, please refer to the docs in my GitHub (jakobpredin/crypto-multi-exchange-volume).
Future of the project
I plan on supporting pairs from more exchanges in the future as I see fit and as they become available for charting on Tradingview. Further, I may develop a strategy script using CMEV as its core indicator.
I welcome everybody from the community to help me extend the functionality of CMEV in order to make investing in cryptoassets more transparent for everybody.

Crypto Investidor EMA e MA Crypto Investidor EMA e MA consiste em um conjunto de 4 EMAs de 21 / 50 / 100 / 200 períodos e também 4 MAs de 21 / 50 / 100 / 200, criado para facilitar o entendimento dos nossos seguidores, a ponto de poder verificar no gráfico tanto as Medias Móveis Exponenciais, quanto as Medias Móveis Simples. Um excelente indicador para quem utiliza o tradingview free.

Crypto Bull Detector (CBD)Crypto Bull Detector (CBD) is my very own customized crypto screener which attempts to finds bullish coins. This is an implementation of my previous BTI (Bull Trend Indicator).
Right now I have placed 6 coins on it so it is watching those 6 coins. It can watch more coins, hundreds if you like, they just need to be added in the future. It uses the prices of these various coins for the calculations to determine the likelihood of the coin pumping. Once any of those coins get detected as bullish, it will pop-up and plot on the bottom chart. No need to watch hundreds of coins, it can all be added in here in one indicator.
With this CBD indicator you will be able to buy the right coin at the right time to maximize your profits since it is likely to be on bullish trend.
Message me for trial access (via email preferred).

Crypto OI AgregatedCrypto OI Aggregated — Open Interest Aggregator for Crypto Exchanges
General Description
The indicator is designed for comprehensive analysis of Open Interest (OI) across major cryptocurrency exchanges. It consolidates data from multiple platforms, visualizes it as candlestick charts or deltas, and builds tables with breakdowns by exchange and contract type. This allows traders to quickly understand where market interest is concentrated and how the market structure is shifting.
Unlike standard tools that only show data from a single exchange, this indicator provides a full market overview and makes it easy to compare dynamics across different platforms.
⸻
Key Features
• Aggregation of OI data from exchanges: Binance, Bybit, OKX, Bitget, Kraken, HTX, Deribit (feel free to leave a comment if you’d like me to add other exchanges that provide open interest data)
• Support for contract types: USDT.P, USD.P, USDC.P, USD.PM
• Automatic normalization of various OI data formats from different providers
• Display modes:
• OI candlestick chart (total aggregated OI)
• OI Delta (change in OI per bar)
• Full table with detailed data by exchange and contract type
• Short summary table with totals in USD and base assets
• Support for USD or COIN denomination
• Convenient formatting for large numbers
• Customizable colors
⸻
How to Use the Indicator
1. Select Exchanges
In the settings, enable or disable specific exchanges. It is recommended to activate only the ones you need for analysis — this will make the indicator faster.
2. Choose Data Type
• OI — aggregated open interest from selected exchanges.
• OI delta — delta (change in OI compared to the previous bar).
3. Denomination
• USD — values are converted into USD equivalents.
• COIN — values are shown in the base asset (BTC, ETH, etc.).
4. Reading the Chart
• OI candlesticks show the overall OI dynamics.
• Delta histogram highlights how much OI has grown or decreased per bar.
• Colors are fully customizable.
5. Tables
• Enabled via the Show table option.
• Full Table → Rows = exchanges, Columns = contract types. Cells contain OI values in either USD or the base asset, depending on settings. Quickly shows where the main interest is concentrated.
• Short Table → Displays only the total OI values in USD and the base asset.
⸻
Important Notes
• For better readability of large values, two custom formatting functions were implemented. They work similarly to format.volume, but with improved digit grouping and adjustable decimal precision. In the tables, the top row is formatted using format.volume, while the bottom row uses the improved formatting functions for clearer representation.
str(d, n, s) =>
str.substring(d, 0, str.length(d) - n) + '.' + str.substring(d, str.length(d) - n, str.length(d) - (n - 2)) + s
format(_r) =>
d = str.tostring(math.round(_r))
str.length(d) > 9 ? str(d, 9, " B") : str.length(d) > 6 ? str(d, 6, " M") : str.length(d) > 3 ? str(d, 3, " K") : d
⸻
Conclusion: Crypto OI Aggregated is a convenient and powerful tool for cryptocurrency derivatives traders. It enables tracking of OI dynamics across multiple exchanges simultaneously, detecting imbalances between contracts, and identifying signals that are not visible when analyzing a single exchange.

ALERT OF CRYPTOOOFOX (Scalping System)---DESCRIPTION---
How Indicator Work :
--This Indicator is for scalping and also using confirmation when higher > highest time frame .
--The main indicator in this strategy is built on movement high and low so this indicator is belong to
the chart price and movement and you can make profit in any chart as you want
--Indicator is working on higher time frame so i use two high time frames .
the higher is ( 8 H ) and the highest is ( Daily ) Time frame .
-- When the higher time frame cross over the Daily time frame( the Highest ) this mean
the TREND and the PRICE also going UP this strategy is going to start working between the high and low buy in low .
-- When the higher time frame cross under Daily time frame( the Highest ) this mean the TREND and
the PRICE also going down and it will sell in high ( close position ) .
--Indicator is working only in Long position i am not recommend to use it in short positions .
--THIS IS NO REPAINT INDICATOR.
--I recommend so mush to use 5 min time frame for low draw down
--I recommend so mush to use take profit and stop loss although the low draw down but some time
the market have a huge movements .
--This Indicator have setting of movement for every chart and every price and movement so i will
comment the settings for every chart in forex and crypto and also stock markets

SMA X RSI - by @CryptoMrDavis -Another script that might be useful for your trading setup.
It use RSI and two SMA's.
Happy trading
+++ use this tool on your own risk. i'm not responsible for your loses +++
Show some ❤
____________________________________________________________________________
BTC: 1GVRDK3HHr9CKM5SF2CGpCNXFuavB3L4j9
ETH: 0x7b825fa752b9926D3E8397cDb1d9E5473D074646
XMR: 41zL2SQS7zyZmwXKng2TeUWsMi5vMmkgSdDCjULUTvM6ichwm1E2ZDEYGt56zk9ghoM9bekhjycSwa8amtTcB2JiUet5jtg
NEO: AXja5xPDhczfm2ujHyBfpkQAAnMsXsazmb
ZEC: zcZzFkRx95cp7MtuW8wLhC5zz5RYF9QkT2uPPmhZZHc6ppXepHGgCSeAS1rtD6WFdqsM5p1gZm2gfirnrnviucsdP4aCpqU
XLM: GAXUQJSW55C7MAC4GI26NZUGIKSHFDVFRFKZCXPLMPY4HCADSDT55XK6
WAVES: 3PCMkNpMHxSraTCkwV1ENcBKa9sXbVCGjQX
BCH: qz57n04ud6mn42u00aymqkku8tfh0lk4jv9c28mjvv
____________________________________________________________________________
++++ cryptotradingresource.com ++++
____________________________________________________________________________

Helios - by @cryptomrdavis -
Helios is a simple to use oscillator.
It represent the state of different indicators at the moment. If you see a small green column, that means that only one or few indicators are getting into the positiv area, wait for higher bars to get into a trade. Same thing on the red bars side.
Calculation is based on few indicators like RSI , MACD , EMA , SMA and some more.
Happy trading
+++ use this tool on your own risk. i'm not responsible for your loses +++
Show some ❤
____________________________________________________________________________
BTC: 1GVRDK3HHr9CKM5SF2CGpCNXFuavB3L4j9
ETH: 0x7b825fa752b9926D3E8397cDb1d9E5473D074646
XMR: 41zL2SQS7zyZmwXKng2TeUWsMi5vMmkgSdDCjULUTvM6ichwm1E2ZDEYGt56zk9ghoM9bekhjycSwa8amtTcB2JiUet5jtg
NEO: AXja5xPDhczfm2ujHyBfpkQAAnMsXsazmb
ZEC: zcZzFkRx95cp7MtuW8wLhC5zz5RYF9QkT2uPPmhZZHc6ppXepHGgCSeAS1rtD6WFdqsM5p1gZm2gfirnrnviucsdP4aCpqU
XLM: GAXUQJSW55C7MAC4GI26NZUGIKSHFDVFRFKZCXPLMPY4HCADSDT55XK6
WAVES: 3PCMkNpMHxSraTCkwV1ENcBKa9sXbVCGjQX
BCH: qz57n04ud6mn42u00aymqkku8tfh0lk4jv9c28mjvv
____________________________________________________________________________
++++ cryptotradingresource.com ++++
____________________________________________________________________________

BTC Dominance - by @cryptomrdavis -Simple tool for your trading assets. Check the dominance from BTC agains other Alts and trade safe.
You can find a short description on the chart above.
Website coming soon: cryptotradingresource.com
Happy trading
+++ use this tool on your own risk. i'm not responsible for your loses. DYOR +++
____________________________________________________________________________
BTC: 1GVRDK3HHr9CKM5SF2CGpCNXFuavB3L4j9
ETH: 0x7b825fa752b9926D3E8397cDb1d9E5473D074646
XLM: GAXUQJSW55C7MAC4GI26NZUGIKSHFDVFRFKZCXPLMPY4HCADSDT55XK6
BCH: qz57n04ud6mn42u00aymqkku8tfh0lk4jv9c28mjvv
[STRATEGY] MA Strategy Intraday - @CryptoNTezSimple & profitable Moving average Strategy.
Parameters are customizable.
Happy trading!

NICE X v1 - Buy/Sell & TP Signals *FREE V.* -- by @cryptomrdavisThis is my tool for you guys,
still in development and not 100% guarantee that every signal bringst you 20%-50% profit, but it helps to make some gains and to safe from a bigger price drop.
You get "Buy" and "Sell" signals, and you can manually set up to 3 take profit points. There is some issue i need to fix, but for now it works pretty well. I recommend to use on trading pairs with good volume and on higher timeframes, signals get weak if there is low volume .
If anyone has some ideas how to reduce these noise, get at me so i can improve this tool.
Happy trading!
Buy / Sell signals
Take Profit Signals (default values 5%,10% & 15%
Set Alerts on Buy/Sell signals
*** use this tool on your own risk ***
--------------------------------------------------------------------------------------------------------
If my tool helped you out, get at me
BTC: 1GVRDK3HHr9CKM5SF2CGpCNXFuavB3L4j9
ETH: 0x7b825fa752b9926D3E8397cDb1d9E5473D074646
XLM GAXUQJSW55C7MAC4GI26NZUGIKSHFDVFRFKZCXPLMPY4HCADSDT55XK6
BCH: qz57n04ud6mn42u00aymqkku8tfh0lk4jv9c28mjvv
--------------------------------------------------------------------------------------------------------

Crypto Market Cap Momentum Analyzer (AiBitcoinTrend)The Crypto Market Cap Momentum Analyzer (AiBitcoinTrend) is a robust tool designed to uncover trading opportunities by blending market cap analysis and momentum dynamics. Inspired by research-backed quantitative strategies, this indicator helps traders identify trend-following and mean-reversion setups in the cryptocurrency market by evaluating recent performance and market cap size.
This indicator classifies cryptocurrencies into market cap quintiles and ranks them based on their 2-week momentum. It then suggests potential trades—whether to go long, anticipate reversals, or simply hold—based on the crypto's market cap group and momentum trends.
👽 How the Indicator Works
👾 Market Cap Classification
The indicator categorizes cryptocurrencies into one of five market cap groups based on user-defined inputs:
Large Cap: Highest market cap tier
Upper Mid Cap: Second highest group
Mid Cap: Middle-tier market caps
Lower Mid Cap: Slightly below the mid-tier
Small Cap: Lowest market cap tier
This classification dynamically adjusts based on the provided market cap data, ensuring that you’re always working with a representative market structure.
👾 Momentum Calculation
By default, the indicator uses a 2-week momentum measure (e.g., a 14-day lookback when set to daily). It compares a cryptocurrency’s current price to its price 14 bars ago, thereby quantifying its short-term performance. Users can adjust the momentum period and rebalance period to capture shorter or longer-term trends depending on their trading style.
👾 Dynamic Ranking and Trade Suggestions
After assigning cryptos to size quintiles, the indicator sorts them by their momentum within each quintile. This two-step process results in:
Long Trade: For smaller market cap groups (Small, Lower Mid, Mid Cap) that have low (bottom-quintile) momentum, anticipating a trend continuation or breakout.
Reversal Trade: For the largest market cap group (Large Cap) that shows low momentum, expecting a mean-reversion back to equilibrium.
Hold: In scenarios where the coin’s momentum doesn’t present a strong contrarian or trend-following signal.
👽 Applications
👾 Trend-Following in Smaller Caps: Identify small or mid-cap cryptos with low momentum that might be poised for a breakout or sustained trend.
👾 Mean-Reversion in Large Caps: Pinpoint large-cap cryptocurrencies experiencing a temporary lull in performance, potentially ripe for a rebound.
👽 Why It Works in Crypto
The cryptocurrency market is heavily driven by retail investor sentiment and volatility. Research shows that:
Small-Cap Cryptos: Tend to experience higher volatility and speculative trends, making them ideal for momentum trades.
Large-Cap Cryptos: Exhibit more predictable behavior, making them suitable for mean-reversion strategies when momentum is low.
This indicator captures these dynamics to give traders a strategic edge in identifying both momentum and reversal opportunities.
👽 Indicator Settings
👾 Rebalance Period: The frequency at which momentum and trade suggestions are recalculated (Daily, Weekly, Monthly).
Shorter Periods (Daily): Fast updates, suitable for short-term trades, but more noise.
Longer Periods (Weekly/Monthly): Smoother signals, ideal for swing trading and more stable trends.
👾 Momentum Period: The lookback period for momentum calculation (default is 14 bars).
Shorter Periods: More responsive but prone to noise.
Longer Periods : Reflects broader trends, reducing sensitivity to short-term fluctuations.
Disclaimer: This information is for entertainment purposes only and does not constitute financial advice. Please consult with a qualified financial advisor before making any investment decisions.

Crypto Market Caps (BTC, ETH, TOTAL3)RSI based Crypto Market Caps (BTC, ETH, TOTAL3) Oscillator
This oscillator displays market caps for:
BTC : CRYPTOCAP:BTC -> in orange
ETH : CRYPTOCAP:ETH -> in gray
ALT (Total crypto excl. BTC & ETH): CRYPTOCAP:TOTAL3 -> in blue
In the settings you can edit:
The 3 market cap symbols
RSI length
All colours ;-)
Hope you enjoy!
Crypto Top 25 Equal Weight IndexDraws an Equally Weighted Index of 25 securities. The inputs are pre-populated with the Top 25 cryptocurrencies by market cap at the time of publishing the script, but any 25 securities can be used.
Double click on this indicator's pane to view in full screen.
Note: Candle open is always equal to previous candle's close. I did this to avoid problems where sometimes candle open didn't make sense compared to close.
If you're into cryptocurrencies also have a look at these TradingView charts CRYPTOCAP:TOTAL, CRYPTOCAP:TOTAL2 and CRYPTOCAP:OTHERS.
Cryptocurrency SentimentOverview
This script focuses on calculating and visualizing the sentiment difference between LONG positions and SHORT positions for a selected cryptocurrency pair on the Bitfinex exchange. It provides a clean and clear visual representation of the sentiment, helping traders analyze market behavior.
Key Features
Dynamic Symbol Selection:
The script automatically detects the cryptocurrency symbol from the chart (syminfo.basecurrency) and dynamically constructs the LONGS and SHORTS ticker symbols.
Works seamlessly for pairs like BTCUSD, ETHUSD, and others available on Bitfinex.
Sentiment Calculation:
The sentiment difference is calculated as:
Sentiment Difference=−1×(100− SHORTS/LONGS ×100)
LONGS : The total number of long positions.
SHORTS : The total number of short positions.
If SHORTS is 0, the value is safely skipped to avoid division errors.
Color Coding:
The script visually highlights the sentiment difference:
Green Line: Indicates that LONG positions are dominant (bullish sentiment).
Red Line: Indicates that SHORT positions are dominant (bearish sentiment).
Zero Reference Line:
A gray horizontal line at 0 helps users quickly identify the transition between bullish (above zero) and bearish (below zero) sentiment.
How It Works
Fetching Data:
The script uses request.security to fetch LONGS and SHORTS data at the current chart timeframe (timeframe.period) for the dynamically generated Bitfinex tickers.
Handling Data:
Missing or invalid data (NaN) is filtered out to prevent errors.
Extreme spikes or irregular values are safely avoided.
Visualization:
The sentiment difference is plotted with dynamic color coding:
Green when LONGS > SHORTS (bullish sentiment).
Red when SHORTS > LONGS (bearish sentiment).
Benefits
Market Sentiment Insight: Helps traders quickly identify if the market is leaning towards bullish or bearish sentiment based on actual LONG and SHORT position data.
Dynamic and Adaptive: Automatically adjusts to the selected cryptocurrency symbol on the chart.
Clean Visualization: Focuses solely on sentiment difference with color-coded signals, making it easy to interpret.
Best Use Cases
Trend Confirmation: Use the sentiment difference to confirm trends during bullish or bearish moves.
Market Reversals: Identify potential reversals when sentiment shifts from positive (green) to negative (red) or vice versa.
Sentiment Monitoring: Monitor the overall market bias for cryptocurrencies like BTC, ETH, XRP, etc., in real-time.
Sample Chart Output
Above Zero → Green Line: Bullish sentiment dominates.
Below Zero → Red Line: Bearish sentiment dominates.
Zero Line → Transition point for shifts in sentiment.

Crypto Liquidation Heatmap [LuxAlgo]The Crypto Liquidation Heatmap tool offers real-time insights into the liquidations of the top cryptocurrencies by market capitalization, presenting the current state of the market in a visually accessible format. Assets are sorted in descending order, with those experiencing the highest liquidation values placed at the top of the heatmap.
Additional details, such as the breakdown of long and short liquidation values and the current price of each asset, can be accessed by hovering over individual boxes.
🔶 USAGE
The crypto liquidation heatmap tool provides real-time insights into liquidations across all timeframes for the top 29 cryptocurrencies by market capitalization. The assets are visually represented in descending order, prioritizing assets with the highest liquidation values at the top of the heatmap.
Different colors are used to indicate whether long or short liquidations are dominant for each asset. Green boxes indicate that long liquidations surpass short liquidations, while red boxes indicate the opposite, with short liquidations exceeding long liquidations.
Hovering over each box provides additional details, such as the current price of the asset, the breakdown of long and short liquidation values, and the duration for the calculated liquidation values.
🔶 DETAILS
🔹Crypto Liquidation
Crypto liquidation refers to the process of forcibly closing a trader's positions in the cryptocurrency market. It occurs when a trader's margin account can no longer support their open positions due to significant losses or a lack of sufficient margin to meet the maintenance requirements. Liquidations can be categorized as either a long liquidation or a short liquidation.
A long liquidation occurs when long positions are being liquidated, typically due to a sudden drop in the price of the asset being traded. Traders who were bullish on the asset and had opened long positions will face losses as the market moves against them.
On the other hand, a short liquidation occurs when short positions are being liquidated, often triggered by a sudden spike in the price of the asset. Traders who were bearish on the asset and had opened short positions will face losses as the market moves against them.
🔹Liquidation Data
It's worth noting that liquidation data is not readily available on TradingView. However, we recognize the close correlation between liquidation data, trading volumes, and asset price movements. Therefore, this script analyzes accessible data sources, extracts necessary information, and offers an educated estimation of liquidation data. It's important to emphasize that the presented data doesn't reflect precise quantitative values of liquidations. Traders and analysts should instead focus on observing changes over time and identifying correlations between liquidation data and price movements.
🔶 SETTINGS
🔹Cryptocurrency Asset List
It is highly recommended to select instruments from the same exchange with the same currency to maintain proportional integrity among the chosen assets, as different exchanges may have varying trading volumes.
Supported currencies include USD, USDT, USDC, USDP, and USDD. Remember to use the same currency when selecting assets.
List of Crypto Assets: The default options feature the top 29 cryptocurrencies by market capitalization, currently listed on the Binance Exchange. Please note that only crypto assets are supported; any other asset type will not be processed or displayed. To maximize the utility of this tool, it is crucial to heed the warning message displayed above.
🔹Liquidation Heatmap Settings
Position: Specifies the placement of the liquidation heatmap on the chart.
Size: Determines the size of the liquidation heatmap displayed on the chart.
🔶 RELATED SCRIPTS
Liquidations-Meter
Liquidation-Estimates
Liquidation-Levels

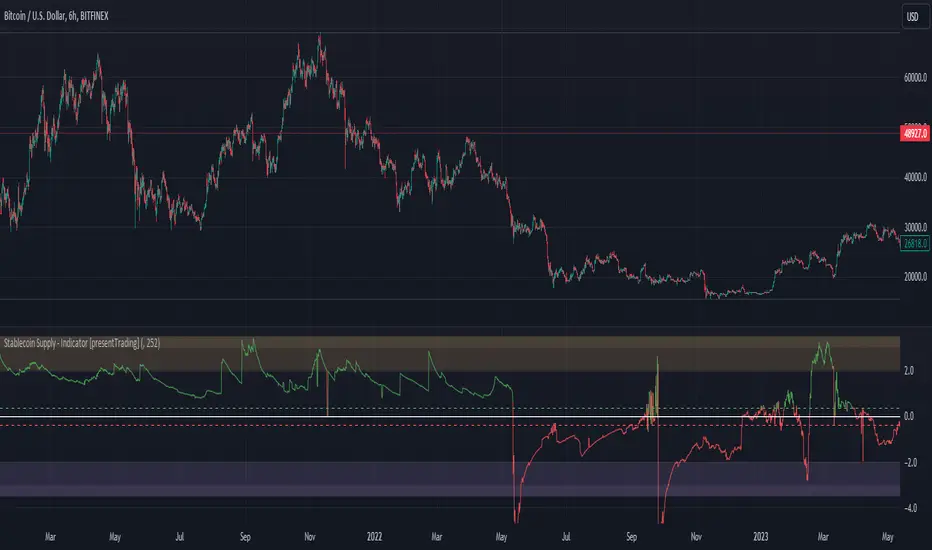
Crypto Stablecoin Supply - Indicator [presentTrading]█ Introduction and How it is Different
The "Stablecoin Supply - Indicator" differentiates itself by focusing on the aggregate supply of major stablecoins—USDT, USDC, and DAI—rather than traditional price-based metrics. Its premise is that fluctuations in the total supply of these stablecoins can serve as leading indicators for broader market movements, offering traders a unique vantage point to anticipate shifts in market sentiment.
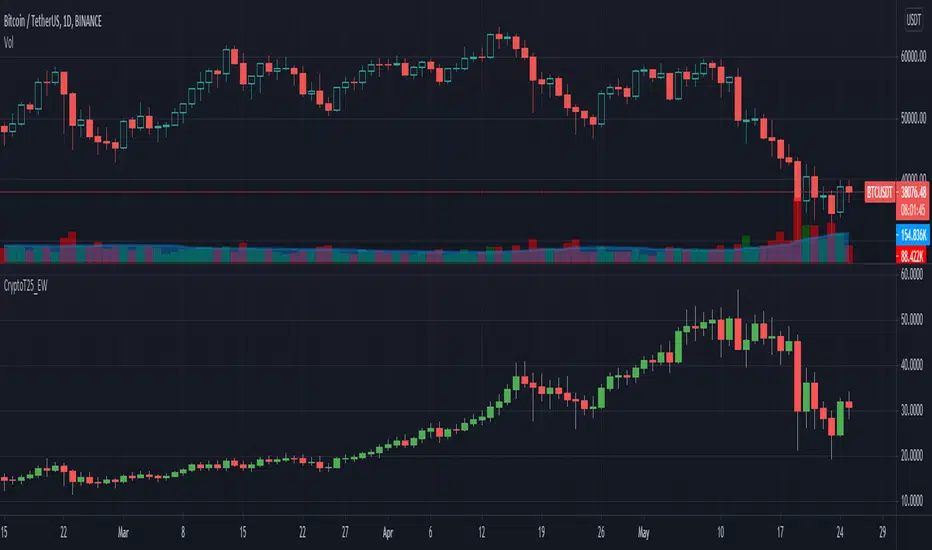
BTCUSD 6h for recent bull market
BTCUSD 8h
█ Strategy, How it Works: Detailed Explanation
🔶 Data Collection
The strategy begins with the collection of the closing supply for USDT, USDC, and DAI stablecoins. This data is fetched using a specified timeframe (**`tfInput`**), allowing for flexibility in analysis periods.
🔶 Supply Calculation
The individual supplies of USDT, USDC, and DAI are then aggregated to determine the total stablecoin supply within the market at any given time. This combined figure serves as the foundation for the subsequent statistical analysis.
🔶 Z-Score Computation
The heart of the indicator's strategy lies in the computation of the Z-Score, which is a statistical measure used to identify how far a data point is from the mean, relative to the standard deviation. The formula for the Z-Score is:
Z = (X - μ) / σ
Where:
- Z is the Z-Score
- X is the current total stablecoin supply (TotalStablecoinClose)
- μ (mu) is the mean of the total stablecoin supply over a specified length (len)
- σ (sigma) is the standard deviation of the total stablecoin supply over the same length
A moving average of the Z-Score (**`zScore_ma`**) is calculated over a short period (defaulted to 3) to smooth out the volatility and provide a clearer signal.
🔶 Signal Interpretation
The Z-Score itself is plotted, with its color indicating its relation to a defined threshold (0.382), serving as a direct visual cue for market sentiment. Zones are also highlighted to show when the Z-Score is within certain extreme ranges, suggesting overbought or oversold conditions.
Bull -> Bear
█ Trade Direction
- **Entry Threshold**: A Z-Score crossing above 0.382 suggests an increase in stablecoin supply relative to its historical average, potentially indicating bullish market sentiment or incoming capital flow into cryptocurrencies.
- **Exit Threshold**: Conversely, a Z-Score dropping below -0.382 may signal a reduction in stablecoin supply, hinting at bearish sentiment or capital withdrawal.
█ Usage
Traders can leverage the "Stablecoin Supply - Indicator" to gain insights into the underlying market dynamics that are not immediately apparent through price analysis alone. It is particularly useful for identifying potential shifts in market sentiment before they are reflected in price movements. By integrating this indicator with other technical analysis tools, traders can develop a more rounded and informed trading strategy.
█ Default Settings
- Timeframe Input (`tfInput`): Allows users to specify the timeframe for data collection, adding flexibility to the analysis.
- Z-Score Length (`len`): Set to 252 by default, representing the period over which the mean and standard deviation of the stablecoin supply are calculated.
- Color Coding: Uses distinct colors (green for bullish, red for bearish) to indicate the Z-Score's position relative to its thresholds, enhancing visual clarity.
- Extreme Range Fill: Highlights areas between defined high and low Z-Score thresholds with distinct colors to indicate potential overbought or oversold conditions.
By integrating considerations of stablecoin supply into the analytical framework, the "Stablecoin Supply - Indicator" offers a novel perspective on cryptocurrency market dynamics, enabling traders to make more nuanced and informed decisions.