Riley's CMOAre you familiar with Chande Momentum Oscillator? (CMO)
Riley's CMO is just an improvement over the old one.
It compares current close to previous median instead of close to close.
The result?
A smoother oscillator with less false signals.
Try comparing Riley's CMO to CMO.
You will notice the difference.
Cerca negli script per "oscillator"

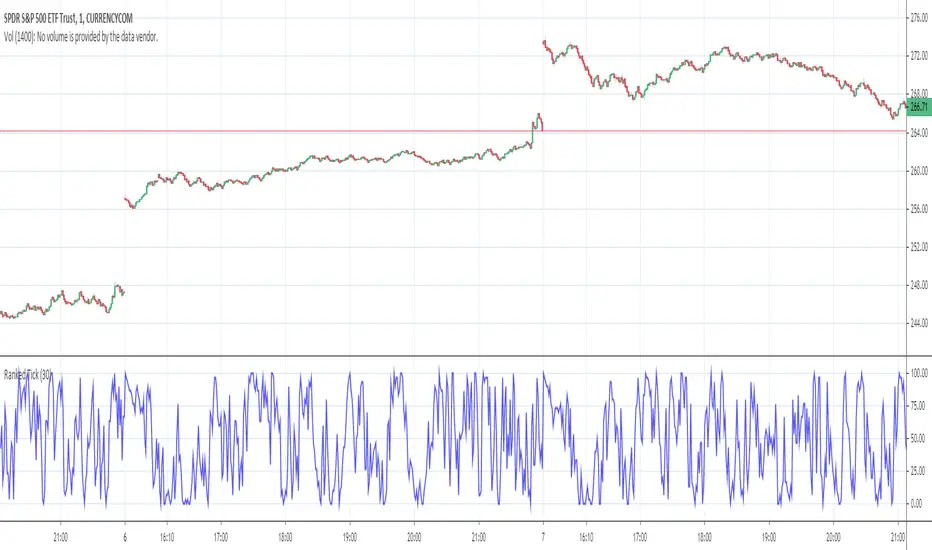
Ranked TickThe NYSE TICK is, very simply, the number of stocks ticking down or up at any given time. It is, therefore, an internal indication of buying and selling pressure. By itself, it can be difficult to interpret. This “Ranked Tick” makes the TICK an oscillator that varies from 0 to 100. This indicator can be of great help in determining when the market is overbought or oversold.
This oscillator is a percentile ranking of the high + low of the current bar of the TICK compared to the recent values of the same sum over a certain number of bars, which the user can set as an input, the “Rank Length”. This indicator can be of great help in determining when the market is overbought or oversold.
It was conceived by SergioT for TradeStation, and he was gracious enough to share his TradeStation script with all the traders at elliottwavetrader.net. I transcribed it into Pine Script so that everyone at TradingView could also have it.
HyperOscillatorThis indicator, HyperOscillator, is an enhanced oscillator designed to measure synthetic momentum by averaging percentage changes across multiple moving average periods. It provides a clear view of trend strength with a main line that turns green for bullish momentum and purple for bearish, alongside histograms for upper and lower bounds to spot crossovers. Exhaustion points are highlighted with circles for potential reversals, and you can enable divergence labels to detect regular or hidden mismatches between price and momentum. Volume weighting amplifies signals in high-activity bars, while multi-timeframe support brings in higher TF data for better context. The dashboard shows momentum strength as a 0-100% rank, risk level for overbought/oversold, and a flat data warning. Customize scales and styles to fit your chart, and pair it with HyperChannel for spotting exhaustion at channel edges. Not financial advice—experiment and see how it boosts your trading!

Katz Impact Wave 🚀Overview of the Katz Impact Wave 🚀
The Katz Impact Wave is a momentum oscillator designed to visualize the battle between buyers and sellers. Instead of combining bullish and bearish pressure into a single line, it separates them into two distinct "Impact Waves."
Its primary goal is to generate clear trade signals by identifying when one side gains control, but only when the market has enough volatility to be considered "moving." This built-in filter helps to avoid signals during flat or choppy market conditions.
Indicator Components: Lines & Plots
Impact Waves & Fill
Green Wave (Total Up Impulses): This line represents the cumulative buying pressure. When this line is rising, it indicates that bulls are getting stronger.
Red Wave (Total Down Impulses): This line represents the cumulative selling pressure. When this line is rising, it indicates that bears are getting stronger.
Colored Fill: The shaded area between the two waves provides an at-a-glance view of who is in control.
Lime Fill: Bulls are dominant (Green Wave is above the Red Wave).
Red Fill: Bears are dominant (Red Wave is above the Green Wave).
Background Color
The background color provides crucial context about the market state according to the indicator's logic.
Green Background: The market is in a bullish state (Green Wave is dominant) AND the Rate of Change (ROC) filter confirms the market is actively moving.
Red Background: The market is in a bearish state (Red Wave is dominant) AND the ROC filter confirms the market is actively moving.
Gray Background: The market is considered "not moving" or is in a low-volatility chop. Signals that occur when the background is gray should be viewed with extreme caution or ignored.
Symbols & Pivot Lines
▲ Blue Triangle (Up): This is your long entry signal. It appears on the bar where the Green Wave crosses above the Red Wave while the market is moving.
▼ Orange Triangle (Down): This is your short entry signal. It appears on the bar where the Red Wave crosses above the Green Wave while the market is moving.
Pivot Lines (Solid Green/Red/White Lines): These lines mark confirmed peaks of exhaustion in momentum, not price.
Green Pivot Line: Marks a peak in the Green Wave, signaling buying momentum exhaustion. This can be a warning that the uptrend is losing steam.
Red Pivot Line: Marks a peak in the Red Wave, signaling selling momentum exhaustion. This can be a warning that the downtrend is losing steam.
▼ Yellow Triangle (Compression): This rare signal appears when buying and selling exhaustion pivots happen at the same level. It signifies a point of extreme indecision or equilibrium that often occurs before a major price expansion.
Trading Rules & Strategy
This indicator provides entry signals but does not provide explicit Take Profit or Stop Loss levels. You must use your own risk management rules.
Long Trade Rules
Entry Signal: Wait for a blue ▲ triangle to appear at the top of the indicator panel.
Confirmation: Ensure the background color is green, confirming the market is in a bullish, moving state.
Action: Enter a long (buy) trade at the open of the next candle after the signal appears.
Short Trade Rules
Entry Signal: Wait for an orange ▼ triangle to appear at the bottom of the indicator panel.
Confirmation: Ensure the background color is red, confirming the market is in a bearish, moving state.
Action: Enter a short (sell) trade at the open of the next candle after the signal appears.
Take Profit (TP) & Stop Loss (SL) Ideas
You must develop and test your own exit strategy. Here are some common approaches:
Stop Loss:
Place a stop loss below the most recent significant swing low on the price chart for a long trade, or above the recent swing high for a short trade.
Use an ATR (Average True Range) based stop, such as 2x the ATR value below your entry for a long, to account for market volatility.
Take Profit:
Opposite Signal: The simplest exit is to close your trade when the opposite signal appears (e.g., close a long trade when a short signal ▼ appears).
Momentum Exhaustion: For a long trade, consider taking partial or full profit when a green Pivot Line appears, signaling that buying momentum is peaking.
Fixed Risk/Reward: Use a predetermined risk/reward ratio (e.g., 1:1.5 or 1:2).
Disclaimer
This indicator is a tool for analysis, not a financial advisor or a guaranteed profit system. All trading and investment activities involve substantial risk. You should not risk more than you are prepared to lose. Past performance is not an indication of future results. You are solely responsible for your own trading decisions, risk management, and for backtesting this or any other tool before using it in a live trading environment. This indicator is for educational purposes only.

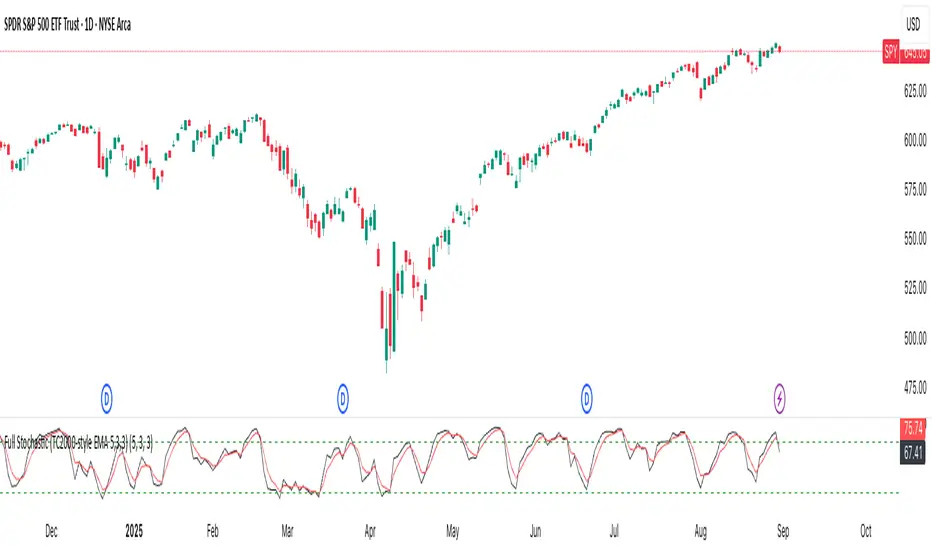
Full Stochastic (TC2000-style EMA 5,3,3)Full Stochastic (TC2000-style EMA 5,3,3) computes a Full Stochastic oscillator matching TC2000’s settings with Average Type = Exponential.
Raw %K is calculated over K=5, then smoothed by an EMA with Slowing=3 to form the Full %K, and %D is an EMA of Full %K with D=3.
Plots:
%K in black, %D in red, with 80/20 overbought/oversold levels in green.
This setup emphasizes momentum shifts while applying EMA smoothing at both stages to reduce noise and maintain responsiveness. Inputs are adjustable to suit different symbols and timeframes.
Gold 3min Trading Pro [XAU/USD]# Gold 3min Trading Pro - User Guide
## Overview
This is a professional scalping indicator specifically designed for Gold (XAU/USD) trading on 3-minute timeframes. It combines multiple technical analysis methods to provide high-probability entry signals for short-term trading.
## Key Features
### 1. Multi-Timeframe Trend Analysis
- **Major Trend**: Analyzes 15min, 1H, and 4H timeframes using moving averages
- **Short-term Trend**: Focuses on 3-minute price action and moving average alignment
- **Trend Strength**: Rated from 1-3 based on timeframe agreement
### 2. Core Indicators
- **RSI (9-period)**: Momentum oscillator for overbought/oversold conditions
- **Stochastic (9-period)**: %K and %D lines for entry timing
- **MACD**: Additional trend confirmation
- **Volume Analysis**: Detects volume spikes for signal validation
- **ATR-based Volatility Filter**: Ensures adequate market movement
### 3. Signal Types
- **Primary Signals**: Green triangles (LONG) and Red triangles (SHORT)
- **Enhanced Signals**: Stronger signals with multiple confirmations
- **Confirmation Signals**: Small circles for stochastic crossovers
## How to Use
### 1. Setup
- **Timeframe**: Use on 3-minute charts for Gold (XAU/USD)
- **Settings**: Default settings are optimized for Gold scalping
- **Session Filter**: Enable for London/New York sessions (recommended)
### 2. Entry Conditions
#### LONG Entry:
- Major trend is bullish (green background)
- Short-term trend is up or neutral
- RSI shows bullish momentum
- Stochastic indicates oversold recovery
- Volume spike confirmation
- Strong price action (bullish candle)
#### SHORT Entry:
- Major trend is bearish (red background)
- Short-term trend is down or neutral
- RSI shows bearish momentum
- Stochastic indicates overbought reversal
- Volume spike confirmation
- Strong price action (bearish candle)
### 3. Trade Management
- **Quick Target**: 50% of ATR-based calculation
- **Main Target**: Full ATR-based target
- **Stop Loss**: 60% of ATR below/above entry
- **Time Limit**: Exit if no progress within 20 bars (60 minutes)
### 4. Risk Management
- **Position Size**: Risk 1-2% of account per trade
- **Maximum Trades**: 3-5 trades per session
- **Avoid**: Low volatility periods and major news events
## Visual Elements
### Background Colors
- **Light Green**: Bullish major trend
- **Light Red**: Bearish major trend
- **Yellow**: Volume spike detected
- **Intense Colors**: Very strong trend alignment
### Chart Indicators
- **RSI Line (Blue)**: Main momentum indicator
- **Stochastic %K (Orange)**: Fast stochastic line
- **Stochastic %D (Yellow)**: Slow stochastic line
- **Horizontal Lines**: 70 (overbought), 30 (oversold), 50 (midline)
### Information Table (Top Right)
- Total signal count and performance statistics
- Current market conditions and trend strength
- RSI levels and volatility status
- Trading session information
- Last signal timing
## Alert System
### Standard Alerts
- **Scalp Long Signal**: Basic long entry signal
- **Scalp Short Signal**: Basic short entry signal
- **Premium Signals**: High-quality signals with strong confirmation
- **Trend Reversal**: Major trend change notifications
### Alert Setup
1. Right-click on chart → "Add Alert"
2. Select desired alert condition
3. Configure notification method (popup, email, webhook)
4. Set alert frequency to "Once Per Bar Close"
## Best Practices
### 1. Trading Sessions
- **Optimal**: London-NY overlap (3:00-5:00 PM EST)
- **Good**: London session (2:00-11:00 AM EST)
- **Avoid**: Asian session and major news releases
### 2. Market Conditions
- **Best**: Trending markets with normal to high volatility
- **Moderate**: Ranging markets during active sessions
- **Avoid**: Extremely low volatility or choppy conditions
### 3. Confirmation Rules
- Wait for signal triangle to appear
- Check that major trend aligns with signal direction
- Verify volume spike (yellow background)
- Ensure volatility is adequate (check info table)
### 4. Entry Timing
- Enter immediately after signal confirmation
- Use market orders for scalping speed
- Set stop loss and take profit levels immediately
## Settings Customization
### Essential Settings
- **MA Type**: EMA (recommended) or SMA
- **RSI Length**: 9 (default, can adjust 5-14)
- **Volume Threshold**: 1.8 (higher = fewer but stronger signals)
- **Volatility Filter**: Keep enabled for better signal quality
### Display Options
- **Show Scalping Signals**: Main entry signals
- **Show Performance Stats**: Information table
- **Show Trend Filter**: Background trend colors
- **Use Time Filter**: Session-based filtering
## Performance Optimization
### 1. Backtesting Tips
- Test on different market conditions
- Analyze win rate and average profit/loss
- Adjust settings based on historical performance
### 2. Signal Quality
- Higher trend strength (2-3) = better signals
- Volume confirmation improves success rate
- Enhanced signals have higher probability
### 3. Risk Control
- Never risk more than 2% per trade
- Use proper position sizing
- Stop trading after 3 consecutive losses
## Troubleshooting
### Common Issues
1. **No Signals**: Check volatility filter and session timing
2. **Too Many Signals**: Increase volume threshold or enable filters
3. **Poor Performance**: Verify timeframe (must be 3-minute) and symbol (XAU/USD)
### Support
- Ensure TradingView Pro+ subscription for multi-timeframe data
- Verify Gold symbol matches your broker's format
- Update to latest TradingView version
This indicator is designed for experienced traders familiar with scalping techniques and risk management. Always practice on demo accounts before live trading.

Stochastic with Z-Score📊 Stochastic with Z-Score
This custom indicator enhances the classic Stochastic Oscillator by applying Z-Score normalization to both %K and %D lines, helping traders identify statistically significant overbought and oversold conditions based on historical behavior.
🔍 Key Features:
Z-Score Normalization of %K and %D:
Detects deviations from the mean using standard deviation, offering a more dynamic and statistically grounded way to interpret momentum.
Signal Confirmation Filters:
✅ Trend Filter using 200 EMA: Only trade in the direction of the prevailing trend.
✅ Volume Filter: Confirms signals only when volume exceeds the moving average, reducing noise.
Buy & Sell Signals:
📈 Buy: Triggered when the Z-score of %K crosses above a negative threshold, %D is still below that threshold, and the candle is bullish.
📉 Sell: Triggered when the Z-score of %K crosses below a positive threshold, %D is still above that threshold, and the candle is bearish.
Signals are further filtered by trend and volume if enabled.
Customizable Thresholds & Settings:
Control Z-score length, thresholds, Stochastic lengths, and filter settings.
Visual Enhancements:
Colored histogram based on Z-score levels.
Shaded background in overbought/oversold zones.
Clear “Buy” and “Sell” labels plotted directly on the chart.
Alerts Included:
Set alerts on confirmed buy and sell signals for real-time notifications.
📘 How to Use:
Use this indicator on any timeframe or asset.
Enable or disable trend and volume filters depending on your strategy.
Use signals in confluence with price action or other indicators.
Adjust Z-score thresholds for more or fewer signals based on your risk profile.
⚠️ Note: This is an indicator, not a strategy. Always test signals on historical data and in simulation before live trading.

RSI Crossover Signal Companion - Alerts + Visuals🔷 RSI Crossover Signal Companion — Alerts + Visuals
The Relative Strength Index (RSI) is a momentum oscillator that measures the speed and change of recent price movements. It helps traders identify overbought or oversold conditions, possible trend reversals, and momentum strength.
This utility builds on TradingView’s classic Relative Strength Index (RSI) by adding real-time alerts and triangle markers when the RSI crosses its own moving average — a common technique for early momentum detection.
It is designed as a lightweight, visual companion tool for traders using RSI/MA crossover logic in manual or semi-automated strategies.
🔍 Features
✅ Preserves the full original RSI layout, including:
• Gradient fill and overbought/oversold zones
• Standard RSI input settings (length, source, etc.)
• MA smoothing options with user-defined type and length
🔺 Adds visual triangle markers:
🔼 Up triangle when RSI crosses above its MA
🔽 Down triangle when RSI crosses below its MA
📢 Built-in alerts for RSI/MA crosses:
“RSI Crossed Above MA”
“RSI Crossed Below MA”
📈 How to Use
This script is ideal for:
• Spotting early momentum shifts
• Confirming entries or exits in other systems (price action, trendlines, breakouts)
• Building alert-based automation (webhooks, bots, etc.)
Popular use cases:
• Combine with trend indicators like MA200 or MA12
• Use in confluence with price structure and divergence
• Validate breakout moves with momentum confirmation
⚙️ Customization
RSI length, MA length, MA type, and source are fully adjustable
Triangle marker size, shape, and color can be edited under Style
Alerts are pre-built and ready for use

Dual Momentum OSCOverview:
Momentum OSC is a dual-layered momentum oscillator that blends multi-timeframe momentum readings with moving average crossovers for deeper insight into trend acceleration and exhaustion. Perfect for confirming trend strength or spotting early shifts in momentum.
Features:
✅ Two separate momentum streams with customizable timeframes
✅ Smoothing via moving averages for both momenta
✅ Cross-timeframe momentum structure for confirmation and divergence
✅ Color-coded areas for intuitive visual interpretation
✅ Optional crossover markers to signal bullish/bearish momentum shifts
How It Works:
The script calculates two momentum values by comparing current price sources against lagged values across separate timeframes. Each is smoothed with a moving average to filter noise. The difference between momentum and its moving average forms a core component of trend strength confirmation. Optional visual circles mark bullish or bearish crossovers.
Customizable Inputs:
Timeframes, sources, lengths, and MA periods for both momentum streams
Toggle to display momentum cross signals (circles)
Works on any asset or timeframe

Modified RSIModified RSI (Round Number RSI)
Category: Oscillator / Momentum
Description
The Modified RSI (Round Number RSI) is an enhanced version of the classic Relative Strength Index (RSI), designed to provide clearer and more structured signals by rounding its values to whole numbers. This modification helps traders filter out noise, making trend analysis and overbought/oversold conditions easier to interpret.
Key Features:
✔ Rounded RSI Values – Instead of fluctuating with decimals, this RSI rounds values to whole numbers (e.g., 30, 50, 70) for clearer decision-making.
✔ Easier Signal Interpretation – Helps traders identify key RSI levels without distractions from small fluctuations.
✔ Customizable Lookback Period – Allows adjustment of RSI sensitivity to fit different trading strategies.
✔ Works on All Timeframes & Assets – Can be applied to stocks, forex, crypto, and futures.
How to Use It:
📌 Overbought & Oversold Levels:
RSI ≥ 70 → Market may be overbought (potential reversal or correction).
RSI ≤ 30 → Market may be oversold (potential buying opportunity).
📌 Trend Confirmation:
RSI staying above 50 signals bullish momentum.
RSI staying below 50 signals bearish momentum.
📌 Divergence Trading:
Price makes a new high, but RSI does not → Bearish Divergence (Possible Downtrend).
Price makes a new low, but RSI does not → Bullish Divergence (Possible Uptrend).
Best Used For:
📈 Day Traders & Swing Traders looking for simplified RSI signals.
📉 Trend Confirmation with moving averages or volume analysis.
⚡ Confluence Trading with support/resistance zones.
Why Use This Over Traditional RSI?
🔹 Removes unnecessary noise by rounding RSI values.
🔹 Helps traders focus on key levels (30, 50, 70).
🔹 Reduces decision fatigue for fast-paced trading.

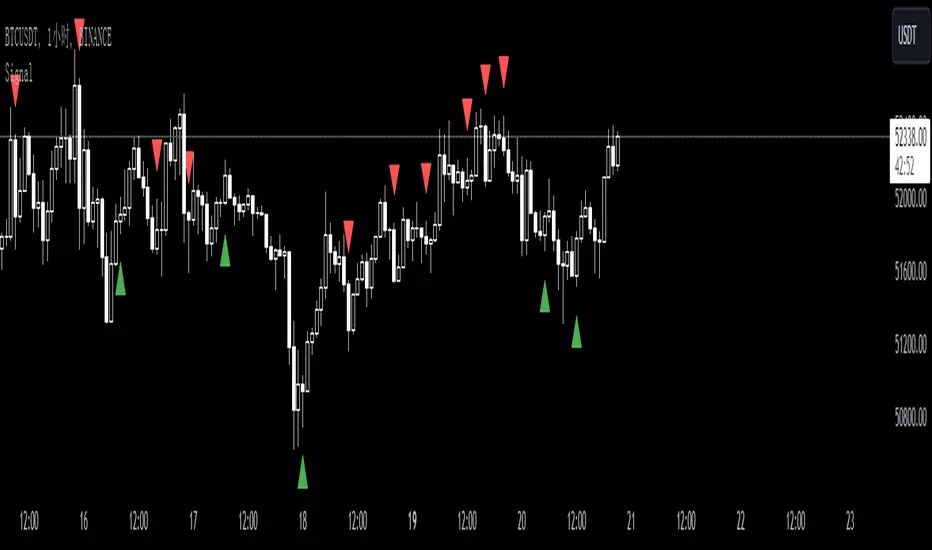
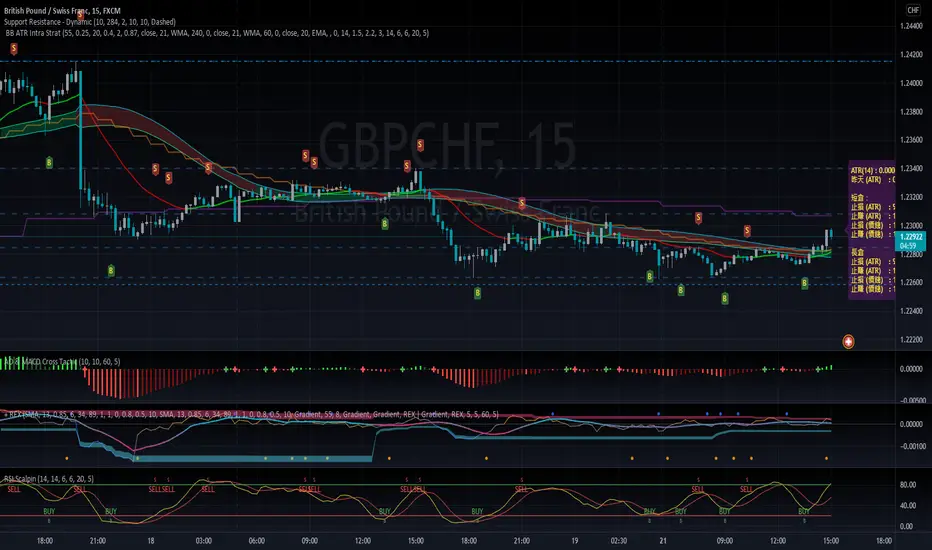
SignalThis custom TradingView indicator, named "Signal," is designed to generate buy and sell signals based on the Stochastic Oscillator, a momentum indicator that compares a particular closing price of an asset to a range of its prices over a certain period of time. The indicator is set to overlay on the price chart, providing visual cues for potential trading opportunities.
Key features of the "Signal" indicator include:
1. **Dynamic Period Adjustment**: The indicator automatically adjusts its settings based on the chart's time frame. For a 1-hour (60 minutes) chart, the stochastic length is set to 15, while for a 15-minute chart, the length is set to 10.
2. **Stochastic Calculation**: It calculates the %K line as a smoothed moving average (SMA) of the stochastic ratio, and the %D line as an SMA of the %K line, with both lines smoothed over a period derived from the dynamic length setting.
3. **Signal Detection**: The indicator identifies bullish crossovers (golden crosses) when the %K line crosses above the %D line and the average of both lines is below 50. Conversely, it detects bearish crossovers (death crosses) when the %K line crosses below the %D line and the average is above 50.
4. **Signal Confirmation**: Signals are confirmed using historical data with an offset of 1 bar to ensure that the crossover is evaluated after the close of the candlestick, thus avoiding repainting issues.
5. **Visual Indicators**: Buy signals are represented by green upward-pointing triangles placed below the bars, while sell signals are indicated by red downward-pointing triangles above the bars.
6. **Alerts**: The indicator includes alert conditions for both golden crosses and death crosses, notifying users when a potential buy or sell signal has been identified based on the stochastic crossover.
This indicator can be a valuable tool for traders who follow stochastic momentum signals and prefer to have dynamic adjustments based on the chart's time frame. It is important to note that, as with all trading indicators, the "Signal" indicator should be used in conjunction with other forms of analysis to confirm trading signals and manage risk effectively.
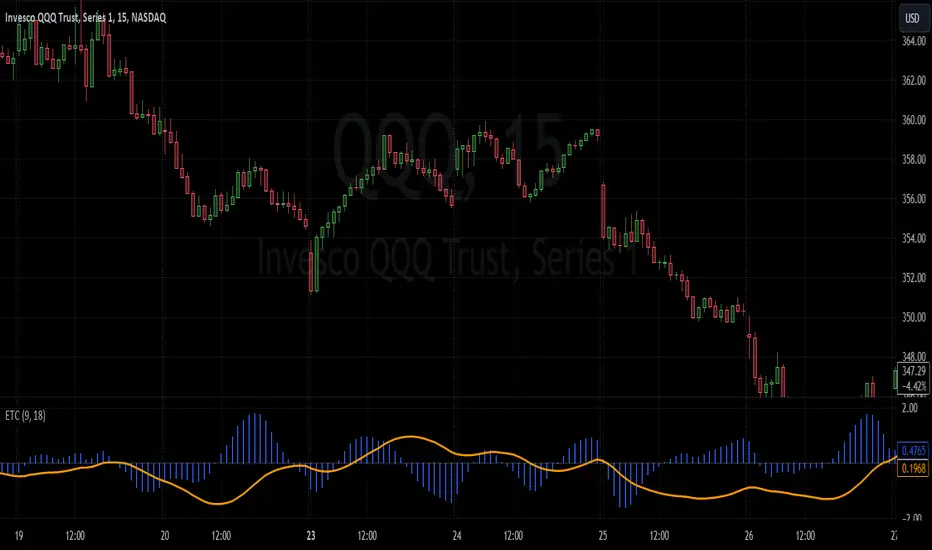
Enhanced TrixThe Enhanced Trix Confluence Oscillator involves utilizing two core components: a slow line and a difference histogram based on a shorter length. Another key aspect is the indicator using the DEMA for greater speed while the triple smoothing still provides accuracy which makes this different from the original indicator. This approach aims to rely on principles of both momentum and divergence.
The ETC aims to filter out market noise to reveal the core trend direction in both the short and medium term. A slow line is calculated using a longer time period with the double exponential moving average, which makes it less responsive to short-term price fluctuations and better at capturing longer-term momentum. It's best used to identify divergences with the asset's price, signaling potential reversals. The difference histogram serves as a more sensitive indicator for trade timing once further calibrated. It's calculated by taking the difference between the displayed length and a shorter period using the same calculation. This histogram also operates as a rate of change like the TRIX.
The slow line identifies broader trends and divergences, while the difference histogram offers a more granular view.
MTF CCI BarOVERVIEW
This indicator shows whether Commodity Channel Index (CCI) is above or below 0, represented by a bar. This indicator is compatible with MTF.
CONCEPTS
What do you want to know about market analysis?
Do you want a hard analysis? You can look for it.
All I want to know is whether the commonly known technical analysis is 'UP' or 'DOWN'.
All I want to know is whether the current market price is going up or down. Not only for the current, but also for the monthly, weekly, and daily status.
I want to make a decision in a moment. Without even thinking about it.
That is why I created a color-coded bar indicator to show the status.
No need to frown anymore.
DETAILS
CCI is a momentum oscillator used in technical analysis primarily to identify overbought and oversold levels by measuring an instrument's variations away from its statistical mean. For this indicator, I have removed the concept of overbought and oversold.
0 <= CCI green
0 > CCI red
However, with future upgrades, I would like to color-code it for overbought and oversold conditions as well.

Modified StochasticThis Oscillator using RMA smoothing. Feel free to explore and enjoy. Any suggestion, please leave comment.

RSI ScalpinThis is a test script for personal use only. A oscillator of Stochastic and DMI to catch buy and sell signal
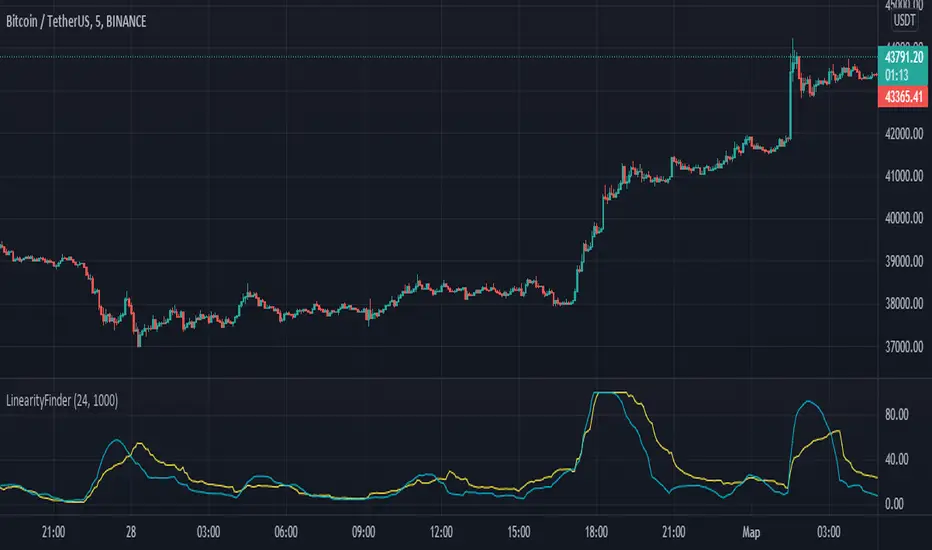
LinearityFinderThis indicator allows you to filter the chart from probable chaotic movements.
I use Stochastic oscillator mixing of Standard deviation and smoothed Volume .
When the standard deviation is higher than the volume , it is worth waiting for linear movements.
When the volume is above the standard deviation, it is worth waiting for chaotic movements.
Work on the indicator is in progress. I can make minor changes.
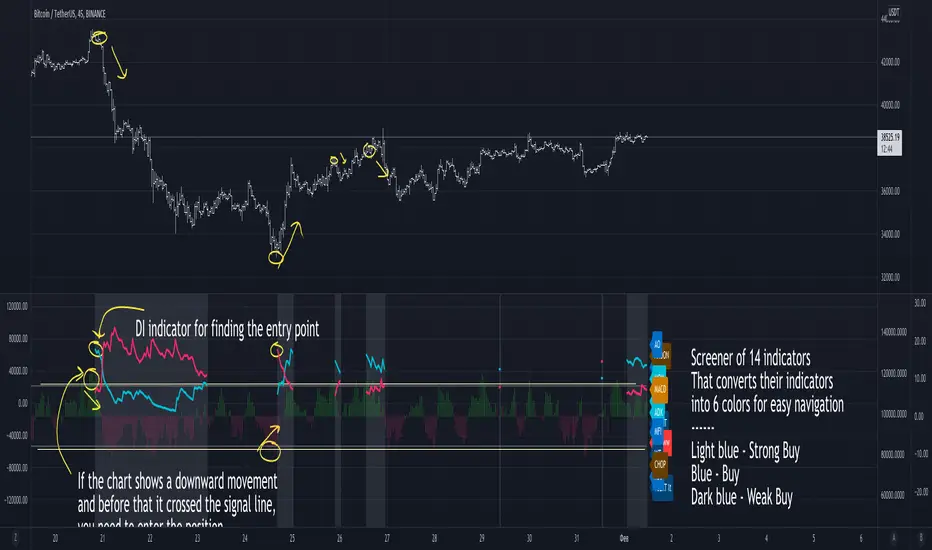
Right Way OscillatorThis is a large composite screener indicator that includes 14 different indicators, the values of which are arranged in a color format and show the current market situation,
as well as all these values are summarized in a chart, each value is weighted by strength, which allows you to get a comprehensive picture of the market at the moment,
2 signal lines are plotted on the indicator, their intersection means that most indicators will show the maximum score.
Also, at the expected moments of the appearance of a trend movement, a gray background lights up on the indicator and 2 colored lines of the DI indicator appear, the color of the bottom line indicates what kind of movement is brewing.
Cumulative AreaJust a short little script that gives the net area of an oscillator going back n bars. Feel free to play around with it.
To use with Market Cipher VWAP, make sure to go into the input settings and change the input "close" to "Market Cipher B: VWAP"
next add it to the same pane as your market cipher B, and lock the axis together.
Intended for use with MC, but could undoubtedly be used with others.

Close-open log OscillatorThis indicator give us the relation between open and close state via log method
close is green line,open state is black line
bullish is when open above 0 = green color
bearish is when bellow zero =red color
blue color is signal line

Jetto's Custom Indicator V.1I have added few lines of code to the wave trend oscillator to give you guys the most accurate copy of my personal indicator.

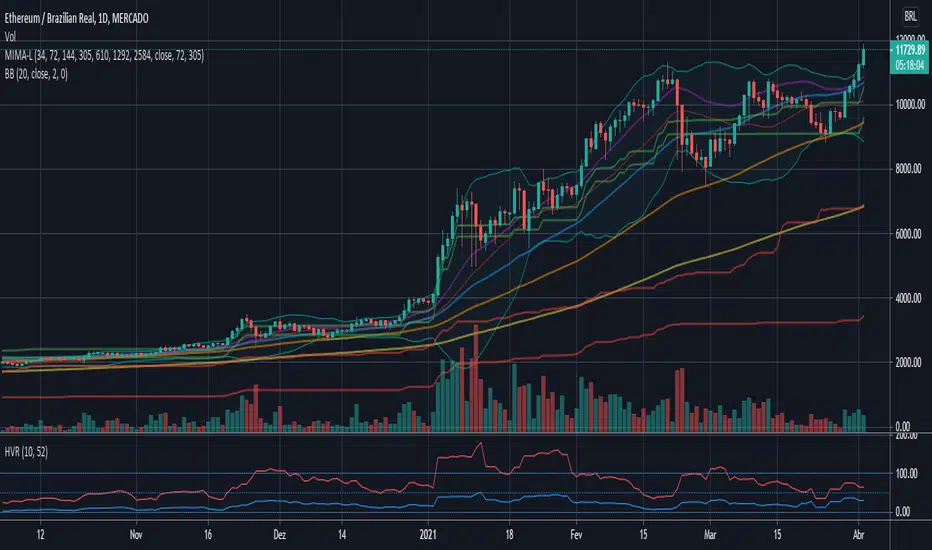
Historical Volatility RankBased on TradingView's Historical Volatility, it creates an oscillator using the 52 week's HV high and low. Exactly like IVR does to IVx.

RSI Step Oscillator [racer8]Purpose of RSO is to identify when RSI has reached key levels. These levels are 80, 70, 60, 40, 30, and 20.
When indicator displays a bar with color...
Purple : RSI > 80
Blue : RSI > 70
Green : RSI > 60
Gray : RSI is inbetween 40 and 60.
Yellow : RSI < 40
Orange : RSI < 30
Red : RSI < 20
Hit the like button and enjoy 😁
