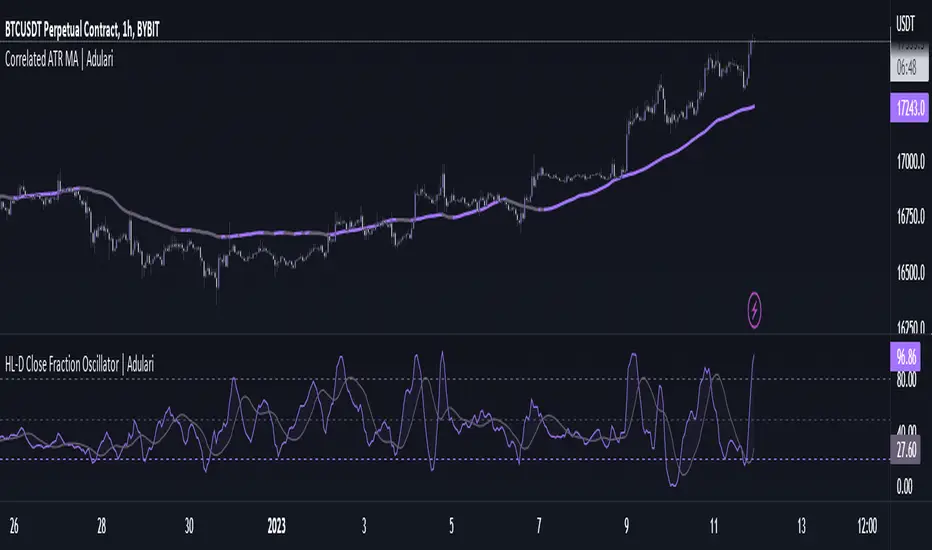
HL-D Close Fraction Oscillator | AdulariDescription:
This indicator calculates the difference between price high's and low's, and fractions it by the close price. If it calculates the difference between a high and low or low and high is defined by whether the current close is higher than the previous close. It is then also rescaled to ensure the value is always appropriate compared to the last set amount of bars.
This indicator can be used to determine whether a market is trending or ranging, and if so in which direction it is trending.
How do I use it?
Never use this indicator as standalone trading signal, it should be used as confluence.
When the value is above the middle line this shows the bullish trend is strong.
When the value is below the middle line this shows the bearish trend is strong.
When the value crosses above the upper line this indicates the trend may reverse downwards.
When the value crosses below the lower line this indicates the trend may reverse upwards.
When the value crosses above the signal this indicates the current bearish trend is getting weak and may reverse upwards.
When the value crosses below the signal this indicates the current bullish trend is getting weak and may reverse downwards.
Features:
Oscillator value indicating the difference between highs and lows fractioned by the close price.
Signal indicating a clear trend and base line value.
Horizontal lines such as oversold, overbought and middle lines, indicating possible interest zones.
How does it work?
1 — Define trend by checking if current close is above or below previous close.
2 — If the current close is above the previous close, calculate the oscillator's value using this formula:
(high - low) / close
2 — If the current close is below the previous close, calculate the oscillator's value using this formula:
(low - high) / close
3 — Smooth the original value using a specified moving average.
4 — Rescale the value using this formula:
newMin + (newMax - newMin) * (value - oldMin) / math.max(oldMax - oldMin, 10e-10)
5 — Calculate signal value by applying smoothing to the oscillator's value.
Cerca negli script per "oscillator"
True Momentum OscillatorThe True Momentum Oscillator (TMO) calculates the delta of the price using the open and close. We have taken the true momentum oscillator a step further and have added the momentum of the main signal (TMO) and the smooth signal line. We believe this helps give a clearer picture of price momentum and helps verify crossovers of the TMO and the smooth signal line. The momentum lines can also help confirm a divergence of the TMO. We have also added multiple moving average options so the user can customize the TMO to suit their needs.
TMO- Green when above Smooth Signal Line, red when below Smooth Signal Line
Smooth Signal- Gray Line
Histogram- TMO-Smooth Signal
TMO Momentum- Orange line
Smooth Signal Momentum- Yellow line
Overbought/Oversold regions- Gray highlighted boundaries
The TMO has defined overbought and oversold regions where either a crossover signal or divergence in the oscillator itself can be taken as a signal. Similar to the MACD, a crossover of the zero line by the TMO can also be utilized as a signal.

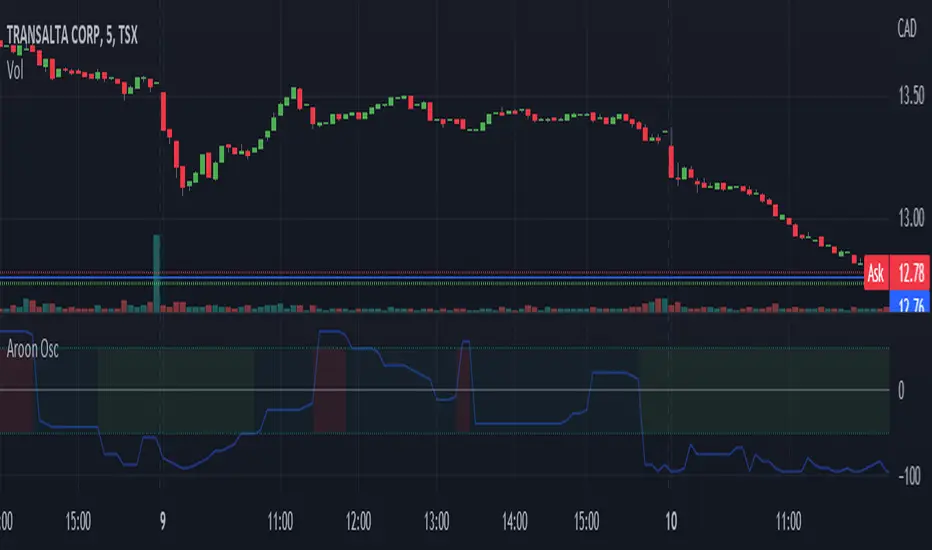
Aroon Oscillator [bkeevil]The Aroon Oscillator is intended to highlight short-term trend changes by comparing the number of periods since the last high with the number of periods since the last low.
Since the crossover rules for this oscillator frequently give false signals, I have opted for a more general approach: When the oscillator passes above the 50 line, the background of the indicator will turn green, indicating a general short term buy condition. When the oscillator passes below the -50 line, the background of the indicator will turn red, indicating a general short term sell condition. Use this indicator in combination with other indicators and price signals to identify short term trend changes.
This version improves on existing versions by:
Adding background colors to indicate general buy/sell conditions
More visually appealing
Uses the latest version 5 features
Well documented source code that conforms to the style guide
[Sextan] M-Oscillator BacktestLevel: 1
NOTE: This is a request by @scantor516 to backtest M-Oscillator by Mango2Juice with my Sextan framework. I ONLY take 5 minutes to perform it and how much time would you cost for this work?
Courtesy of Mango2Juice for M-Oscillator script.
You can backtest many of my indicators in minutes now! Of course,you can define your own indicator in the highlighted area in compliance with the uniform format, which guarantee when you use "Indicator on Indicator" function, it would not produce any error.
Background
Backtesting of technical indicators and strategies is the most common way to understand a quantitative strategy. However, the complicated configuration and adaptation work of backtesting many quantitative tools makes many traders who do not understand the code daunted. Moreover, although I have written a lot of strategies, I am still not very satisfied with the backtest configuration and writing efficiency. Therefore, I have been thinking about how to build a backtesting framework that can quickly and easily evaluate the backtesting performance of any indicator with a "long/short entry" indicator, that is, a "simple backtesting tool for dummies". The performance requirements should be stable, and the operation should be simple and convenient. It is best to "copy", "paste", and "a few mouse clicks" to complete the quick backtest and evaluation of a new indicator.
Luckily, I recently realized that TradingView provides an "Indicator on Indicator" feature, which is the perfect foundation for doing "hot swap" backtesting. My basic idea is to use a two-layer design. The first layer is the technical indicator signal source that needs to be embedded, which is only used to provide buy and sell signals of custom strategies; the second layer is the trading system, which is used to receive the output signals of the first layer, and filter the signals according to the agreed specifications. , Take Profit, Stop Loss, draw buy and sell signals and cost lines, define and send custom buy and sell alert messages to mobile phones, social software or trading interfaces. In general, this two-layer design is a flexible combination of "death and alive", which can meet the needs of most traders to quickly evaluate the performance of a certain technical indicator. The first layer here is flexible. Users can insert their own strategy codes according to my template, and they can draw buy and sell signals and output them to the second layer. The second layer is fixed, and the overall framework is solidified to ensure the stability and unity of the trading system. It is convenient to compare different or similar strategies under the same conditions. Finally, all trading signals are drawn on the chart, and the output strategy returns. test report.
The main function:
The first layer: "{Sextan} Your Indicator Source", the script provides a template for personalized strategy input, and the signal and definition interfaces ensure full compatibility with the second layer. Backtesting is performed stably in the backtesting framework of the layer. The first layer of this script is also relatively simple: enter your script in the highlighted custom script area, and after ensuring the final buy and sell signals long = bool condition, short = bool condition, the design of the first layer is considered complete. Input it into the PINE script editor of TradingView, save it and add it to the chart, you can see the pulse sequence in yellow (buy) and purple (sell) on the sub-picture, corresponding to the main picture, you can subjectively judge that the quality of the trading point of the strategy is good Bad.
The second layer: "{Sextan} PINEv4 Sextans Backtest Framework". This script is the standardized trading system strategy execution and alarm, used to generate the final report of the strategy backtest and some key indicators that I have customized that I find useful, such as: winning rate , Odds, Winning Surface, Kelly Ratio, Take Profit and Stop Loss Thresholds, Trading Frequency, etc. are evaluated according to the Kelly formula. To use the second layer, first load it into the TrainingView chart, no markers will appear on the chart, since you have not specified any strategy source signals, click on the gear-shaped setting next to the "{Sextan} PINEv4 Sextans BTFW" header button, you can open the backtest settings, the first item is to select your custom strategy source. Because we have added the strategy source to the chart in the previous step, you can easily find an option "{Sextan} Your Indicator Source: Signal" at the bottom of the list, this is the strategy source input we need, select and confirm , you can see various markers on the main graph, and quickly generate a backtesting profit graph and a list of backtesting reports. You can generate files and download the backtesting reports locally. You can also click the gear on the backtest chart interface to customize some conditions of the backtest, including: initial capital amount, currency type, percentage of each order placed, amount of pyramid additions, commission fees, slippage, etc. configuration. Note: The configuration in the interface dialog overrides the same configuration implemented by the code in the backtest script.
How to output charts:
The first layer: "{Sextan} Your Indicator Source", the output of this script is the pulse value of yellow and purple, yellow +1 means buy, purple -1 means sell.
The second layer: PINEv4 Sextans Backtest Framework". The output of this script is a bit complicated. After all, it is the entire trading system with a lot of information:
1. Blue and red arrows. The blue upward arrow indicates long position, the red downward arrow indicates short position, and the horizontal bar at the end of the purple arrow indicates take profit or stop loss exit.
2. Red and green lines. This is the holding cost line of the strategy, green represents the cost of holding a long position, and red represents the cost of holding a short position. The cost line is a continuous solid line and the price action is relatively close.
3. Green and yellow long take profit and stop loss area and green and yellow long take profit and stop loss fork. Once a long position is held, there is a conditional order for take profit and stop loss. The green horizontal line is the long take profit ratio line, and the yellow is the long stop loss ratio line; the green cross indicates the long take profit price, and the yellow cross indicates the long position. Stop loss price. It's worth noting that the prongs and wires don't necessarily go together. Because of the optimization of the algorithm, for a strong market, the take profit will occur after breaking the take profit line, and the profit will not be taken until the price falls.
4. The purple and red short take profit and stop loss area and the purple red short stop loss fork. Once a short position is held, there will be a take profit and stop loss conditional order, the red is the short take profit ratio line, and the purple is the short stop loss ratio line; the red cross indicates the short take profit price, and the purple cross indicates the short stop loss price.
5. In addition to the above signs, there are also text and numbers indicating the profit and loss values of long and short positions. "L" means long; "S" means short; "XL" means close long; "XS" means close short.
TradingView Strategy Tester Panel:
The overview graph is an intuitive graph that plots the blue (gain) and red (loss) curves of all backtest periods together, and notes: the absolute value and percentage of net profit, the number of all closed positions, the winning percentage, the profit factor, The maximum trading loss, the absolute value and ratio of the average trading profit and loss, and the average number of K-lines held in all trades.
Another is the performance summary. This is to display all long and short statistical indicators of backtesting in the form of a list, such as: net profit, gross profit, Sharpe ratio, maximum position, commission, times of profit and loss, etc.
Finally, the transaction list is a table indexed by the transaction serial number, showing the signal direction, date and time, price, profit and loss, accumulated profit and loss, maximum transaction profit, transaction loss and other values.
Remarks
Finally, I will explain that this is just the beginning of this model. I will continue to optimize the trading system of the second layer. Various optimization feedback and suggestions are welcome. For valuable feedback, I am willing to provide some L4/L5 technical indicators as rewards for free subscription rights.

TASC 2022.02 Ehlers' Elegant Oscillator█ OVERVIEW
TASC's February 2022 edition of Traders' Tips includes the "Inverse Fisher Transform Redux — An Elegant Oscillator" article authored by John Ehlers. This is the code implementing the "Elegant Oscillator" from the article.
█ CONCEPTS
By applying the inverse Fisher transform to a waveform with a nominal Gaussian probability distribution using root mean square ( RMS ) scaling and smoothing the result, John Ehlers creates an oscillator that swings between -1 and 1.
█ CALCULATIONS
The calculation process uses the following steps:
• Compute the 2-bar difference of closing prices.
• Calculate the root mean square (RMS) of the differences.
• Scale the differences using the computed RMS.
• Apply the inverse Fisher transform to the scaled values.
• Smooth the transformed data with the SuperSmoother filter.
Join TradingView!

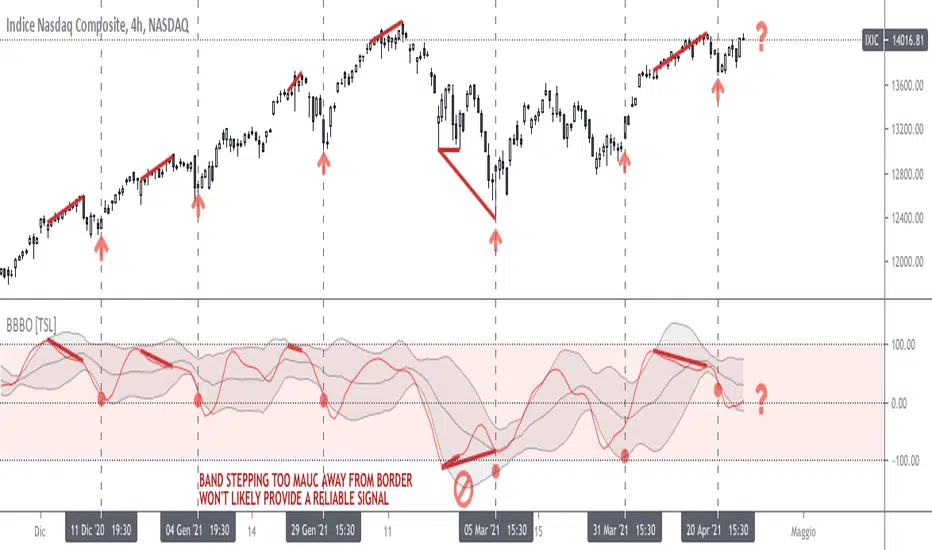
Bollinger on Bollinger OscillatorThis study is a user-friendly workaround to the BBOE+ (attached at the bottom).
I applied Bollinger Bands on BB Oscillator which spend his time bouncing between +100 -100 levels both representing extremes market conditions. You can use it to spot reliable entries/exits opportunities.
During an uptrend when the oscillator tends to -100 and the lower BB turn up you should consider a BUY. Do the same thing when the oscillator pushes under the lower BB nearby the Zero Line.
Make the opposite during a downtrend.
Also look for divergencies that occurs nearby the borders and BB squeezes too.
You can vary both the lenght for the Oscillator and BB.
Use “Upper Multiplier” and “Lower Multiplier” to set two different StDev from the basis (if you need).
You may also consider to apply an offset to the BB.
Is up to you to match the configuration that better-fits your market and time frame.
Default settings could well fits this IXIC 4H Chart.
So that this is basically a price-based indicator you would better consider to pair it with a volume-based or an absolute-momentum-based one.
SHARING IS INTENDED FOR EDUCATIONAL PURPOSE ONLY. NOT FOR PROFESSIONAL USE.
WILL APPRECIATE ANY FEEDBACK, QUESTION, SUGGESTION. (*)
(*) Please don’t ask me for “magic-setting” that do not exit, nor for “kaleidoscopic effects” cause I’m a big fan of such a minimalistic yet profession layouts.
FOLLOW UP TO CHECK UPDATES!
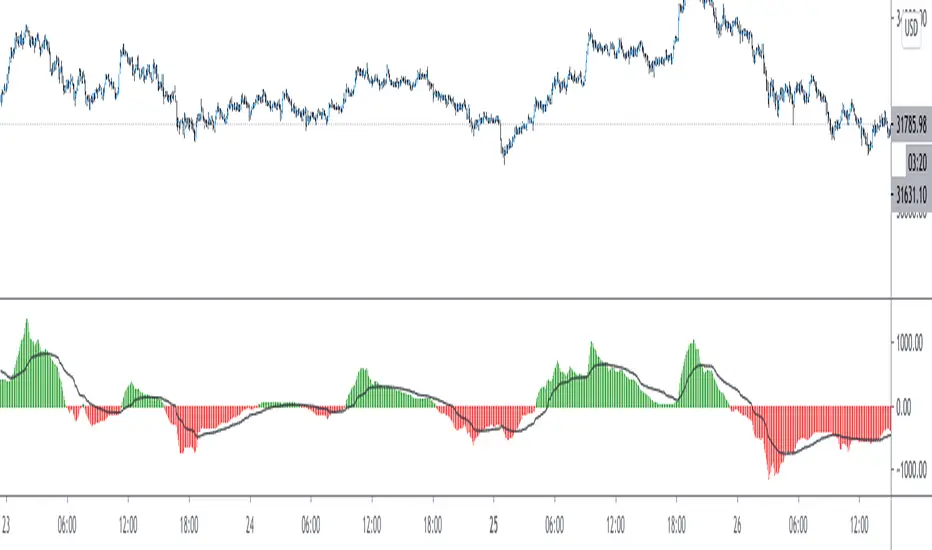
Flunki T-WAP minus MA Oscillator
Yo,
Possible the last of these for now, and mostly for the sake of completeness..
This is..
Another simple oscillator that show the difference in price between a selectable timeframe TWAP and a Moving Average of that TWAP
This is shown as a histogram.
Use numeric TWAP values for minutes (30, 60 ,720 whatever) and D, 3D, W, M for higher values
There is also a global timeframe which will set the timeframe for a global alternate timeframe (instead of current chart resolution)
On top of that is a Moving Average of the histogram value, shown as a blue / red line with an option to highlight this MA crossing zero, and an option to colour bars to this line.
The major difference between this Oscillator, and the other script (Flunki VWAP minus MA Oscillator)
(I treid to insert a link but it's invisible so it would seem, anyway.. )
is that VWAP is usually calculated daily, so there is a sharp move upon the daily close, as VWAP starts a new day. Using TWAP this does not occur, so gives smoother transitions ; also the timeframe for TWAP is selectable for additional wap fun.
Simple idea : Code open
Enjoy !

Uber Strength OscillatorThis is my Uber Oscillator applied to RSI essentially. So its like an Ultimate Oscillator with more lengths added, but instead of MAs its RSIs. So its a multi-momentum index of sorts. Part of my efforts in realizing the amazing potential of using multiple lengths of an oscillator to get a bigger picture, while also recognizing that simply stacking them on top of eachother is so ugly and hard to read that it can easily result in mistakes if you arent super careful. So this is an attempt to make that clearer.

Forecast OscillatorThe Forecast Oscillator is a technical indicator that compares a security close price to its time series forecast. The time series forecast function name is "tsf" and it calculates the projection of the price trend for the next bar.
The Forecast Oscillator and therefore the time series forecast are based on linear regression. The time series forecast indicator is equal to the sum of two other indicators: the linear regression (LinearReg) and the linear regression slope (LinearReg_Slope).
If the Forecast Oscillator stays above the zero line for an extended period, then it signals that the price may rise in the future and if it stays below the zero line for an extended period, then it signals a coming fall in the security price.
The indicator name is "Forecast Oscillator" and it accepts two arguments. The first argument is the time series that is used in the next bar forecast (It is usually the close price) and the second one is the period that will be passed to the time series forecast function during calculation . The technical analysis indicator returns a value in percentage that corresponds to the close price minus the previous value of the time series forecast, multiplied by 100 and divided by the close price.
Author's Note:
Just look at the exaggerated movements of the oscillator especially in trend changes . Some examples can be experienced on the chart in rectangles.
Kıvanç Özbilgiç

Delta-RSI Oscillator StrategyDelta-RSI Oscillator Strategy:
This strategy illustrates the use of the recently published Delta-RSI Oscillator as a stand-alone indicator.
Delta-RSI represents a smoothed time derivative of the RSI, plotted as a histogram and serving as a momentum indicator.
There are three optional conditions to generate trading signals (set separately for Buy, Sell and Exit signals):
Zero-crossing : bullish when D-RSI crosses zero from negative to positive values (bearish otherwise)
Signal Line Crossing : bullish when D-RSI crosses from below to above the signal line (bearish otherwise)
Direction Change : bullish when D-RSI was negative and starts ascending (bearish otherwise)
Since D-RSI oscillator is based on polynomial fitting of the RSI curve, there is also an option to filter trade signal by means of the root mean-square error of the fit (normalized by the sample average).
My original D-RSI Oscillator script can be found here:

FRAMA Awesome Oscillator (FAO)FRAMA Awesome Oscillator (FAO) is an indicator that is non-limiting oscillator, providing insight into the weakness or the strength of a security. The Oscillator is used to measure market momentum and to affirm trends or to anticipate possible reversals. It does this by effectively comparing the recent market momentum, with the general momentum over a wider frame of reference.
FRAMA stands for
The Oscillator in the script is calculated using FRAMA of length 55
which is segmented by EVWMA of FRAMA
Calculations:
AO = (Difference of FRAMA and eVWMA basis of FRAMA) or diff
Represented by green and red columns
The black segmenting line is an eVWMA line of diff and is of length 21
This indicator may be useful in finding divergences and can be traded as we trade awesome oscillator in general
Combo Strategy 123 Reversal & Gann Swing Oscillator This is combo strategies for get a cumulative signal.
First strategy
This System was created from the Book "How I Tripled My Money In The
Futures Market" by Ulf Jensen, Page 183. This is reverse type of strategies.
The strategy buys at market, if close price is higher than the previous close
during 2 days and the meaning of 9-days Stochastic Slow Oscillator is lower than 50.
The strategy sells at market, if close price is lower than the previous close price
during 2 days and the meaning of 9-days Stochastic Fast Oscillator is higher than 50.
Second strategy
The Gann Swing Oscillator has been adapted from Robert Krausz's book,
"A W.D. Gann Treasure Discovered". The Gann Swing Oscillator helps
define market swings.
WARNING:
- For purpose educate only
- This script to change bars colors.

[blackcat] L2 Swing Oscillator Swing MeterLevel: 2
Background
Swing trading is a type of trading aimed at making short to medium term profits from a trading pair over a period of a few days to several weeks. Swing traders mainly use technical analysis to look for trading opportunities. In addition to analyzing price trends and patterns, these traders can also use fundamental analysis.
Function
L2 Swing Oscillator Swing Meter is an oscillator based on breakouts. Another important feature of it is the swing meter, which confirms the top or bottom's confidence level with different color candles. The higher of the candles stack up, the higher confidence level is indicated.
Key Signal
absolutebot ---> absolute bottom with very high confidence level
ltbot ---> long term bottom with high confidence level
mtbot ---> middle term bottom with moderate confidence level
stbot ---> short term bottom with low confidence level
absolutetop ---> absolute top with very high confidence level
lttop ---> long term top with high confidence level
mttop ---> middle term top with moderate confidence level
sttop ---> short term top with low confidence level
fastline ---> oscillator fast line
slowline ---> oscillator slow line
Pros and Cons
Pros:
1. reconfigurable swing oscillator based on breakouts
2. swing meter can confirm/validate the bottom and top signal
Cons:
1. not appliable with trading pairs without volume information
2. small time frame may not trigger swing meter function
Remarks
This is a simple but very comprehensive technical indicator
Readme
In real life, I am a prolific inventor. I have successfully applied for more than 60 international and regional patents in the past 12 years. But in the past two years or so, I have tried to transfer my creativity to the development of trading strategies. Tradingview is the ideal platform for me. I am selecting and contributing some of the hundreds of scripts to publish in Tradingview community. Welcome everyone to interact with me to discuss these interesting pine scripts.
The scripts posted are categorized into 5 levels according to my efforts or manhours put into these works.
Level 1 : interesting script snippets or distinctive improvement from classic indicators or strategy. Level 1 scripts can usually appear in more complex indicators as a function module or element.
Level 2 : composite indicator/strategy. By selecting or combining several independent or dependent functions or sub indicators in proper way, the composite script exhibits a resonance phenomenon which can filter out noise or fake trading signal to enhance trading confidence level.
Level 3 : comprehensive indicator/strategy. They are simple trading systems based on my strategies. They are commonly containing several or all of entry signal, close signal, stop loss, take profit, re-entry, risk management, and position sizing techniques. Even some interesting fundamental and mass psychological aspects are incorporated.
Level 4 : script snippets or functions that do not disclose source code. Interesting element that can reveal market laws and work as raw material for indicators and strategies. If you find Level 1~2 scripts are helpful, Level 4 is a private version that took me far more efforts to develop.
Level 5 : indicator/strategy that do not disclose source code. private version of Level 3 script with my accumulated script processing skills or a large number of custom functions. I had a private function library built in past two years. Level 5 scripts use many of them to achieve private trading strategy.

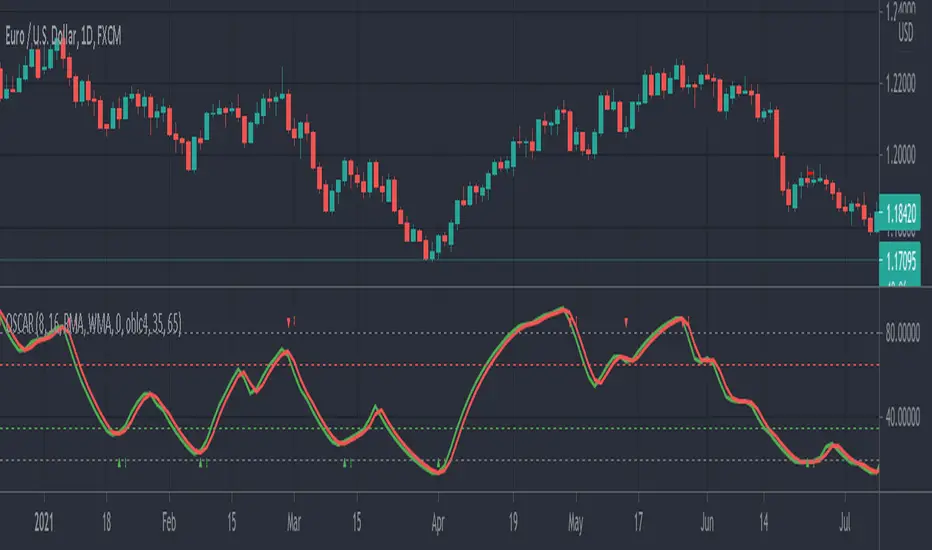
OSCAR Oscillator by GenZai - NNFXOSCAR Oscillator by GenZai
Green line is the Oscar Rough
Red line is the Oscar
By default based on the 8 last candles and smoothed using RMA
Purple line is the Slow Oscar
By default based on the 16 last candles and smoothed using WMA
HOW TO USE
Exit signaling
This indicator can be used as an exit indicator when line cross each other.
Entry signaling
When the green line crosses up, it indicates a long entry
When the red line crosses up, it indicates a short entry
Overbought/Oversold
When the indicator crosses the dashed grey lines it indicates Overbought Oversold
Slow Oscar Add-on
This is an Add-on to the orignal Oscar indicator
Can be hidden if you want the original experience of the Oscar indicator.
Can be used as a confirmation indicator by looking at the direction of the slope to verify is your are trending long or trending short.
Can be used as a baseline to confirm signals given by Oscar
Can be used to tweak your signals and test different settings.
Stock or Forex?
The program was originally written for stocks, but works equally well with the Forex market.
How this indicator is calculated ?
This is the formula we use to calculate the Oscar:
let A = the highest high of the last eight days (including today)
let B = the lowest low of the past eight days (including today)
let C = today's closing price
let X = yesterday's oscillator figure (Oscar)
Today's "rough" oscillator equals (C-B) divided by (A-B) times 100.
Next we "smooth" our rough number (let's call it Y) like this:
Final oscillator number = ((X divided by 3) times 2), plus (Y divided by 3).
SETTINGS:
You can choose between different smoothing options:
RMA: Moving average used in RSI. It is the Adjusted exponential moving averages (also known as Wilder's exponential moving average)
SMA : Simple moving average
EMA : Exponential moving average
WMA : Weighted moving average
BankNifty Modified McClellan OscillatorThe McClellan Oscillator developed by Marian McClellan is a useful breadth indicator because it describes the acceleration that takes place in the breadth numbers.
How to read McClellan Oscillator
A positive or negative value gives a simplistic bullish or bearish statement about the short-term trend of the market
Very low readings show oversold conditions
Very high readings show overbought conditions
Divergences are also important to look for as a sign that the strength of a trend is waning
Here same oscillator is rebuilded for BANKNIFTY using the difference between Capital weighted Up Volume and Down Volume instead of Advance - Decline.

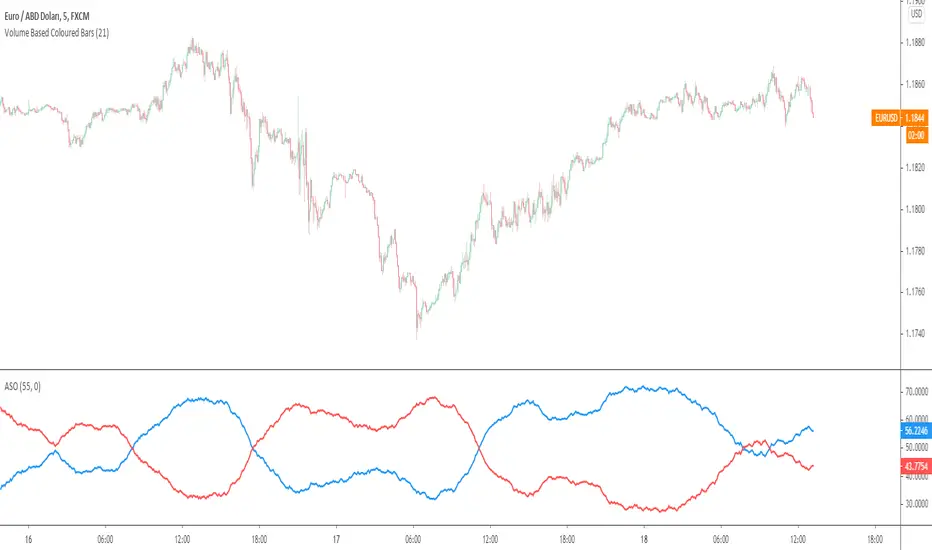
Average Sentiment OscillatorDescription of this indicator from its author:
Average Sentiment Oscillator
Momentum oscillator of averaged bull/bear percentages.
We suggest using it as a relatively accurate way to gauge the sentiment of a given period of candles, as a trend filter or for entry/exit signals.
It’s a combination of two algorithms, both essentially the same but applied in a different way. The first one analyzes the bullish/bearishness of each bar using OHLC prices then averages all percentages in the period group of bars (eg. 10) to give the final % value. The second one treats the period group of bars as one bar and then determines the sentiment percentage with the OHLC points of the group. The first one is noisy but more accurate in respect to intra-bar sentiment, whereas the second gives a smoother result and adds more weight to the range of price movement. They can be used separately as Mode 1 and Mode 2 in the indicator settings, or combined as Mode 0.
Original indicator idea from Benjamin Joshua Nash, converted from MT4 version
Usage:
The blue line is Bulls %, red line is Bears %. As they are both percentages of 100, they mirror each other. The higher line is the dominating sentiment. The lines crossing the 50% centreline mark the shift of power between bulls and bears, and this often provides a good entry or exit signal, i.e. if the blue line closes above 50% on the last bar, Buy or exit Sell, if the red line closes above 50% on the last bar, Sell or exit Buy. These entries are better when average volume is high.
It's also possible to see the relative strength of the swings/trend, i.e. a blue peak is higher than the preceding red one. A clear divergence can be seen in the picture as the second bullish peak registers as a lower strength on the oscillator but moved higher on the price chart. By setting up levels at the 70% and 30% mark the oscillator can also be used for trading overbought/oversold levels similar to a Stochastic or RSI. As is the rule with most indicators, a smaller period gives more leading signals and a larger period gives less false signals.
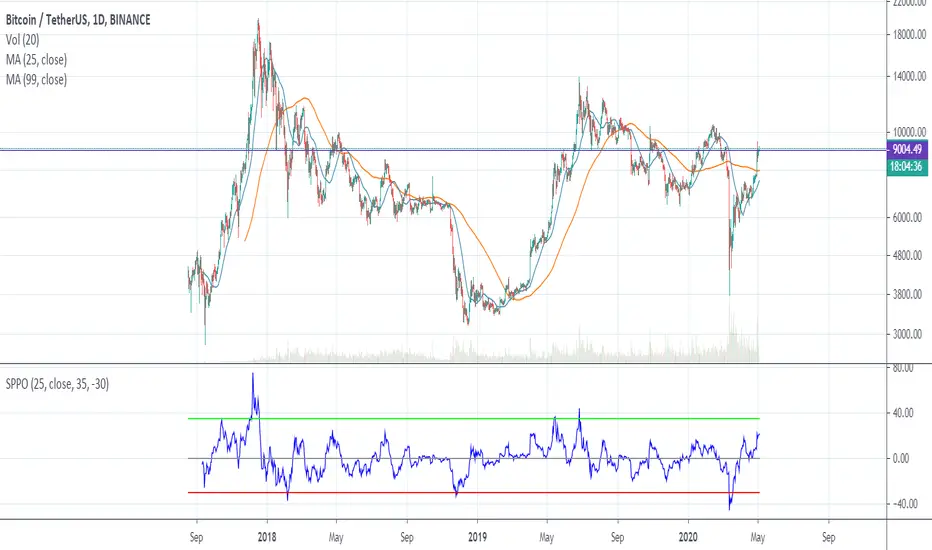
SPPO — Simple Percentage Price Oscillator SPPO is Simple Percentage Price Oscillator .
SPPO is calculated as the ratio of the current price to the moving average.
This indicator is used in the trading strategy to determine overbought and oversold markets. Chart period D1.
I use this oscillator on the BTCUSD and ETHUSD pairs. It can also be used on other top crypto symbols.
If SPPO on the BTCUSDT chart > 35%, this means that in the Bitcoin market pamp . So it’s time to close long positions.
If SPPO on the bitcoin chart is <-30%, then bitcoin is oversold and you need to think about starting to buy it.
Recommended timeframe: 1d
Input parameters:
MA Length — number of bars for moving average. Default = 25.
Source — type of price used to calculate the MA. Default = close.
High Level — upper horizontal constant on the SPPO chart. Default = 35.
Low Level — lower horizontal constant on the SPPO chart. Default = -35.
Simple MA(Oscillator) — type of MA indicator used. If false = Exponential Moving Average , if true = Simple Moving Average . Default = true.
Combo Strategy 123 Reversal & DiNapoli Detrended Oscillator This is combo strategies for get a cumulative signal.
First strategy
This System was created from the Book "How I Tripled My Money In The
Futures Market" by Ulf Jensen, Page 183. This is reverse type of strategies.
The strategy buys at market, if close price is higher than the previous close
during 2 days and the meaning of 9-days Stochastic Slow Oscillator is lower than 50.
The strategy sells at market, if close price is lower than the previous close price
during 2 days and the meaning of 9-days Stochastic Fast Oscillator is higher than 50.
Second strategy
DiNapoli Detrended Oscillator Strategy
WARNING:
- For purpose educate only
- This script to change bars colors.

Bagot Price Oscillator "BPO"This is BP Oscillator / Bagot Price Oscillator
It is part of the Rabbit hole algorithm/ strategy which jets to be revealed
but works stand aloe very good
Initial idea: When lines cross it signals you change of trend
but since reversal trading is a sucker game, you should wait for your baseline to get broken in the signal direction
blue - long
red - short
Baseline options: any style of MA or line on chart indicator, speed of baseline for this oscillator needs to be on the faster side of mid-speed settings, ex.: if you would be using MA that would be around 15, for HMA round 20 -30
Important
The slower line "50" of the BPO needs to be set to: is centered

Combo Strategy 123 Reversal & Chande Forecast Oscillator This is combo strategies for get a cumulative signal.
First strategy
This System was created from the Book "How I Tripled My Money In The
Futures Market" by Ulf Jensen, Page 183. This is reverse type of strategies.
The strategy buys at market, if close price is higher than the previous close
during 2 days and the meaning of 9-days Stochastic Slow Oscillator is lower than 50.
The strategy sells at market, if close price is lower than the previous close price
during 2 days and the meaning of 9-days Stochastic Fast Oscillator is higher than 50.
Second strategy
The Chande Forecast Oscillator developed by Tushar Chande The Forecast
Oscillator plots the percentage difference between the closing price and
the n-period linear regression forecasted price. The oscillator is above
zero when the forecast price is greater than the closing price and less
than zero if it is below.
WARNING:
- For purpose educate only
- This script to change bars colors.

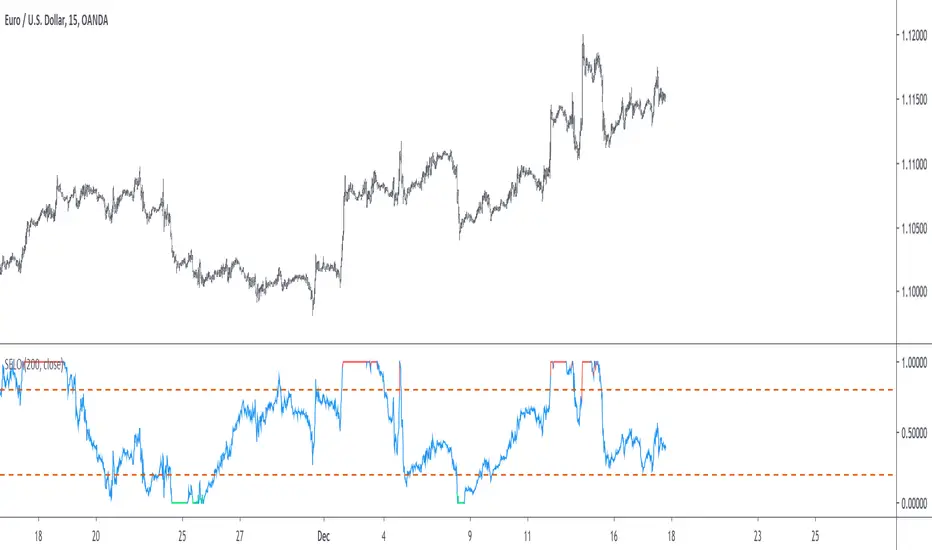
Stationary Extrapolated Levels OscillatorIntroduction
The oscillator version of the stationary extrapolated levels indicator. The methodology behind the extrapolated levels where to minimize the risk of making a decision based only on a forecast, therefore the indicator plotted levels in order to determine possible reversal points, signals where generated when the detrended series crossed over/under those levels.
The Indicator
First we detrend the price, this is because forecasting the trend is often harder than a series without trend (stationarity > non-stationarity) , then we forecast the detrended price with a linear extrapolation over a period of length and apply a max/min filter twice to the forecast, the max/min filters are just the highest and lowest function in pine. So the max/min filter have lag length/2 , by applying it two times we have a lag of length which is the period of the forecast. Because we use highest and lowest we can apply min-max normalization in the form of :
x' = (x - min(x, min'))/(max(x,max') - min(x, min'))
where x is the detrended price, max' the highest of the forecast of x and min' the lowest of the forecast of x . This result in a scaled oscillator in a range of (1,0),
When the indicator is equal to 1 or 0 there are high chances of reversals, more in depth this mean that the detrended price have crossed the highest/lowest of the forecast, when the indicator is equal to 0 or 1 for a long time this mean that the forecast was quite inaccurate, you can minimize risk by focusing on the cross between the detrended price and the 0.8/0.2 levels.
Conclusion
I've shown an oscillator version of my previous "Stationary extrapolated levels" indicator, the method involving taking the highest and lowest of the forecast is a great way to minimize the risk involved by time-series forecasting driven decisions. So i hope you find an use to it.
Thanks for reading !
Normalized Accumulation/Distribution OscillatorThis is the oscillator version of the Accumulation/Distribution volume indicator. The oscillator is normalized by n-period volume moving sum. The value oscillates between 1 and -1. One way to use this oscillator is to identify the divergence between price and oscillator reading in trending market, and to spot potential reversal.

Combo Strategies 123 Reversal and Absolute Price Oscillator This is combo strategies for get
a cumulative signal. Result signal will return 1 if two strategies
is long, -1 if all strategies is short and 0 if signals of strategies is not equal.
First strategy
This System was created from the Book "How I Tripled My Money In The
Futures Market" by Ulf Jensen, Page 183. This is reverse type of strategies.
The strategy buys at market, if close price is higher than the previous close
during 2 days and the meaning of 9-days Stochastic Slow Oscillator is lower than 50.
The strategy sells at market, if close price is lower than the previous close price
during 2 days and the meaning of 9-days Stochastic Fast Oscillator is higher than 50.
Secon strategy
The Absolute Price Oscillator displays the difference between two exponential
moving averages of a security's price and is expressed as an absolute value.
How this indicator works
APO crossing above zero is considered bullish, while crossing below zero is bearish.
A positive indicator value indicates an upward movement, while negative readings
signal a downward trend.
Divergences form when a new high or low in price is not confirmed by the Absolute Price
Oscillator (APO). A bullish divergence forms when price make a lower low, but the APO
forms a higher low. This indicates less downward momentum that could foreshadow a bullish
reversal. A bearish divergence forms when price makes a higher high, but the APO forms a
lower high. This shows less upward momentum that could foreshadow a bearish reversal.
WARNING:
- This script to change bars colors.
