Renko Candles OverlayHello All,
For long time I got many request for Renko Candles and now here it's, Renko Candles Overlay . I tried to make almost everything optional, so you can play with the options as you want.
Let see the options:
Method: the option for brick scaling method: ATR, ATR/2, ATR/4, Percent, Traditional
- ATR Period: period for Average True Range and it's valid if the method is ATR
- ATR/2 Period: period for Average True Range and it's valid if the method is ATR/2
- ATR/4 Period: period for Average True Range and it's valid if the method is ATR/4
- Traditional: User-defined brick size, it's valid if the method is Traditional
- Percent: Percent of Close price, it's valid if the method is Percent
if the method is not Traditional (fixed brick size) then Brick size is calculated/updated when new bricks added. so The box sizes may be different because of the calculation is dynamic.
Levels & Lines for new Bricks: if you enable this option then the script shows the levels for new brick
Change Bar Color: optionally the script changes the bar color by using direction of the bricks
and some other options for coloring.
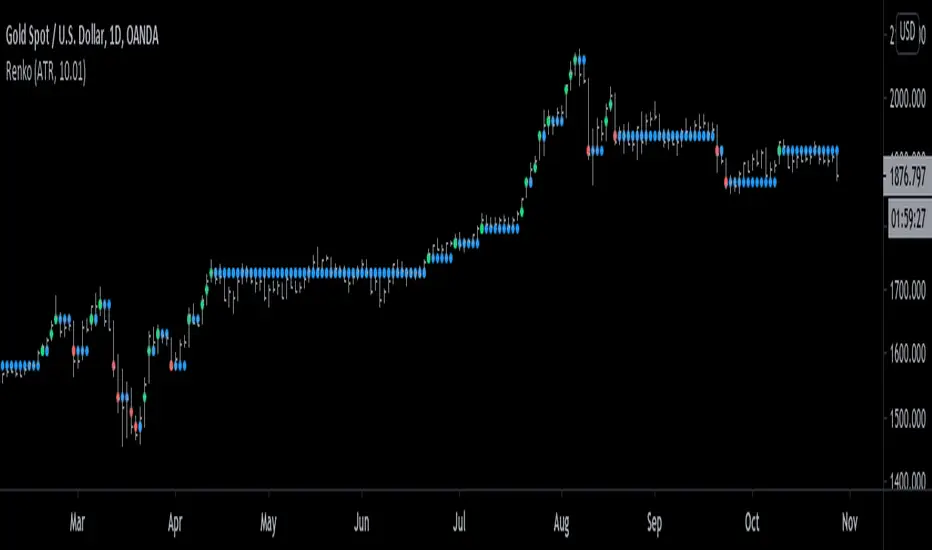
The script shows the bricks for visible area, which is approximately 280 candles. so if you change the width and number of the bricks then number of bricks that is shown is adjusted automatically to fit the screen. you can see the examples below:
The script shows the levels to new brick as a line and label:
Because of real-time bar is not confirmed until the candle close, the script shows the bricks as Unconfirmed , and unconfirmed bricks shown in different color:
You can change the width of the bricks (width is 10 in following example):
Optionally candle colors are changde by the direction of the bricks:
If you have any recommendation then please drop a comment under the script ;)
Enjoy!
Cerca negli script per "renko"

Renko RSIThe goal of this indicator is to plot the RSI values "as if" the chart is a true price action based Renko chart. It can be used on a time series chart or Renko series chart. The RSI is derived from the raw price action of a time-based chart, where the historic and live price is clustered into Renko bricks. The Renko brick production algorithm is entirely backed by Renko Price Bars Overlay and thoroughly tested.
The algorithm takes into account rapid brick production within a single time candle and adjusts accordingly. The output may vary slightly between different chart time frames for the same indicator settings, but this is due to the lack of price fluctuation visibility that can occur in higher chart time frames. If the brick tick size is low, an appropriate chart interval should be selected that maximizes the amount of price volatility visible to the indicator. A bad setting would be something like a 1 tick EURUSD Renko setting on an H4 chart, there simply is no way to derive the exact and ordered price fluctuations in a single H4 candle, 1 pip at a time. A more appropriate chart time frame would be 1-3 minutes for this selected Renko brick size.
Plots user specified RSI based on Renko bricks. This would be the same (or very close to) the RSI viewed on a normal Renko chart based on price action alone.
Works well with Renko Price Bars Overlay script.
See also: Renko Trend Momentum

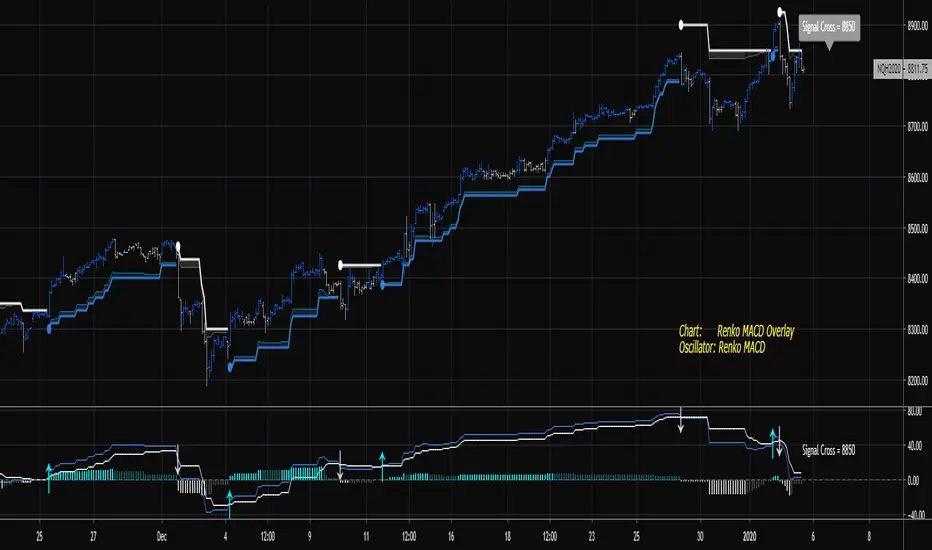
Renko MACDThe goal of this indicator is to plot the MACD, Signal, and Histogram values "as if" the chart is a true price action based Renko chart. It can be used on a time series chart or Renko series chart. The MACD is derived from the raw price action of a time-based chart, where the historic and live price is clustered into Renko bricks. The Renko brick production algorithm is entirely backed by Renko Overlay Ribbon and thoroughly tested.
The algorithm takes into account rapid brick production within a single time candle and adjusts accordingly. The output may vary slightly between different chart time frames for the same indicator settings, but this is due to the lack of price fluctuation visibility that can occur in higher chart time frames. If the brick tick size is low, an appropriate chart interval should be selected that maximizes the amount of price volatility visible to the indicator. A bad setting would be something like a 1 tick EURUSD Renko setting on an H4 or Day chart, there simply is no way to derive the exact and ordered price fluctuations in a single candle, 1 pip at a time. A more appropriate chart time frame would be 1-5 minutes for this selected Renko brick size.
Please find the following video introduction helpful for this indicator and the Renko MACD Trend indicator:
If you are interested in the RSI-RENKO DIVINE Strategy please have a look here:
Contact me in Trading View or telegram for more information and access instructions.
Telegram: t.me
Daily Edge: www.daily-edge.com
Renko Ghost, v. 2.0Renko Ghost
Custom-designed to take advantage of the smoothing signals from Renko charting, Renko Ghost creates client-side ATR calculations to build an overlay of “ghost” Renko blocks which emulate the popular ATR blocks on top of TradingView’s Traditional Renko charts. By combining constant ATR updates with the “trend anticipation” patterning of our other systems, Renko Ghost can deliver more responsive, finely-tuned reads on market turns. (Check out results below) Contact us for a free trial to test Renko Ghost on your go-to charts. And be sure to check out our other dynamic trading systems.
We are always available for questions, comments, and suggestions. There is always room for improvement.
Results Chart
The backtests below show 1-year returns against a Buy and Hold (B+H) approach for 40 of the world’s top traded instruments (as measured by price volume or similar indicator). The Renko Ghost system was run on the top 10 instruments in four major markets: Equities, ETFs, Cryptocurrencies, and Forex. All tests were on a 30min chart, set to Renko “Traditional” blocks (because TradingView does not support realtime alerts from ATR-based charts). Block size was set proportionately to price to give the instrument positive results, but there was no “cherry-picking”. (In fact, changing time frames would have produced even better returns in some cases, but it seemed best to use a consistent measure.) Subscribers to the system receive a full, step-by-step breakdown on how to customize the parameters to get the best from their favorite markets.
(For each instrument, you see listed its Symbol (name), Profit % (annual return using Renko Ghost), Winning Trade % (being “right”), ProfitFactor (Ratio of money won to money lost), Max Draw Down % (point of worst % loss during the year), and B+H (how much the asset would have returned with no trades, via "buy-and-hold" )...)
Renko Ghost
Settings: 30 min, Traditional Renko box, over 1 year (June 1, 2018 - June 1, 2019)
EQUITIES
Symbol,_.,_.Profit %,_.Trade %,_.Pf,_.Max Dr Dn,_.B + H
AMZN,_.,_.,_.1,874,_.,_.62,_.,_.6.3,_.,_.3,_.,_.,_.,_.7
AAPL,_.,_.,_.,_.141,_.,_.48,_.,_.3.4,_.,_.5,_.,_.,_.,_.5
TSLA,_.,_.,_._6,603,_.,_.58,_.,_.5.6,_.,_.6,_.,_.,_.(-38)
FB,_.,_.,_.,_.,_.170,_.,_.48,_.,_.3,_.,_.,_8,_.,_.,_.(-7)
BABA,_.,_.,_.,_.220,_.,_.56,_.,_.3.2,_.,_.9,_.,_.,_.(-23)
BYND,_.,_.,_.,_.305,_.,_.60,_.,_.7.1,_.,_.5,_.,_.,_,_140
MSFT,_.,_.,_.,_.191,_.,_.57,_.,_.6,_.,_.,_3,_.,_.,_.,,_28
AMD,_.,_.,_.,_.,142,_.,_.45,_.,_.2.3,_.,_13,_.,_.,_.,_,0
NFLX_,_.,_.,_.1,902,_.,_.54,_.,_.1.4,_.,_11,_.,_.,_.,(-5)
BA,_.,_.,_.,_.,_.560,_.,_.54,_.,_.4.9,_.,_.3,_.,_.,_.,,_97
ETFs
Symbol,_.Profit %,_.Trade %,_.Pf,_.Max DrDn,_.B + H
SPY,_.,_.,_.724,_.,_.64,_.,_.,_8.3,_.,_.1,_.,_.,_.4
QQQ,_.,_.2,553,_.,_.63,_.,_.,_9.3,_.,_.1,_.,_.,_.5
EEM,_.,_.,_.340,_.,_.52,_.,_.,_5.5,_.,_.2,_.,_.,_.0
IWM,_.,_.,1,801,_.,_.61,_.,_.,_7.7,_.,_.1,_.,_.,(-3)
HYG,_.,_.,_.,17,_.,_.45,_.,_.,_2.5,_.,_.1,_.,_.,,0.5
EWZ,_.,_.4,855,_.,_.59,_.,_.,_9.2,_.,_.2,_.,_.,_.26
LQD,_.,_.,_.,12,_.,_.48,_.,_.,_1.7,_.,_.2,_.,_.,_.6
EFA,_.,_.,_.192,_.,_.52,_.,_.,_4.9,_.,_.2,_.,_.,_(-7)
FXI,_.,_.,_.669,_.,_.55,_.,_.,_6.3,_.,_.,1,_.,_.,(-15)
XLF,_.,_.,_.287,_.,_.55,_.,_.,_4.8,_.,_.,2,_.,_.,(-3)
CRYPTOCURRENCIES
Symbol,_.,_.Profit %,_.Trade %,_.Pf,_.Max DrDn,_.B + H
BTC/USD,_.22 million,_.,_.54,_.,8.1,_.,_3,_.,_.,_.(-8)
ETH/USD,_.15 million,_.,_.50,_.,5.1,_.,_7,_.,_.,_(-54)
XRP/USD,_.26 million,_.,_.49,_.,4.3,_.,_8,_.,_.,_(-21)
LTC/USD,_.785,000,_.,_.,_50,_.,5,_.,_.,12,_.,_.,_.13
BCH/USD,_.756,000,_.,_.,_46,_.,3.6,_.,15,_.,_.,_.(-5)
EOS/USD,_.258,000,_.,_.,_47,_.,3.5,_.,,27,_.,_.,_.13
BNB/USDT,_22 million,_.,_55,_.,7.3,_.,_.8,_.,_.,_143
BSV/USD,_.170,000,_.,_.,_64,.100,_.,_.,,4,_.,_.,_(-8)
XLM/USD,_.15 billion,_.,_.61,_.,7.7,_.,_.5,_.,_.,_.34
ADA/USD,_.136,000,_.,_.,70,_.20,_.,_.,_.2,_.,_.,_.3
FOREX PAIRS
Symbol,_.,_.Profit %,_.Trade %,_.Pf,_.Max Dr Dn,_.B + H
EUR/USD,_.,_.13,_.,_.,_36,_.,_.,1.5,_.,_.,_2,_.,_.,_(-4)
USD/JPY,_.,_.,,5,_.,_.,_31,_.,_.,1.2,_.,_.,_2,_.,_.,_(-1)
AUD/USD,_.,_.26,_.,_.,_44,_.,_.,2,_.,_.,_.,3,_.,_.,_.10
USD/CAD,_.,_.16,_.,_.,_37,_.,_.,1.6,_.,_.,_2,_.,_.,_.,3
GBP/USD,_.,_.37,_.,_.,_37,_.,_.,1.7,_.,_.,_2,_.,_.,_(-5)
NZD/USD,_.,_.24,_.,_.,_50,_.,_.,2,_.,_.,_.,2,_.,_.,_(-6)
GBP/JPY,_.,_.57,_.,_.,_41,_.,_.,1.8,_.,_.,_3,_.,_.,_(-6)
EUR/JPY,_.,_.19,_.,_.,_39,_.,_.,1.4,_.,_.,_4,_.,_.,_(-5)
AUD/JPY,_.,_.50,_.,_.,_36,_.,_.,1.7,_.,_.,_4,_.,_.,(-10)
EUR/GBP,_.,_.13,_.,_.,_41,_.,_.,1.4,_.,_.,_3,_.,_.,_0.1
Renko Weis Wave VolumeA volume bulls vs bears power indicator that is based entirely on Wyckoff Weis Wave Volume trends. This indicator is part of my DIVINE series RENKO indicators that run on an engine capable of extracting Renko brick information from a time series. As with the Renko RSI and Renko Trend Momentum indicators, swapping between Renko and time series type charts(bar, candlestick , heikin ashi) is seamless.
The algorithm uses the cumulative volume sum during the lifetime of a Renko brick formation. It tries hard to dissect and distribute volume when multiple bricks are formed during a single time candle (bar, candlestick , heikin ashi). Both positive and negative volume are plotted simultaneously, so that any instance where multiple bricks are created in a single time candle, positive and negative volume will be shown.
4 color themes as with all of the other DIVINE series indicators and strategies.
Shows ares of accumulation, distribution, capitulation. volatility .
Shows volatile brick locations with counts that indicate the number of nested bricks that were contained in a single time based candle.
Works well with Renko Price Bars Overlay script.
Reference to explanation of volatile brick information tips.
All feature requests are welcome. PM for access.

Renko Simple OverlaySimple Renko Overlay that attempts to deal with the delay present in the Renko function while still using brick size from the Renko function.

Renko CandlesThis is a script to place Renko candles on your chart alongside another candle type or more importantly, using the variables from this script, you can build a strategy using Renko candles that will depict true/proper entries and exits in a strategy when using the backtest feature.
We hope this helps!
Renko Dots [racer8]Description:
The idea behind this indicator is to have the Renko chart alongside with your main chart. What this indicator does is that it plots the values from the Renko Chart directly onto your main chart. So, you don't have to switch between Renko and OHLC charts anymore!
Parameters:
Renko Dots has to 2 parameters: Method & Length.
Method can be either Traditional or ATR. These are 2 different styles of Renko. Personally, I prefer ATR.
Length controls traditional Renko bar's fixed price range or controls the ATR period.
Signal Interpretation:
These Renko values are plotted as "Renko Dots" on your chart. The dots can be either green, red, or blue depending on market movements.
Green - new Renko bar (bullish)
Red - new Renko bar (bearish)
Blue - no new Renko bar (consolidation)
What is a Renko chart?
A Renko chart is a special chart that modifies a regular price chart's information about the close price and transforms it into Renko values that are plotted as Renko boxes on a chart. These boxes typically have a fixed range, say 10 pips for example. So if price moves at least 10 pips, a box is formed. Alternatively, the box's range can be set to the ATR....so in this case, each box represents a move of 1 ATR.
For more information on Renko charts, visit Investopedia.com, here's the link: www.investopedia.com
Renko Dots' advantages over standard Renko chart:
- Can compare & apply it to other price charts (ohlc, candlesticks, line charts)
- Can apply it to other modified price charts (Heikin-Ashi, Renko, Line-Break)
- Can use it to trade alongside with the main chart
- Works across all instruments/markets and all time frames
- Plots consolidation (blue dots) ... (standard Renko doesn't consider time)
Enjoy :)
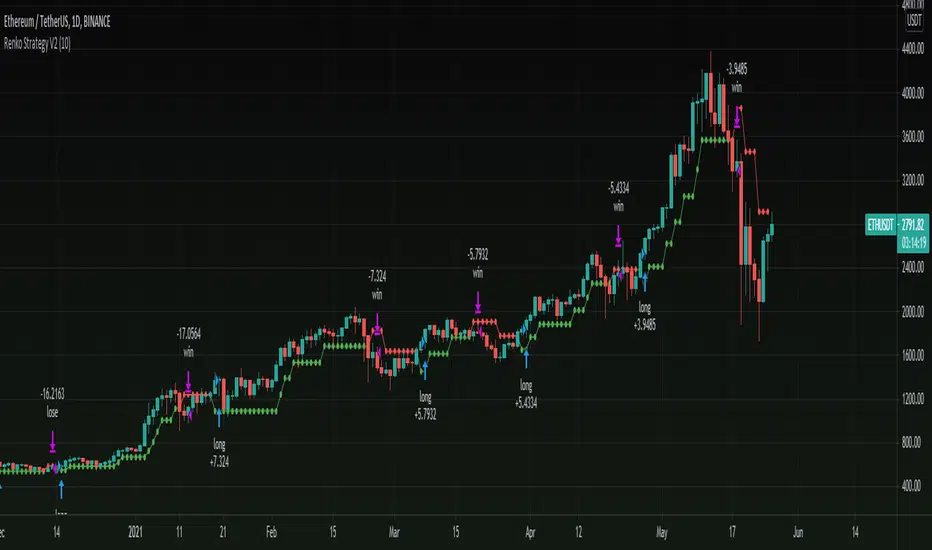
Renko Strategy V2Version 2.0 of my previous renko strategy using Renko calculations, this time without using Tilson T3 and without using security for renko calculations to remove repaint!
Seems to work nicely on cryptocurrencies on higher time frames.
== Description ==
Strategy gets Renko values and uses renko close and open to trigger signals.
Base on these results the strategy triggers a long and short orders, where green is uptrending and red is downtrending.
This Renko version is based on ATR, you can Set ATR (in settings) to adjust it.
== Notes ==
Supports alerts.
Supports backtesting time ranges.
Shorts are disabled by default (can be enabled in settings).
Link to previous Renko strategy V1:
Stay tuned for version V3 in the future as i have an in progress prototype, Follow to get updated:
www.tradingview.com
[RenkoCore] PublicWhen it comes the Renko chart, we all know it has its advantages & disadvantages compared to the candle-stick chart. My aim of this was to alleviate some of the disadvantages by providing some sort of structure on Renko chart. These set of tools may hopefully help your trading journey on Renko chart.
Helpful tips:
a) Enable wicks on your Renko settings, this indicator needs wicks to work.
b) Choose correct size (I recommend traditional size option) for your Renko chart as well as for your instrument.
c) Keep it on 1-second time frame, anything other than that doesn't work on TradingView's Renko. This is important as price will not repaint.
d) If you want to see bigger picture (like 4hr/daily on candle-stick chart), just increase your Renko size, but still keep it on 1-second timeframe.
This toolset includes couple different methods to provide some structures as explained below:
1. 📌 Balance | Price Action Equilibrium Zones
Overview
The Balance is a visual framework designed to evaluate directional bias and internal structure in price action. It measures net bullish/bearish momentum within a configurable rolling window, while highlighting key structural turning points based on multiple custom sensitivity levels. This tool helps traders stay in sync with market rhythm by emphasizing balance, imbalance, and inflection zones.
🔧 How It Works:
Inflection Tiers
Three customizable rounds of pivot-based divergence detection—labeled as 1°, 2°, and 3°—automatically identify regular bullish and regular bearish pivot structures. Though may not be always accurate, these structural signals are intended to keep user's focus to continually reflect emerging internal market shifts.
Balance Limit
Monitors directional bar disparity within a customizable retrospective span. When the net balance exceeds ±50% of the range, the line turns green to suggest strong directional bias. A red fill zone between these thresholds indicates equilibrium or no-trade conditions.
Volatility Based Reversal (Candle Reversal Detector)
This tool scans for extreme price movements relative to local volatility baselines, helping traders detect possible tops and bottoms before major price reversals or pauses. Compares current price action to the lowest recent volatility anchor or if price sharply dips below the highest recent volatility anchor.
🧠 Use Case Recommendations:
Discretionary trading to visually confirm balance and momentum shifts.
Confluence strategies, combining the balance counter with trend indicators or support/resistance levels.
Structure mapping, to highlight exhaustion zones or emerging reversals based on internal divergences.
Avoid using this tool in isolation. It is most effective when combined with broader market context or other confirmation layers.
2. 📌 Primary Level Detection
Overview
This is a precision tool for detecting dynamic price zones where significant market reversals may begin. Using a blend of momentum, price tension, and volatility structure, it identifies potential top and bottom areas — and tracks them with adaptive channel levels that evolve in real time.
🔧 How It Works:
Combines price action, RSI-based bias, and volatility deviation to identify moments when price is overextended.
Reacts only to major changes — reducing false positives in choppy markets.
Levels persist on the chart until a new valid reversal is confirmed, giving you visual structure and actionable areas to work with.
🧠 Use Case Recommendations:
Trading reversals, reversion-to-mean, or liquidity sweeps
Confirming entries from other indicators (like divergence, order blocks, or support/resistance)
Analyzing volatile markets where rapid direction changes are common (e.g., crypto, futures, scalping)
3. 📌 Secondary Level Detection
Overview
This tool highlights where price may be overextended and due for a short-term reversal, based on recent price structure.
🔧 How It Works:
It uses dynamic bar-count and swing conditions to identify potential price turning points after extended directional moves or strong sequence of bars in same direction.
Levels persist on the chart until a new valid reversal is confirmed, giving you visual structure and actionable areas to work with.
🧠 Use Case Recommendations:
Trading reversals, reversion-to-mean, or liquidity sweeps
Confirming entries from other indicators (like divergence, order blocks, or support/resistance)
⚠️ Important Notes:
This indicator does not repaint. All pivots and plots are based on closed candles and verified conditions.
This tool does not provide trade signals. It is a structural analysis tool intended to assist in discretionary decision-making. This indicator is for informational and educational purposes only. Use in combination with your own trading strategy, risk management, and market context. The signals generated do not guarantee outcomes and should not be used in isolation.
It is not intended to be financial advice or a recommendation to buy or sell any security or asset. Trading involves risk. Always do your own research and consult with a licensed financial advisor before making any trading decisions. Past performance is not indicative of future results.
The author is not responsible for any losses incurred from the use of this script.


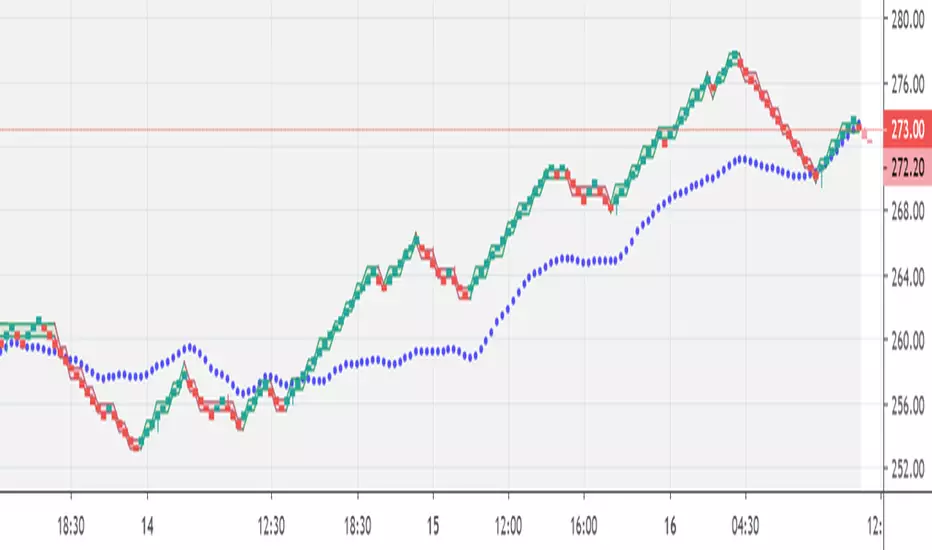
ZTLs Percentage-based Renko EmulatorHere is another version of my Flex Renko script. It is uses percentage-based brick sizes to draw the Renkos instead of ATR or static brick sizes. What makes the percentage-based drawing style great is that one doesn't need to adjust stops so many times like they would with a ATR based Renko. It also makes moving between tickers smooth as well as one doesn't have to adjust the brick-size for each name.
to use: By default the setting is ".001" or 10 basis points. So ".01" is 1 percent or 100 basis points and so-forth. This style is perfect for those traders who make trades on a percentage basis over a price-level basis. It's also good for percentage-based stops.
The yellow lines represent where the price needs to go to draw another Renko brick.
Renko RSIThis is live and non-repainting Renko RSI tool. The tool has it’s own engine and not using integrated function of Trading View.
Renko charts ignore time and focus solely on price changes that meet a minimum requirement. Time is not a factor on Renko chart but as you can see with this script Renko RSI created on time chart.
Renko chart provide several advantages, some of them are filtering insignificant price movements and noise, focusing on important price movements and making support/resistance levels much easier to identify.
As source Closing price or High/Low can be used.
Traditional or ATR can be used for scaling. If ATR is chosen then there is rounding algorithm according to mintick value of the security. For example if mintick value is 0.001 and brick size (ATR/Percentage) is 0.00124 then box size becomes 0.001. And also while using dynamic brick size (ATR), box size changes only when Renko closing price changed.
Renko RSI is calculated by own Renko RSI algorithm.
Alerts added:
Renko RSI moved below Overbought level
Renko RSI moved above Overbought level
Renko RSI moved below Oversold level
Renko RSI moved above Oversold level
RSI length is 2 by default, you can set as you wish.
You better to use this script with the following one:
Enjoy!

Renko ChartHello All. This is live and non-repainting Renko Charting tool. The tool has it’s own engine and not using integrated function of Trading View.
Renko charts ignore time and focus solely on price changes that meet a minimum requirement. Time is not a factor on Renko chart but as you can see with this script Renko chart created on time chart.
Renko chart provide several advantages, some of them are filtering insignificant price movements and noise, focusing on important price movements and making support/resistance levels much easier to identify.
in the script Renko Trend Line with threshold area is included. and also there is protection from whipsaws, so you can catch big waves with very good entry points. Trend line is calculated by EMA of Renko closing price.
As source Closing price or High/Low can be used. Traditional or ATR can be used for scaling. If ATR is chosen then there is rounding algorithm according to mintick value of the security. For example if mintick value is 0.001 and brick size (ATR/Percentage) is 0.00124 then box size becomes 0.001. And also while using dynamic brick size (ATR), box size changes only when Renko closing price changed.
Renko bar can be seen as area or candle and also optionally bar color changes when Renko trend changed.
Soon other Renko scripts (Renko RSI, Renko Weis Wave, Renko MACD etc) are coming ;)
ENJOY!
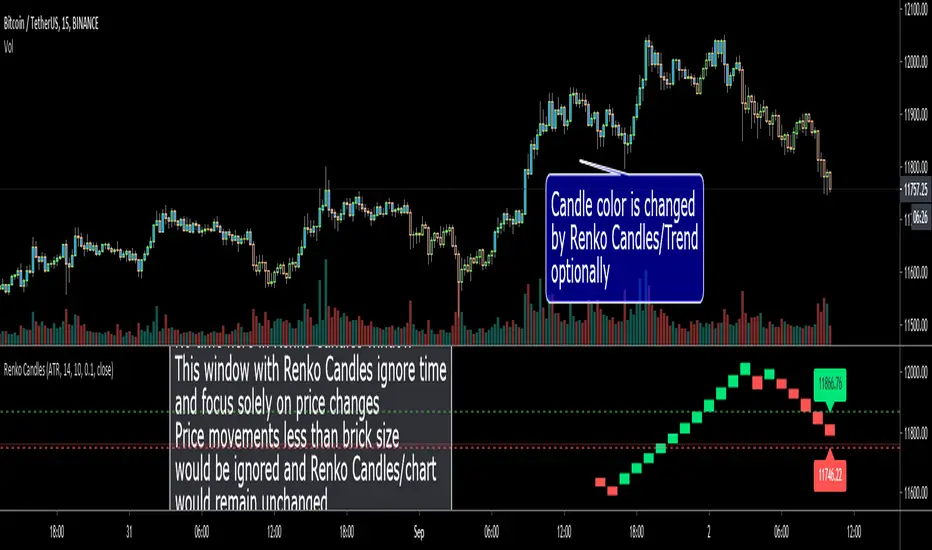
Renko CandlesHello Traders!
This scripts draws Renko Candles in a seperate window dynamically and live. it shows only last 20 Renko candles. there is no time in that window, that means this window with Renko candles ignore time and focus solely on price changes. For Example If the brick value is set at 10 points, a move of 10 points or more is required to draw another brick. Price movements less than 10 points would be ignored and the Renko chart would remain unchanged. If you don't know what Renko Chart/Candle is then you should read some articles about it ;)
"Method" in the option is same as in Renko Chart, two methods: "Traditional" or "ATR ". default value is ATR
if you choose Traditional method then you need to set brick size accordingly. Increasing or decreasing the box size will affect the "smoothness" of the chart.
if you choose ATR mode then brick size will be set by using Average True Range(ATR) indicator
You have option to use Closing Price or High/Low. by default it's "Close"
Optionally it can change candle colors by Renko Bricks/Trend
Optionally it can show the levels for new bricks.
in this example, Mode = Traditional and Brick size: 10
in this example, Mode = Traditional and Brick size: 50
in this example Mode = ATR
Do not forget to click "Donate" button ;)
Enjoy!
Renko Weis Wave VolumeThis is live and non-repainting Renko Weis Wave Volume tool. The tool has it’s own engine and not using integrated function of Trading View.
Renko charts ignore time and focus solely on price changes that meet a minimum requirement. Time is not a factor on Renko chart but as you can see with this script Renko RSI created on time chart.
Renko chart provide several advantages, some of them are filtering insignificant price movements and noise, focusing on important price movements and making support/resistance levels much easier to identify.
As source Closing price or High/Low can be used.
Traditional or ATR can be used for scaling. If ATR is chosen then there is rounding algorithm according to mintick value of the security. For example if mintick value is 0.001 and brick size (ATR/Percentage) is 0.00124 then box size becomes 0.001. And also while using dynamic brick size (ATR), box size changes only when Renko closing price changed.
This tool is based on the Weis Wave described by David H. Weis (a Wyckoff specialist). The Weis Waves Indicator sums up volumes in each wave. This is how we receive a bar chart of cumulative volumes of alternating waves and The cumulative volume makes the Weis wave charts unique.
If there is no volume information for the security then this tool has an option to use “True Range” instead of volume .
Better to use this script with the following one:
Enjoy!

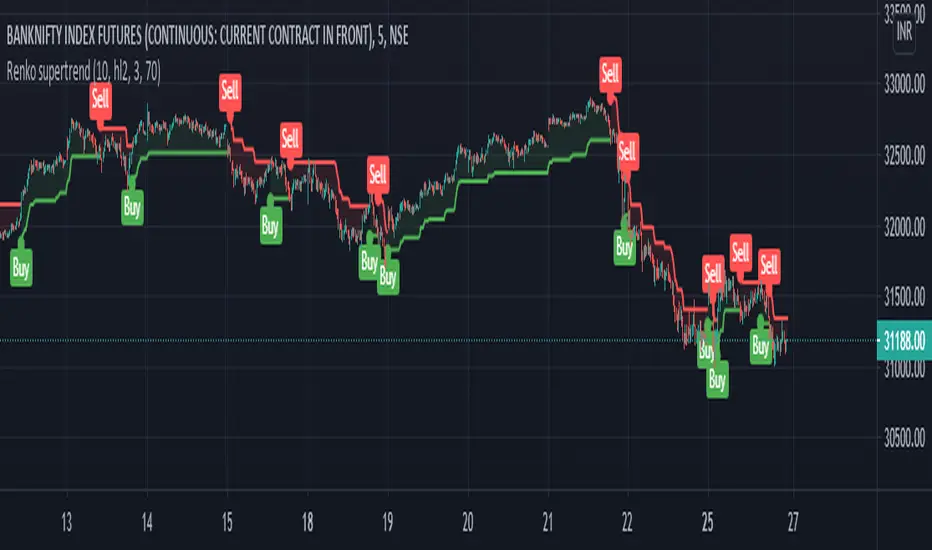
Renko supertrend by Ak
hi friends....publishing Renko supertrend indicator.
Renko charts are a great way to help those who can be spooked by the chaos of the markets (I'm one!), but they have a big drawback in that the price you see on renko chart is often significantly different from the real price that you would trade on. This brings issues of unrealistic expectations of profits/losses, and also makes back testing a strategy very difficult. I still wouldn't recommend ever using TradingView's "strategy" tool when using renko charts, but using this indicator you can do accurate manual back tests.
U have to chose box size..so its not repaint when u refresh chart..bcs on atr based chart its repaint when u refresh chart.
This uses Renko boxes as source on normal chart..don't use it on renko charts
There is an option for use normal japanes candle supertrend..so we can compare how this renko chart prevent false trades.
Renko Price Bars Overlay// Shows the price renko bars (or range bars) instead of the PERIOD renko
// bars that are integrated into Trading View. The normal renko bars that
// Trading View offers only consider the drawing of a new brick when the
// price closes above or below the required brick size. This can produce
// misleading charts since depending on the time interval of a chart, new
// bricks may or may not be drawn. True price renko bars will draw a new
// brick immediately upon the price exceeding the next target brick size.
// When running this script in "Traditional" mode, the painting of the
// brick overlay band is INDEPENDENT of the chart interval. If price
// exceeds the required target price for the next brick, the band is
// updated immediately, instead of waiting for the price bar on the chart
// interval to close first. The brick starting anchor point will attempt
// to be a "nice number" at a round interval for the chart ticker. For
// example, if viewing EURUSD with the box size equal to 50 ticks/pips,
// the open and close prices will take the form of 1.2100, 1.2150, 1.2200,
// 1.2250, and so on. This is the same behavior as the normal traditional
// Renko bars in Trading View and other major trading platforms such as
// Meta Trader.
// Use the tick size in traditional mode to specify the block size, in
// ticks. This may give interesting results in FOREX pairs... as the tick
// size in Trading View may be 0.00001 instead of the normal pip size of
// 0.0001, so a 10 pip block size may be '100', and not the expected '10'.
// FOREX futures should work in the manner expected, a 10 pip block size
// will indeed equal 0.0010.
// The "ATR" mode functions differently than the Trading View built in
// version. The block size is updated each time the range is exceeded.
// In Trading View, when using the ATR mode, the ATR is the last ATR
// value calculated on the ENTIRE data interval, and is applied to all
// past data. You can see this when you press the '+' sign of the ticker
// in the top left of the chart window and you will see the brick size
// as a constant, the brick size is not a function of the ever changing
// ATR value of the price action. The block size of this script is not
// updated for each price candle (i.e. each 1HR on a 1HR chart), instead
// it is updated only when the price thresholds are exceeded requiring a
// the band to be updated. At that point the current ATR is considered
// and the brick size is updated.
// Options exist to show the current high and low of the brick, and to
// show the required levels that the price must exceed to draw a new
// brick and update the band.
Please leave comments if you notice any bugs or would like any new features added. I don't find much use for plotting the H/L of the current renko candle, but I have seen some request it in the past.
Cheers.

[ssabu] Renko Chart✅ Renko Chart Indicator
실시간으로 캔들 차트를 렌코차트로 바꿔서 배경에 렌코차트를 자동으로 그려주는 인디케이터 입니다.
It is an indicator that automatically draws a Renko chart in the background by changing the candle chart to a Renko chart in real time.
위의 사진은 캔들차트를 렌코로 바꾸고 해당 인디케이터를 적용한 스크린샷
Above picture is a screenshot of changing the candle chart to Renko and applying the indicator

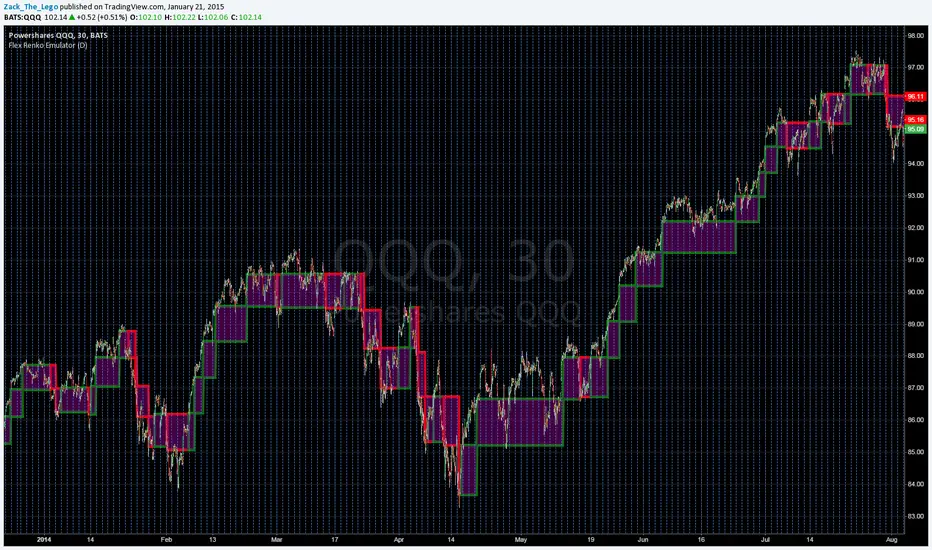
Flex Renko Emulatorupdate:
As far as my algorithm design will take me this is it. So It's complete in my eyes. Here is a "working" version of something I've been looking for for a long time: "Flex" Renko Charting.
Bricks' sizes are determined by ATR and are set by simply choosing a resolution for the ATR calculation. No need to go in and choose renko granulation(resolution) AND brick size. Renko granulation is current chart resolution. Feel free to send me feedback on how to manage the reversal bricks' calculation or any other thoughts and ideas.
Replace the "close" in the main body of the renko calculation with 'high' and 'low' to get more consistent paintings across different aggregations since renkos aren't technically based off closing prices but where the price has been. Of course it's all a matter of preference:
Brick1 = high >
nz(Brick1) + BrickSize ? nz(Brick1) + BrickSize : low <
nz(Brick1) - BrickSize ?
nz(Brick1) - BrickSize
: nz(Brick1)
Renko Chart Alerts with PivotsAdd alerts to renko charts to be notified when:
new brick
brick up
brick down
direction change
direction change up
direction change down
Also shows pivots based on brick reversals. Alerts also available for:
pivot breakout
pivot high breakout
pivot low breakout
You can hide the plots for pivot high/low and breakouts in the style tab of the settings for the indicator.
To add the alerts:
add the indicator to your renko chart
click add alert
click the condition dropdown and choose Renko Alerts
you should see all the alerts there and you can add any one or more to your chart

Renko - RSI MomentumIn essence this Renko trading system is the following:
1. Momentum based entries
2. Trend trading system (small losses, big wins)
3. As well as a trend continuation system
------------------------------
!IMPORTANT!
------------------------------
- You MUST have a Pro+ account. Why? Cause Renko NEEDS to run on 1min or 5min chart, nothing larger.
If you don't, the chart will repaint .
------------------------------
CHART SETUP
------------------------------
1. Set chart to Renko
2. Set period of chart to 1 min (or 5 min)
3. Set Renko box size method to "Traditional"
4. Set Renko box size to:
- JPY Pairs: 0.2 to 0.4
- Other Major/Minors: 0.002 - 0.004
- Exotic pairs: NO IDEA... (I haven't tested them yet)
5. Load the indicator
------------------------------
RULES
------------------------------
Trend Entry
An arrow will appear the following conditions are met:
LONG: RSI(7) goes above 55 AND price is above the 50 SMA
SHORT: RSI(7) goes below 45 AND price is below the 50 SMA
Enter immediately after the bar is printed.
Counter Trend Entry
An orange dot appears when the following conditions are met:
LONG: RSI(7) goes above 55 AND price is below the 50 SMA and above the 10 EMA
SHORT: RSI(7) goes below 45 AND price is above the 50 SMA and below the 10 EMA
I would not suggest entering immediately but rather finding a trendline or support/resistance that is being broken.
Exit
- Exit when a white bar is printed
- OR use your own discretion. Like 2 bars in opposite direction or on EMA cross or hit of support/resistance.
------------------------------
CHART
------------------------------
- Green bars are when the RSI(7) is above 55.
- Red bars are when the RSI(7) is below 45.
- White bars are when the RSI(7) is between 45and 55.
------------------------------

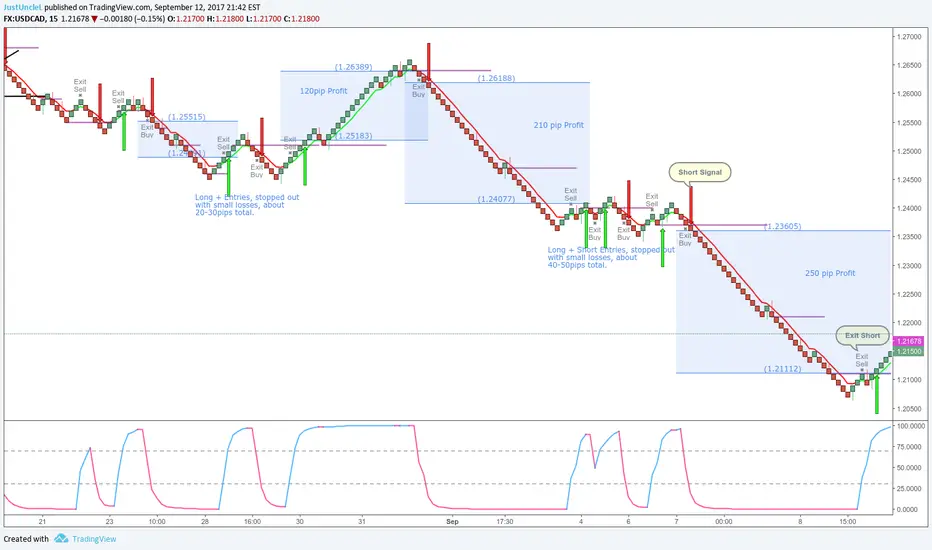
Renko+Moving Average+RMI Alert R3 by JustUncleLThis script idea is designed to be used with 10pip brick (recommended) Renko charts. It combines the Renko price action with a directional coloured EMA (default length 6) and a RMI (instead of the usual RSI) indicator to provide entry and exit signals. RMI is bit like RSI with a built-in momentum factor and works well with Renko.
Signals can optionally be filtered by Daily or Weekly Open, where by only trade long above open and short below open (this option is enabled by default). Exit occur when EMA or RMI reverses direction, or optionally (disabled by default) when the Renko prints a brick in the reverse direction. Each Entry and Exit signal creates an Alertcondition that can be picked up by the TradingView Alarm system.
TIP: To get 10pip Bricks set Renko to "Traditional" type bricks and 0.001 for non-JPY currency pairs, and 0.1 for JPY currency pairs. Also set chart Time frame to 5min or 15mins.
References:
TheLark Relative Momentum Index (RMI)