Weird Renko StratThis strategy uses Renko, it generates a signal when there is a reversal in Renko. When using historical data, it provides a good entry and an okay exit. However, in a real-time environment, this strategy is subject to repaint and may produce a false signal.
As a result, the backtesting result should not be used as a metric to predict future results. It is highly recommended to forward-test the strategy before using it in real trading. I forward test it from 12/18/2022 to 12/21/2022 in paper trading, using the alert feature in Tradingview. I made 60 trades trading the BTCUSDT BINANCE 3 min with 26 as the param and under the condition that I use 20x margin, compounding my yield, and having 0 trading fee, a steady loss is generated: from $10 to $3.02.
This is quite interesting. As if I flip the signal from "Long" to "Short" and another way too, it will be a steady profit from $10 to $21.85. Hence, if I'm trying to anti-trade the real-time alert signal, the current "4 Days Result" will be good. Nevertheless, I still have to forward-test it for longer to see if it will fail eventually.
Dive into the setting of the strategy
- Margin is the leverage you use. 1 means 1x, 10 means 10x. It affects the backtest yield when you backtest
- Compound Yield button is for compound calculation, disable it to go back to normal backtesting
- Anti Strategy button is to do the opposite direction trade, when the original strat told you to "Long", you "Short" instead. Enable it to use the feature
- Param is the block size for the Renko chart
- Drawdown is just a visual tool for you in case you want to place a stop loss (represent by the semitransparent red area in the chart)
- From date Thru Date is to specify the backtest range of the strategy, This feature is turned off by default. It is controlled by the Max Backtest Timeframe which will be explain below
- Max Backtest Timeframe control the From date Thru Date function, disable it to enable the From Date Thru Date function
Param is the most important input in this strategy as it directly affects performance. It is highly recommended to backtest nearly all the possible parameters before deploying it in real trading. Some factors should be considered:
- Price of the asset (like an asset of 1 USD vs an asset of 10000 USD required different param)
- Timeframe (1-minute param is different than 1-month param)
I believe this is caused by the volatility of the selected timeframe since different timeframe has different volatility. Param should be fine-tuned before usage.
Here is the param I'm using:
BTCUSDT BINANCE 3min: 26
BTCUSDT BINANCE 5min: 28
BTCUSDT BINANCE 1day: 15
Background of the strategy:
- The strategy starts with $10 at the start of backtesting (customizable in setting)
- The trading fee is set to 0.00% which is not common for most of the popular exchanges (customizable in setting)
- The contract size is not a fixed amount, but it uses your balance to buy it at the open price. If you are using the compound mode, your balance will be your current total balance. If you are using the non-compound mode, it will just use the $10 you start with unless you change the amount you start with. If you are using a margin higher than 1, it will calculate the corresponding contract size properly based on your margin. (Only these options are allowed, you are not able to change them without changing the code)
Cerca negli script per "renko"

ST15 CM inspired 4hr renko Pivots
Standard pivot points do not work with ATR Renko charts, but I really enjoy using pivot points to find strong s/r, so I started to look at scripts that could provide the same results as floor trader pivots but on a renko chart. I found a script written by CM that I was able to tweak a little and I got it work with ATR renkos. The only issue now is he only wrote the script to look for 1hr pivot points so I am now in the process off writing versions that can do the 240 1d 1w and 1m pivot points as well. Here is the 4hr :) enjoy! Thank you CM :)
Brick IndicatorBrick Indicator :-
A wonderful book written by "Prashant Shah" named "The profitable trading with renko chart" has been mentioned many technical indicator in this book. But today we are going to tell about an indicator who does a lot of amazing work inside the Renko chart. The Indicator name is "Brick Indicator" works on very simple calculations. Inside it, it is seen how much Brick Bullish was and how Brick was Bearish. Which shows whether the trend is upwards or downwards. At the same time, inside it we use the line of EMA. So that we can catch the trend quickly.
Brick Line Formula: - Numbers of periods bullish candles - Numbers of periods bearish candles
With this line, we put the line of EMA, so that the signals of the market get even better.

MATRIX Rises on the wavesJust one more go at a zigzag , this time with the aid of renko emulator.
Apenas mais uma vez em zigue-zague, desta vez com a ajuda do emulador renko.
Surfe nas ondas do MATRIX

Alnami_Quantum_blocksThis is the revolution of renko... it is renko chart based on percentage movement of the underlying ..
User can set:
1- the % move that if exceeded, the channel will shift
2- entry strategy
3- exit strategy

A&M_blocks v.2This is re production of Renko chart.
It draws lines that shows the location of the current box boundaries...using percentage instead of fixed box size or average true range.
Alex: ConsUD Alert indicatorCustom strategy that was developed for a Backtest-Rookies development service customer. Published for verification, testing and acceptance.
If you are interested in development services send me a message or visit the backtest-rookies (.com) webiste for more information
Consecutive Up/Down Days - Custom Indicator
The indicator builds upon the built-in consecutive up/down days strategy script but with some additional features:
The strategy has been converted to an indicator
Alerts have been added for entries
Position Simulation: Entry signals only happen once per long / short direction.
Plot real high / low candle data (the script is assumed to run on Renko candles)
Plot real simulated entry price at the open of the bar following an entry signal
Plot an EMA

Swing Wave Helper by 2tmHello Everyone.
I'd inspired from Renko Chart and make to find Waves.
As you know guys, the candle make Waves and the node of Waves make 3 Points.
With those 3 Points we can find where these candle go. Up? or Down.
With This script you can find easily those 3 Points easily.
Thank you and have a nice day.

AOAHey Fam,
Welcome to the AOA.
It's my Awesome Oscillator I use every day in conjunction with Renko. Very powerful for spotting divergences and provides great confluence for level to level traders. Can also be used on a candle chart for trend confirmation.
Also includes the labels for divergences, toggleable inside the settings box when applied to your chart. (They're disabled on my chart)
Alerts include:
1. AO Bear Div
2. AO Bull Div
3. AO Crossing Down 0
4. AO Crossng Up 0
5. AO Two Tick Bear
6. AO Two Tick Bull
** Two tick is a great confirmation signal. **
Enjoy!

Realtime RenkoI've been working on real-time renko for a while as a coding challenge. The interesting problem here is building renko bricks that form based on incoming tick data rather than waiting for bar closes. Every tick that comes through gets processed immediately, and when price moves enough to complete a brick, that brick closes and a new one opens right then. It's just neat because you can run it and it updates as you'd expect with renko, forming bricks based purely on price movement happening in real time rather than waiting for arbitrary time intervals to pass.
The three brick sizing methods give you flexibility in how you define "enough movement" to form a new brick. Traditional renko uses a fixed price range, so if you set it to 10 ticks, every brick represents exactly 10 ticks of movement. This works well for instruments with stable tick sizes and predictable volatility. ATR-based sizing calculates the average true range once at startup using a weighted average across all historical bars, then divides that by your brick value input. If you want bricks that are one full ATR in size, you'd use a brick value of 1. If you want half-ATR bricks, use 2. This inverted relationship exists because the calculation is ATR divided by your input, which lets you work with multiples and fractions intuitively. Percentage-based sizing makes each brick a fixed percentage move from the previous brick's close, which automatically scales with price level and works well for instruments that move proportionally rather than in absolute tick increments.
The best part about this implementation is how it uses varip for state management. When you first load the indicator, there's no history at all. Everything starts fresh from the moment you add it to your chart because varip variables only exist in real-time. This means you're watching actual renko bricks form from real tick data as it arrives. The indicator builds its own internal history as it runs, storing up to 250 completed bricks in memory, but that history only exists for the current session. Refresh the page or reload the indicator and it starts over from scratch.
The visual implementation uses boxes for brick bodies and lines for wicks, drawn at offset bar indices to create the appearance of a continuous renko chart in the indicator pane. Each brick occupies two bar index positions horizontally, which spaces them out and makes the chart readable. The current brick updates in real time as new ticks arrive, with its high, low, and close values adjusting continuously until it reaches the threshold to close and become finalized. Once a brick closes, it gets pushed into the history array and a new brick opens at the closing level of the previous one.
What makes this especially useful for debugging and analysis are the hover tooltips on each brick. Clicking on any brick brings up information showing when it opened with millisecond precision, how long it took to form from open to close, its internal bar index within the renko sequence, and the brick size being used. That time delta measurement is particularly valuable because it reveals the pace of price movement. A brick that forms in five seconds indicates very different market conditions than one that takes three minutes, even though both bricks represent the same amount of price movement. You can spot acceleration and deceleration in trend development by watching how quickly consecutive bricks form.
The pine logs that generate when bricks close serve as breadcrumbs back to the main chart. Every time a brick finalizes, the indicator writes a log entry with the same information shown in the tooltip. You can click that log entry and TradingView jumps your main chart to the exact timestamp when that brick closed. This lets you correlate renko brick formation with what was happening on the time-based chart, which is critical for understanding context. A brick that closed during a major news announcement or at a key support level tells a different story than one that closed during quiet drift, and the logs make it trivial to investigate those situations.
The internal bar indexing system maintains a separate count from the chart's bar_index, giving each renko brick its own sequential number starting from when the indicator begins running. This makes it easy to reference specific bricks in your analysis or when discussing patterns with others. The internal index increments only when a brick closes, so it's a pure measure of how many bricks have formed regardless of how much chart time has passed. You can match these indices between the visual bricks and the log entries, which helps when you're trying to track down the details of a specific brick that caught your attention.
Brick overshoot handling ensures that when price blows through the threshold level instead of just barely touching it, the brick closes at the threshold and the excess movement carries over to the next brick. This prevents gaps in the renko sequence and maintains the integrity of the brick sizing. If price shoots up through your bullish threshold and keeps going, the current brick closes at exactly the threshold level and the new brick opens there with the overshoot already baked into its initial high. Without this logic, you'd get renko bricks with irregular sizes whenever price moved aggressively, which would undermine the whole point of using fixed-range bricks.
The timezone setting lets you adjust timestamps to your local time or whatever reference you prefer, which matters when you're analyzing logs or comparing brick formation times across different sessions. The time delta formatter converts raw milliseconds into human-readable strings showing days, hours, minutes, and seconds with fractional precision. This makes it immediately clear whether a brick took 12.3 seconds or 2 minutes and 15 seconds to form, without having to parse millisecond values mentally.
This is the script version that will eventually be integrated into my real-time candles library. The library version had an issue with tooltips not displaying correctly, which this implementation fixes by using a different approach to label creation and positioning. Running it as a standalone indicator also gives you more control over the visual settings and makes it easier to experiment with different brick sizing methods without affecting other tools that might be using the library version.
What this really demonstrates is that real-time indicators in Pine Script require thinking about state management and tick processing differently than historical indicators. Most indicator code assumes bars are immutable once closed, so you can reference `close ` and know that value will never change. Real-time renko throws that assumption out because the current brick is constantly mutating with every tick until it closes. Using varip for state variables and carefully tracking what belongs to finalized bricks versus the developing brick makes it possible to maintain consistency while still updating smoothly in real-time. The fact that there's no historical reconstruction and everything starts fresh when you load it is actually a feature, not a limitation, because you're seeing genuine real-time brick formation rather than some approximation of what might have happened in the past.

MestreDoFOMO MACD VisualMasterDoFOMO MACD Visual
Description
MasterDoFOMO MACD Visual is a custom indicator that combines a unique approach to MACD with stochastic logic and simulated Renko-based direction signals. It is designed to help traders identify entry and exit opportunities based on market momentum and trend changes, with a clear and intuitive visualization.
How It Works
Stylized MACD with Stochastic: The indicator calculates the MACD using EMAs (exponential moving averages) normalized by stochastic logic. This is done by subtracting the lowest price (lowest low) from a defined period and dividing by the range between the highest and lowest price (highest high - lowest low). The result is a MACD that is more sensitive to market conditions, magnified by a factor of 10 for better visualization.
Signal Line: An EMA of the MACD is plotted as a signal line, allowing you to identify crossovers that indicate potential trend reversals or continuations.
Histogram: The difference between the MACD and the signal line is displayed as a histogram, with distinct colors (fuchsia for positive, purple for negative) to make momentum easier to read.
Simulated Renko Direction: Uses ATR (Average True Range) to calculate the size of Renko "bricks", generating signals of change in direction (bullish or bearish). These signals are displayed as arrows on the chart, helping to identify trend reversals.
Purpose
The indicator combines the sensitivity of the Stochastic MACD with the robustness of Renko signals to provide a versatile tool. It is ideal for traders looking to capture momentum-based market movements (using the MACD and histogram) while confirming trend changes with Renko signals. This combination reduces false signals and improves accuracy in volatile markets.
Settings
Stochastic Period (45): Sets the period for calculating the Stochastic range (highest high - lowest low).
Fast EMA Period (12): Period of the fast EMA used in the MACD.
Slow EMA Period (26): Period of the slow EMA used in the MACD.
Signal Line Period (9): Period of the EMA of the signal line.
Overbought/Oversold Levels (1.0/-1.0): Thresholds for identifying extreme conditions in the MACD.
ATR Period (14): Period for calculating the Renko brick size.
ATR Multiplier (1.0): Adjusts the Renko brick size.
Show Histogram: Enables/disables the histogram.
Show Renko Markers: Enables/disables the Renko direction arrows.
How to Use
MACD Crossovers: A MACD crossover above the signal line indicates potential bullishness, while below suggests bearishness.
Histogram: Fuchsia bars indicate bullish momentum; purple bars indicate bearish momentum.
Renko Arrows: Green arrows (upward triangle) signal a change to an uptrend; red arrows (downward triangle) signal a downtrend.
Overbought/Oversold Levels: Use the levels to identify potential reversals when the MACD reaches extreme values.
Notes
The chart should be set up with this indicator in isolation for better clarity.
Adjust the periods and ATR multiplier according to the asset and timeframe used.
Use the built-in alerts ("Renko Up Signal" and "Renko Down Signal") to set up notifications of direction changes.
This indicator is ideal for day traders and swing traders who want a visually clear and functional tool for trading based on momentum and trends.

[astropark] MFI divergencesDear Followers,
today a new great Scalper Tool , based on a custom version of Money Flow (MFI) oscillator, which works on both Candlesticks, Heiking Ashi and Renko charts , from 1 second Renko chart and above (on non Renko charts, the higher, the better of course!), both on FOREX, Cryptocurrencies, Stocks and Commodities!
This tool has some cool features:
it works on all timeframes , on both Renko, Heikin Ashi and Candlesticks chart
it shows you both bullish and bearish divergences with a triangle up or down respectively
when it finds a strong bullish/bearish divergence , a flag will be displayed instead of a triangle
it shows you both hidden bullish and bearish divergences with a label "hid"
This script will let you set all notifications you may need in order to be alerted on each triggered divergence.
You may like to use it together with my Renko OBV Divergences indicator (which works on Candlesticks and Heiking Ashi too)
and my Renko RSI Divergences indicator (which works on Candlesticks and Heiking Ashi too)
On Bitmex/ByBit/Binance Bitcoin/USD chart best Renko settings is Traditional Renko chart with 11$ box size, while 0.5$ box size is suggested on Ethereum/USD pair.
This is a premium indicator , so send me a private message in order to get access to this script.
[Autoview][BackTest]Dual MA Ribbons R0.12 by JustUncleLThis is an implementation of a strategy based on two MA Ribbons, a Fast Ribbon and a Slow Ribbon. This strategy can be used on Normal candlestick charts or Renko charts (if you are familiar with them).
The strategy revolves around a pair of scripts: One to generate alerts signals for Autoview and one for Backtesting, to tune your settings.
The risk management options are performed within the script to set SL(StopLoss), TP(TargetProfit), TSL(Trailing Stop Loss) and TTP (Trailing Target Profit). The only requirement for Autoview is to Buy and Sell as directed by this script, no complicated syntax is required.
The Dual Ribbons are designed to capture the inferred behavior of traders and investors by using two groups of averages:
> Traders MA Ribbon: Lower MA and Upper MA (Aqua=Uptrend, Blue=downtrend, Gray=Neutral), with center line Avg MA (Orange dotted line).
> Investors MAs Ribbon: Lower MA and Upper MA (Green=Uptrend, Red=downtrend, Gray=Neutral), with center line Avg MA (Fuchsia dotted line).
> Anchor time frame (0=current). This is the time frame that the MAs are calculated for. This way 60m MA Ribbons can be viewed on a 15 min chart to establish tighter Stop Loss conditions.
Trade Management options:
Option to specify Backtest start and end time.
Trailing Stop, with Activate Level (as % of price) and Trailing Stop (as % of price)
Target Profit Level, (as % of price)
Stop Loss Level, (as % of price)
BUY green triangles and SELL dark red triangles
Trade Order closed colour coded Label:
>> Dark Red = Stop Loss Hit
>> Green = Target Profit Hit
>> Purple = Trailing Stop Hit
>> Orange = Opposite (Sell) Order Close
Trade Management Indication:
Trailing Stop Activate Price = Blue dotted line
Trailing Stop Price = Fuschia solid stepping line
Target Profit Price = Lime '+' line
Stop Loss Price = Red '+' line
Dealing With Renko Charts:
If you choose to use Renko charts, make sure you have enabled the "IS This a RENKO Chart" option, (I have not so far found a way to Detect the type of chart that is running).
If you want non-repainting Renko charts you MUST use TRADITIONAL Renko Bricks. This type of brick is fixed and will not change size.
Also use Renko bricks with WICKS DISABLED. Wicks are not part of Renko, the whole idea of using Renko bricks is not to see the wick noise.
Set you chart Time Frame to the lowest possible one that will build enough bricks to give a reasonable history, start at 1min TimeFrame. Renko bricks are not dependent on time, they represent a movement in price. But the chart candlestick data is used to create the bricks, so lower TF gives more accurate Brick creation.
You want to size your bricks to 2/1000 of the pair price, so for ETHBTC the price is say 0.0805 then your Renko Brick size should be about 2*0.0805/1000 = 0.0002 (round up).
You may find there is some slippage in value, but this can be accounted for in the Backtest by setting your commission a bit higher, for Binance for example I use 0.2%
Special thanks goes to @CryptoRox for providing the initial Risk management Framework in his "How to automate this strategy for free using a chrome extension" example.

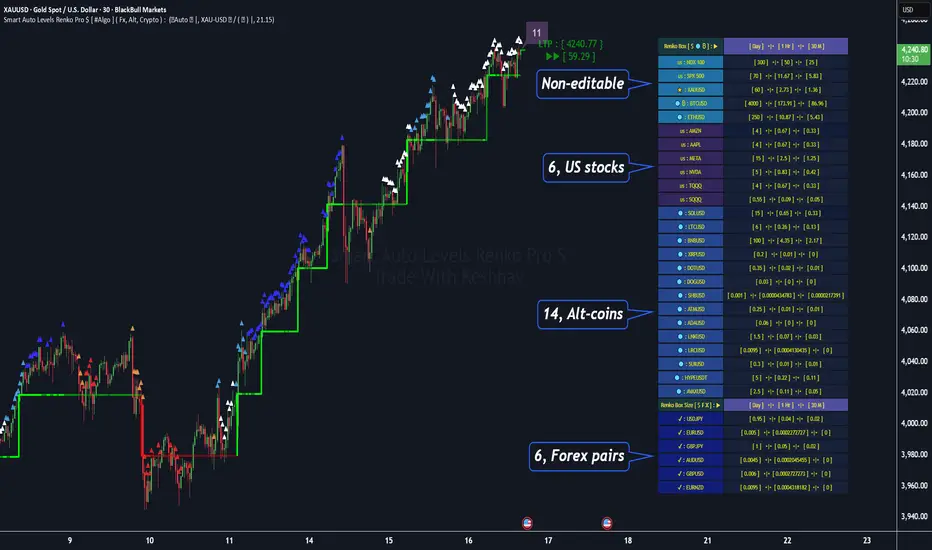
Smart Auto Levels Renko Pro $ [ #Algo ] ( Fx, Alt, Crypto ) : Smart Levels is Smart Trades 🏆
"Smart Auto Levels Renko Pro $ ( Fx, Alt, Crypto ) " indicator is specially designed for " Crypto, Altcoins, Forex pairs, and US exchange" . It gives more power to day traders, pull-back / reverse trend traders / scalpers & trend analysts. This indicator plots the key smart levels , which will be automatically drawn at the session's start or during the session, if specific input is selected.
🔶 Usage and Settings :
A :
⇓ ( *refer 📷 image ) ⇓
B :
⇓ ( *refer 📷 images ) ⇓
🔷 Features :
a : automated smart levels with #algo compatibility.
b : plots Trend strength ▲, and current candle strength count value label.
c : ▄▀ RENKO Emulator engine ( plots *Non-repaintable #renko data as a line chart over the standard chart).
d : session 1st candle's High, Low & 50% levels ( irrespective of chart time-frame ).
e : 1-hour High & Low levels of specific candle ( from the drop-down menu ), for any global
market crypto / altcoins / forex or USA exchange symbols.
f : previous Day / Week / Month, chart High & Low.
g : pivot point levels of the Daily, Weekly & Monthly charts.
h : 2 class types of ⏰ alerts ( only signals or #algo execution ).
i : auto RENKO box size (ATR-based) table for 31 symbols (5 Default non-editable symbols,
6 US exchange symbols, 14 Alt-coins, 6 Forex pairs.)
j : auto processes " daylight saving time 🌓" data and plots accordingly.
💠Note: "For key smart levels, it processes data from a customized time frame, which is not available for the *free Trading View subscription users , and requires a premium plan." By this indicator, you have an edge over the paid subscription plan users and can automatically plot the Non-repaintable RENKO emulator for the current chart on the Trading View free Plan for any time-frame ."
⬇ Take a deep dive 👁️🗨️ into the Smart levels trading Basic Demonstration ⬇
▄▀ 1: "RENKO Emulator Engine" ⭐ , plots a noiseless chart for easy Top/Bottom set-up analysis. 11 types of 💼 asset classes options available in the drop-down menu.
LTP is tagged to the current RSI value ➕ volatility color change for instant quick decisions.
⇓ ( *refer 📷 image ) ⇓
🟣 2: "Trend Strength ▲ Label with color condition.
The strength of the trend will be shown as a number label ( for the current candle ), and the ▲ color format represents the strength of the trend. Can be utilized as an Entry or Exit condition.
⇓ ( *refer 📷 image ) ⇓
🟠 3: plots "Session first candle High, low, and 50%" levels ( irrespective of chart time-frame ), which are critical levels for an intraday trader with add-on levels of Previous Day, Week & Month High and Low levels.
⇓ ( *refer 📷 image ) ⇓
🔵 4: plots "Hourly chart candle" High & Low levels for the specific candles, selected from the drop-down menu with Pivot Points levels of Daily, Weekly, Monthly chart.
⇓ ( *refer 📷 image ) ⇓
🔲 5: "Auto RENKO box size" ( ATR based ) : This indicator is specially designed for 'Renko' trading enthusiasts, where the Box size of the ' Renko chart ' for intraday or swing trading ( ATR based ) , automatically calculated for the selected ( editable ) symbols in the table.
⇓ ( *refer 📷 image ) ⇓
*NOTE :
Table symbols (Non-editable) for 2 USA index, XAU, BTC, ETH.
Symbols (editable) for USA index/stocks.
Table Symbols (editable) for alt-coins.
Table Symbols (editable) for Forex pairs.
⏰ 6: "Alert functions."
⇓ ( *refer 📷 image ) ⇓
◻ : Total 7 signal alerts can be possible in a Single alert.
◻ : Total 10 #algo alerts , ( must ✔ tick the Consent check box for algo execution ).
Note: : alert with RSI ( *manual ✍ input value ) condition.
After selecting alert/alerts ( signals 7 / #algo 10 ), an additional RSI condition can also be used as an input to trigger the alert.
ex: alert = { 🟠 𝟭 Hr 🕯 H & L ➕ ✅ RSI✍ } condition, will trigger the alert when both conditions meet simultaneously.
This Indicator will work like a Trading System . It is different from other indicators, which give Signals only. This script is designed to be tailored to your personal trading style by combining user input components to create your own comprehensive strategy . The synergy between the components is key to its usefulness.
🚀 It focuses on the key Smart Levels and gives you an Extra edge over others.
✅ HOW TO GET ACCESS :
You can see the Author's instructions below to get instant access to this indicator & our premium indicator suites. If you like any of my Invite-Only indicators, kindly DM and let me know!
⚠ RISK DISCLAIMER :
All content provided by "@TradeWithKeshhav" is for informational & educational purposes only.
It does not constitute any financial advice or a solicitation to buy or sell any securities of any type. All investments / trading involve risks. Past performance does not guarantee future results / returns.
Regards :
Team @TradeWithKeshhav
Happy trading and investing!
HA-Renko HybridHA-Renko Hybrid – Ultra-Clean Trend Candles
A two-stage “noise shredder” that fuses Renko bricks with Heikin-Ashi smoothing to give you
crystal-clear, colour-coded price swings.
Perfect as a directional filter, a confidence gauge, or even a full stand-alone chart type.
What It Does
Builds Renko bricks (ATR-adaptive, fixed points, or % of price).
Applies Heikin-Ashi maths to the brick series or vice-versa (your choice).
Optional EMA ribbon on the synthetic candles for an extra layer of polish.
Plots hybrid candles directly on your price chart – green for up-trend, red for down-trend.
Emits alerts every time the hybrid flips color.
The result is a chart that ignores tiny back-and-forth ticks and averages out intra-brick wicks, leaving long uninterrupted color runs that highlight genuine trend shifts.
🔧 Inputs & Customization
Group Input Purpose
Renko Settings Renko Base Type – ATR / Traditional / Percentage
ATR Length & Multiplier
Traditional Box Size (points)
Percentage Box Size (%) Choose how the brick size is calculated.
Transformation Order Apply Heikin Ashi – After Renko / Before Renko Pick whether HA smooths the bricks or bricks are built from HA data.
Smoothing Extra Smoothing – None / EMA
Smoothing Length Add a fast EMA to the hybrid opens & closes.
Typical Use-Cases
Directional filter – Trade only long when bricks are green, short when red.
Entry / exit trigger – Enter on first green after a red run; exit on first opposite flip.
Pyramiding helper – Add positions on pull-backs while the hybrid color stays unchanged.
Psychology aid – Stay in trends longer by ignoring every micro-wiggle.
Best-Practice Tips
Tune brick size so a normal swing equals 6–10 bricks on your timeframe.
For scalping, keep Order = After Renko and Extra Smoothing = None for the snappiest flips.
For swing trading, try Before Renko + EMA(3-5) to focus on major legs.
Forward-test in a demo account; synthetic bricks can’t replicate live slippage.
⚠️ Disclaimer
This indicator is educational. It does not guarantee profits and should be used alongside solid risk management and personal judgement. Always back-test before deploying real capital.
Enjoy the clarity!
If you discover tweaks, optimizations, or killer workflows, drop a comment and let the community know.

Enhanced Renko Channel with Emulation and SMA by Dr DevendraThis indicator combines a dynamic Renko-based channel with emulated Renko bricks and a customizable Simple Moving Average (SMA). It provides traders with a powerful tool for identifying trends, visualizing price movement within a Renko framework, and overlaying critical moving average signals.
Features:
Renko Channel:
A Gaussian-based midline with adjustable poles and sampling periods.
True Range-based dynamic channel boundaries.
Visual trend identification with color-coded channel fills.
Renko Emulation:
Emulated Renko brick levels with adjustable brick sizes.
Dynamic brick plotting based on price action.
Simple Moving Average (SMA):
Configurable length and source (e.g., close, hlc3, etc.).
Dynamic color changes based on SMA slope (uptrend or downtrend).
Customizable Inputs:
Adjustable parameters for the channel, Renko emulation, and SMA settings.
Options for reduced lag and fast response modes in the Renko channel.

Custom Renko Chart by Mustafa KapuzThis Pine Script, developed by Mustafa Kapuz, offers a unique approach to visualize price movements through a custom Renko chart directly on your TradingView overlay. Unlike traditional Renko charts that are detached from time series, this script allows traders to overlay Renko-style price movements over standard charts, providing a hybrid view that combines the clarity of Renko with the context of time-based charting.
Key Features:
Adaptive Brick Size: At the heart of this script is the Brick Size input, allowing users to define the size of each Renko brick. This flexibility is crucial for tailoring the chart to various commodities or assets, as volatility and price scales differ widely across markets.
Dynamic Price Adjustment: The script dynamically adjusts to price movements, creating new bricks whenever the price moves by the predefined Brick Size from the last brick value. This adjustment is made regardless of the time elapsed, focusing solely on price action, thereby filtering out minor fluctuations and highlighting significant trends.
Visual Clarity: Rendered as a step line, the resulting Renko chart provides a clear visual representation of price trends. Each step signifies a new brick, painted in blue for easy visibility. This method simplifies the analysis of directional movements, making it easier to identify potential entry and exit points.
Usage Tips:
To optimize the chart for different markets, experiment with the Brick Size parameter. Adjusting this value allows the chart to better reflect the unique characteristics of each commodity or asset, ranging from highly volatile cryptocurrencies to more stable fiat currencies or stocks.
This custom Renko chart can be a powerful addition to your trading toolkit, especially when used in conjunction with other indicators and analysis techniques. It's designed to offer a new perspective on price movements, filtering out the 'noise' and focusing on substantial trends.
By customizing the Brick Size, traders can tailor the chart to various commodities, achieving a versatile analysis tool that adapts to different market conditions. Whether you're a seasoned trader or new to the markets, this script provides a fresh lens through which to view and interpret price action, enhancing your trading strategy with the timeless principles of Renko charting, now integrated into your TradingView experience.
20 Pips & Dip™ Indicator20 Pips & Dipp script based on a few different indicators which together provides powerful help for all level of traders, especially beginners. Also, script have toggles to switch on/off: Renko Reversal, EMA, HHLL, Support/Resistance, Daily Open modules.
1st Module – Renko Reversal Alerts Indicator. The Indicator point out a spot where the revers are happens. Any changes in Price that do not reach a minimum amount are usually filtered. This helps to keep attention on larger, significant moves, and helps not to avoid the minute fluctuations in the market.
How it’s works?
- ENTER a trade JUST AFTER 1 Renko brick is printed. BUY triangle (green buy text with green triangle) is generated if a bearish Renko Brick is followed by a bullish brick. In other words, a buy signal happens when a white block is drawn after a black one. The buy happens then at the closing price that may be higher than the top of the last brick. It can go two bricks up minus a tick or pip.
- EXIT that trade, and open a new reverse position, just after 1 Renko brick is printed in the opposite direction. SELL triangle (red sell text with red triangle) is generated if a bullish brick is followed by a bearish brick. In other words, a sell signal happens when a black block is drawn, after a white block. The same situation as with a buy signal happens on sell signals. There is an uncertainty on the close price that may go as far as one tick above the next potential bearish block.
How to create custom ALERTS? Right click on a sell or buy triangle > Add Alert > 20 Pips & Dipp > Choose between Long or Short opportunity. In options field choose ONCE PER BAR. All other options you can choose according to your personal needs. If you want alert for another option (i.e. Short opportunity) just add one more.
Just to know! To understand how those module work better to switch to Renko chart. But Renko Chart with Renko brick size & Timeframe less than 1 day available only for PRO+ accounts and better. Also, we need to say that TradingView platform do not provide TICK data as we know. So, it may confuse you. Be careful!
2nd Module – Moving Average Exponential. The exponential moving average (EMA) is a weighted moving average (WMA) that gives more weighting, or importance, to recent price data than the simple moving average (SMA) does. The EMA responds more quickly to recent price changes than the SMA. The formula for calculating the EMA just involves using a multiplier and starting with the SMA. Like all moving averages, this technical indicator is used to produce buy and sell signals based on crossovers and divergences from the historical average. By default, our EMA have 50 period. The 50 moving average is the standard swing-trading moving average and very popular. Most traders use it to ride trends because it’s the ideal compromise between too short and too long term. Some people call it medium-term.
How to use it? EMAs are commonly used in conjunction with other indicators to confirm significant market moves and to gauge their validity. For traders who trade intraday and fast-moving markets, the EMA is more applicable. Quite often, traders use EMAs to determine a trading bias. For example, if an EMA on a daily chart shows a strong upward trend, an intraday trader’s strategy may be to trade only from the long side on an intraday chart.
Limitations of EMA! An EMA relies wholly on historical data. Many people believe that markets are efficient - that is, that current market prices already reflect all available information. If markets are indeed efficient, using historical data should tell us nothing about the future direction of asset prices.
3rd Module - Pivot Points (High/Low). Also known as Bar Count Reversals, are used to anticipate potential price reversals. Pivot Point Highs are determined by the number of bars with lower highs on either side of a Pivot Point High. Pivot Point Lows are determined by the number of bars with higher lows on either side of a Pivot Point Low. Default period is 10.
How this indicator works? The longer the trend (the higher the period selected) before and after the Pivot Point, the more significant the Pivot Point. Pivot Points can be used to help determine where to draw trendlines in order to visualize price patterns.
Calculation! Pivot Point Highs are determined by the number of bars with lower highs on either side of a Pivot Point High. Pivot Point Lows are determined by the number of bars with higher lows on either side of a Pivot Point Low.
4th Module - Higher High Lower Low indicator. Higher high and higher lows and Lower lows and lower highs are trends in a chart. Stocks in general never go up or down in linear fashion, every rise is followed by correction and then again it may either go up or down, same is true for downtrend every fall is followed by a correction in the upward direction and then new downtrend or uptrend is followed. After every rise, the stock took breather corrected to some extent and then new uptrend began, when you see the correction every low is higher than the previous lows and every next peak is higher than it’s previous peak. This is higher highs and higher lows trend.
How it’s work? This script finds pivot highs and pivot lows then calculates Higher Highs, Higher Lows & Lower Lows, Lower Highs. And it calculates support/resistance by using HH-HL-LL-LH points. Generally, HH and HL shows up-trend, LL and LH shows down-trend. If price breaks resistance levels it means the trend is up or if price breaks support level it means the trend is down, so the script can change bar colour blue or black by default. if there is up-trend then bar colour is blue, or if down-trend then bar colour is black. Support and resistance levels change dynamically.
Trick! If you use smaller numbers for Left Hand/Right Hand sides then it will be more sensitive!
5th Module - Daily Open Price. The opening price is the price at which a security first trades upon the opening of an exchange on a trading day; for example, the New York Stock Exchange (NYSE) opens at precisely 9:30 a.m. Eastern time. The price of the first trade for any listed stock is its daily opening price. The opening price is an important marker for that day's trading activity, particularly for those interested in measuring short-term results such as day traders.
Important! If daily open price was higher than current price, crosses will be red. And if daily open price lower than current price crosses will be green. Colours change dynamically.
You need to know it! An opening price is not identical to the previous day's closing price. There are several day-trading strategies based on the opening price of a market or security. Research “Gap Fade and Fill” or “Fade”.
Author – Christian Kopachelli . Huge thanks and credits to peoples which ideas, formulas, calculations, code snippets and code parts were used: Robert Nance, CryptoJoncis , FritzHaber , vacalo69 , Molle de Jong, Baris Yakut, LonesomeTheBlue , ChrisMoody , Robert N. ~~~ THANK you all! You are awesome!
DISCLAIMER! RISK WARNING!
PAST PERFORMANCE IS NOT NECESSARILY INDICATIVE OF FUTURE RESULTS. TRADERS SHOULD NOT BASE THEIR DECISION ON INVESTING IN ANY TRADING PROGRAM SOLELY ON THE PAST PERFORMANCE PRESENTED, ADDITIONALLY, IN MAKING AN INVESTMENT DECISION, TRADERS MUST ALSO RELY ON THEIR OWN EXAMINATION OF THE PERSON // OR ENTITY MAKING THE TRADING DECISIONS.
Fibonacci Renko Trend - AynetThe "Fibonacci Renko Trend - Aynet" Pine Script combines the Renko charting technique with Fibonacci retracement levels to create a highly customizable and adaptive trend-following tool. Below is a detailed explanation of the script and its components:
Scientific and Trading Applications
Noise Reduction:
By using Renko charts, the script filters out time-based noise and focuses solely on price movement, making it ideal for trend-following strategies.
Adaptability:
The ATR-based box size ensures that the Renko blocks automatically adjust to market volatility, making the tool versatile for different market conditions and asset classes.
Fibonacci-Based Decision Making:
The integration of Fibonacci retracement levels provides a structured framework for identifying key support and resistance levels. Traders can use these levels to anticipate price reversals or continuations.
Visualization:
The color-coded Renko blocks allow traders to quickly identify trends and potential reversals without additional indicators, improving decision-making efficiency.
Possible Improvements
Signal Generation:
Add entry and exit signals when price crosses significant Fibonacci levels or when a trend reversal is detected.
Multi-Timeframe Support:
Extend the script to compute Renko levels and Fibonacci ratios for multiple timeframes simultaneously.
Alerts:
Implement alert notifications for key events, such as trend changes or Fibonacci level breaches.
This script is a robust tool for traders looking to combine the simplicity of Renko charts with the analytical power of Fibonacci retracement levels. It offers a clear visualization of price trends and potential reversal points, making it suitable for both novice and experienced traders.

[SMT] Buy & Sell Renko Based - AlertsThis is a custom indicator that implements a trading strategy based on Renko charts, but they can be used on regular candlestick charts and on any time frame. Renko charts are known for filtering market noise and displaying price movements in a clearer way. However, it is important to note that this indicator is provided for educational and informational purposes only and is not a guarantee of profitable returns.
Features:
- The indicator uses Renko charts to generate buy and sell signals.
- Renko bricks are built based on a predefined price variation, rather than time.
- The length of the Average True Range (ATR) used to calculate Renko bricks can be customized.
- Buy signals are generated when the price crosses below the current Renko brick.
- Sell signals are generated when the price crosses above the current Renko brick.
- Entry points are marked with "Buy" and "Sell" arrows on the chart.
It is essential to emphasize that no indicator or trading strategy guarantees profitable results. The financial market is complex and subject to unpredictable changes. It is recommended to perform additional tests and analysis before using this indicator on a real trading account.
Always remember to manage your risks properly and consider other factors such as fundamental analysis and market conditions when making trading decisions. The use of this indicator is entirely the user's responsibility.
DISCLAIMER: This indicator is not financial advice and should not be interpreted as such. Always consult with a qualified financial professional before making any investment decisions.

[SMT] Buy & Sell Renko Based - StrategyThis is a custom indicator that implements a trading strategy based on Renko charts, but they can be used on regular candlestick charts and on any time frame. Renko charts are known for filtering market noise and displaying price movements in a clearer way. However, it is important to note that this indicator is provided for educational and informational purposes only and is not a guarantee of profitable returns.
Features:
- The indicator uses Renko charts to generate buy and sell signals.
- Renko bricks are built based on a predefined price variation, rather than time.
- The length of the Average True Range (ATR) used to calculate Renko bricks can be customized.
- Buy signals are generated when the price crosses below the current Renko brick.
- Sell signals are generated when the price crosses above the current Renko brick.
- Entry points are marked with "Buy" and "Sell" arrows on the chart.
It is essential to emphasize that no indicator or trading strategy guarantees profitable results. The financial market is complex and subject to unpredictable changes. It is recommended to perform additional tests and analysis before using this indicator on a real trading account.
Always remember to manage your risks properly and consider other factors such as fundamental analysis and market conditions when making trading decisions. The use of this indicator is entirely the user's responsibility.
DISCLAIMER: This indicator is not financial advice and should not be interpreted as such. Always consult with a qualified financial professional before making any investment decisions.

TUE Renko Box/Time TesterThe TUE Renko Box/Time Tester is a technical indicator designed to quantify the frequency of consecutive duplicate timestamps within Renko charts on the TradingView platform. It serves the critical purpose of assessing the prevalence of identical timestamps, a crucial factor for the accurate automation of trading strategies.
The presence of duplicate timestamps can impede the reliability of automated trading systems. This indicator systematically examines Renko bars and identifies instances where successive bars share the same timestamp. The quantified data aids traders and developers in evaluating the quality and suitability of their Renko chart data for algorithmic trading purposes.
To ensure proper speed and precision in automation, traders are advised to run Renko charts on either 1-second or 5-second timeframes. Adjusting the box sizes of Renko charts based on these timeframes is essential.
The objective is to maintain the incidence of duplicate timestamps at levels below 20%, ensuring the robustness and consistency of automated trading strategies. By providing a quantitative analysis of timestamp duplication, this indicator supports traders in optimizing their trading systems for enhanced accuracy and efficiency.
The script will automatically collate only the last two days' worth of data, in order to maintain timestamp integrity. You should be able to view individual seconds on your timestamps, and if they're all reading :00 at the end, then you have ran out of seconds-level data. This is only done with a Premium or higher subscription.
