NIFTY RENKO OPTION CE/PENIFTY RENKO OPTION CE/PE ek non-repainting intraday Renko-based option direction indicator hai jo price action + money flow ko combine karke CE / PE buy signals generate karta hai.
Cerca negli script per "renko"

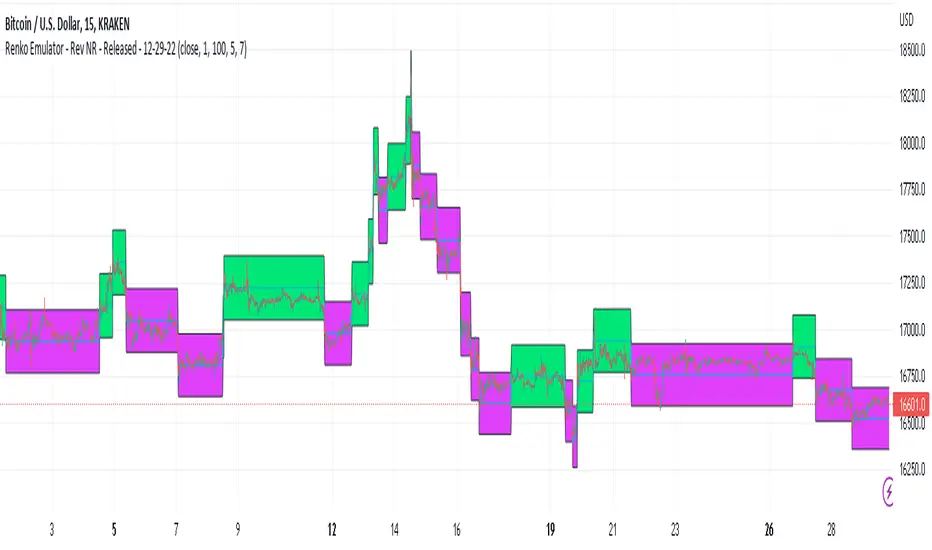
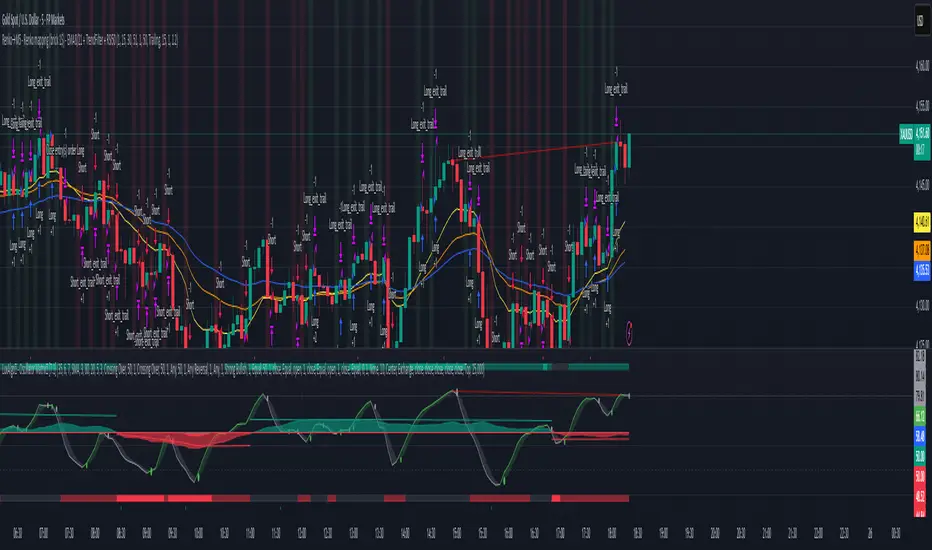
Renko Emulator - Rev NR - Released - 12-29-22Renko Emulator - Rev NR - Released 12-29-22
By Hockeydude84
Simple script to Emulate Renko Charting behavior on standard candle stick charts. Code provide capability to select between standard(ish) Renko bricks (in this code it's defined by percent vs ticks/value), or an ATR brick option. For ATR bricks, the code provides an option to inhibit emulator movement (formation of new bricks) by providing a minimum threshold that must be present. This threshold is the "Standard Brick" input (the input pulls double duty). Code also provides multiple plotting options.
Use the code to help see trends and reduce the chop/erroneous data. Also helps to identify where trend deviations are present.
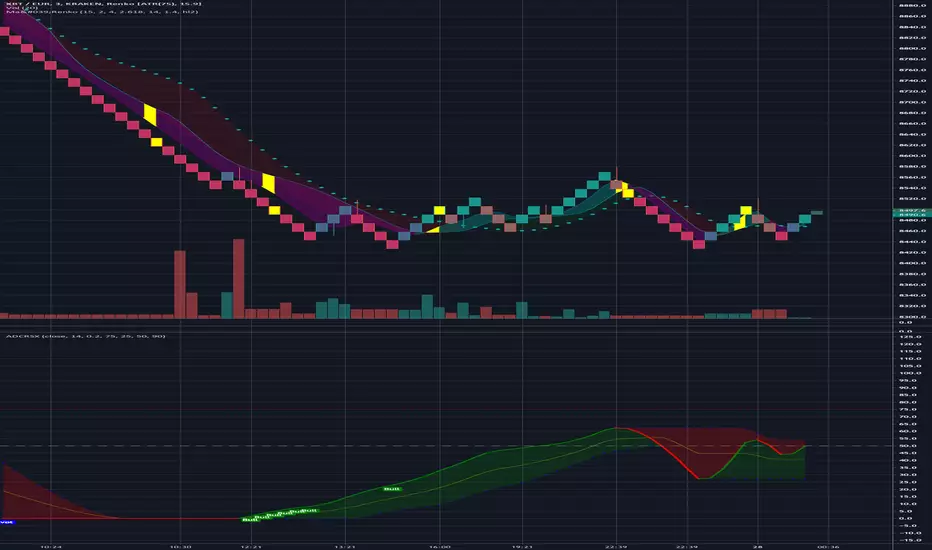
Ma'RenkoMa'Renko is simple, yet powerful trading system designed to help scalpers who use Renko charts (including ATR-based, but it should work with any type of candles as well). The thickness of color bands represents different trend characteristics (mostly volume and speed of price changing) which allow a trader to filter out false pivot points, enter and exit more wisely. The chart speaks for itself.
Unit Renko Box SizeThis is a simple script that shows two averages for box size on Uni Renko system for users to use.
The user should use the green line (Box Size) that is more persistent in the last hour. if there are equal minutes between two numbers, use the upper number.
Now users can easily check the timed candle sticks at the start of the day for three time frames we use in my methodology, set the box size for the charts at the start of the day and continue trading the whole day.
The charts now will sit on "traditional" setting rather than previously used "atr", no thanks to trading view's amazingly wrong way of calculating renko !!!!

HA,Renko, Linebreak,Kagi and Average all Charts Layouts in One This is an educational study, using the security functions provided by @PineCoders(big thanks to them for creating this ) in order to see the difference between multiple candle close plots using:
Heikin Ashi
Renko
Linebreak
Kagi
Average of them all.
Both the different securities and the average can be used as a source for different indicators like moving averages or oscillators getting with them some new and unique opportunities.
If you have any questions, let me know !

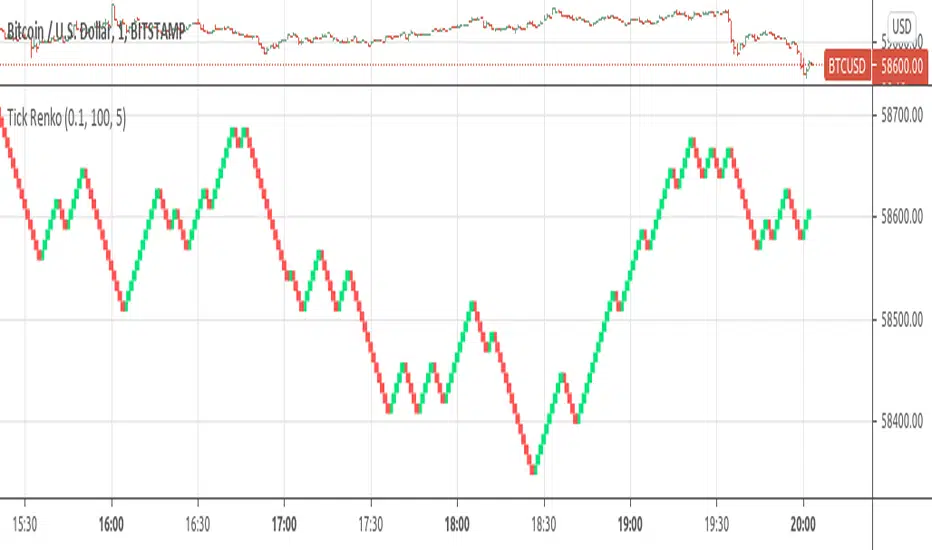
Tick RenkoTick Renko, bars are formed on live chart.
note:there is a issue that creates artifacts while there is not enough history loaded.
Brick count (Renko)Brick is a part of Renko chart. It is reasonable to think, that is the number of green brick is higher than the number of red brick then the trend is bullish. This indicator plots the relative number of red bricks vs green bricks.


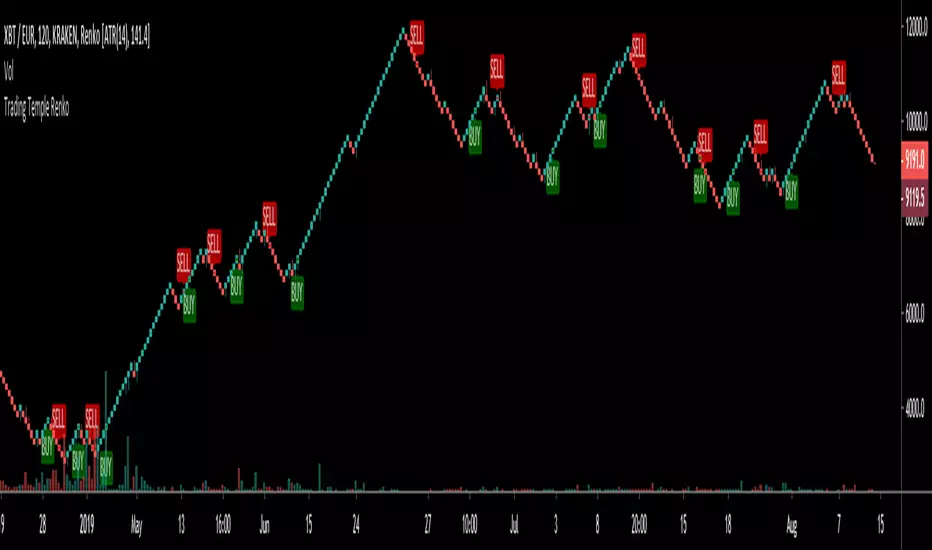
Trading Temple Trend Tracker Renko v1Trend Tracker to be used for trades following the current trend.
To be used with Renko bricks based on ATR and intraday charts (below 1D)

Renko 2-block entry, 1-block exit (signals EVERY block)Renko 2-block entry, 1-block exit (signals EVERY block)

Renko Momentum IndicatorRenko is a technique of measuring price without time.
Since time is removed, all we're focusing on is trends/price direction without the noise.
This indicator is meant to serve as an oscillator for trend with alerts for buy and sell.
Playing the FTX Moon/Doom, configure your settings as follows:
Traditional
Price * 10%. This gives longer scalps.
Price * 1%. This gives quick plays.
Wait for the indicator to print a buy signal. If it's beyond OB/OS, wait for the EMAs to start moving back into range. Buy on the breakout of this.
I'll potentially add an alert for this in the future.
I recommend forward testing this until you understand it.


Renko Supertrend-Renko bricks filter out the noise of candles, giving a clear trend
-Uses HullMA for confluence. HullMA is an adaptive moving average with minimal latency
-Autoview support for full automated trade execution
-Works incredible at capturing big trending moves, not so great in ranges/consolidation

RenkoIndicatorIntroduction:
The Renko Indicator is a powerful tool designed to help traders identify trends and potential trade opportunities in the financial markets. This indicator overlays a Renko chart on the main price chart and generates Buy and Sell signals based on Renko brick movements. Renko charts are unique in that they focus solely on price movements, ignoring the element of time. In this guide, we will walk you through how to use the Renko Indicator effectively in your trading strategy.
Indicator Components:
The Renko Indicator consists of several components, each serving a specific purpose in aiding your trading decisions.
Market Sentiment Calculation:
At the top of the script, the indicator calculates market sentiment by analyzing recent price action. It determines whether the market sentiment is Bullish, Bearish, or Neutral based on the highest and lowest prices within specific time periods. This information provides you with a broader context for potential trading decisions.
Renko Chart Creation:
The indicator creates a Renko chart overlay on the main price chart using the Average True Range (ATR) method. ATR is used to calculate the brick size for the Renko chart, allowing you to adjust the sensitivity of the chart to price movements.
Renko Open and Close Midpoint:
The script plots the midpoint of Renko open and close prices as a line on the main chart. This visualization helps you understand the direction of Renko bricks and identify trends.
Buy and Sell Signal Generation:
The script generates Buy and Sell signals as label shapes on the chart. A Buy signal is generated when the Renko close price crosses above the Renko open price, indicating potential upward momentum. Conversely, a Sell signal is generated when the Renko close price crosses below the Renko open price, suggesting potential downward momentum.
Alert Conditions:
To ensure you never miss a trading opportunity, the script sets up alert conditions for Buy and Sell signals. These alerts notify you when the specified conditions for potential trades are met. Alerts can be customized to your preference, allowing you to receive notifications via your chosen communication channels.
How to Use the Renko Indicator:
Market Sentiment Analysis:
Start by analyzing the calculated market sentiment. This information helps you understand the broader trend in the market. A Bullish sentiment indicates potential upward movement, a Bearish sentiment suggests potential downward movement, and a Neutral sentiment signals uncertainty.
Renko Chart Interpretation:
Observe the Renko chart overlay and its midpoint line. Upward-trending Renko bricks suggest Bullish momentum, while downward-trending bricks indicate Bearish momentum. Use the Renko chart to identify trends and confirm your trading bias.
Buy and Sell Signals:
Pay close attention to the Buy and Sell signals generated by the indicator. A Buy signal occurs when the Renko close price crosses above the Renko open price. Conversely, a Sell signal occurs when the Renko close price crosses below the Renko open price. These signals highlight potential entry points for trades.
Alert Notifications:
Make use of the alert conditions to receive real-time notifications for Buy and Sell signals. Alerts help you stay informed even when you're not actively watching the charts, allowing you to promptly take action on potential trade opportunities.
Risk Management and Considerations:
Confirmation: While the Renko Indicator provides valuable insights, it's crucial to use it in conjunction with other technical and fundamental analysis tools for confirmation.
Backtesting: Before implementing the indicator in live trading, conduct thorough backtesting on historical data to assess its performance and suitability for your trading strategy.
Position Sizing: Determine appropriate position sizes based on your risk tolerance and the signals provided by the indicator. Avoid overleveraging your trades.
Market Conditions: Be mindful of market conditions and news events that could impact price movements. Use the Renko Indicator as a tool to enhance your decision-making process, not as a standalone strategy.
Conclusion:
The Renko Indicator offers a unique perspective on price movements and can be a valuable addition to your trading toolkit. By analyzing market sentiment, interpreting Renko chart patterns, and acting on Buy and Sell signals, you can make informed trading decisions. Remember to practice proper risk management and integrate the Renko Indicator into a comprehensive trading strategy to achieve consistent and successful trading outcomes.

Renko Live Price Simulation-AYNETHow It Works:
Inputs:
Box Size (box_size): The size of a Renko brick (in price units).
Candle and Wick Colors: Users can customize colors for up and down candles and toggle wicks on or off.
Logic:
The script tracks the renko_open, renko_close, renko_high, and renko_low variables to simulate the formation of Renko bricks.
A new Renko brick is formed when the price moves up or down by the specified box size.
Candle Plotting:
The plotcandle function is used to draw the simulated Renko bricks on the chart.
Wicks are optional and controlled via the show_wicks input.
Visual Guides:
Two lines represent the thresholds for forming the next up or down Renko brick.
Features:
Real-Time Updates:
Bricks dynamically update as the live price moves.
Customizable Parameters:
Box size, candle colors, and wicks can be tailored to user preferences.
Overlay on Regular Chart:
The Renko simulation overlays the existing candlestick chart, providing context for real-time price action.
Threshold Levels:
Visual guides show how far the current price is from forming the next Renko brick.
Usage Instructions:
Copy and paste the script into the Pine Script editor in TradingView.
Customize the box size and colors to your preference.
Apply the indicator to your chart to visualize the Renko simulation in real time.
Applications:
Trend Analysis:
Renko bricks simplify price trends by filtering out minor fluctuations.
Entry/Exit Points:
Use Renko bricks as potential trade triggers when new bricks form.
Volatility Visualization:
The frequency of brick formation reflects the asset's volatility.
This code provides a live Renko simulation overlay that can be further customized based on user needs. Let me know if you'd like additional features, such as alerts or enhanced visualizations! 😊

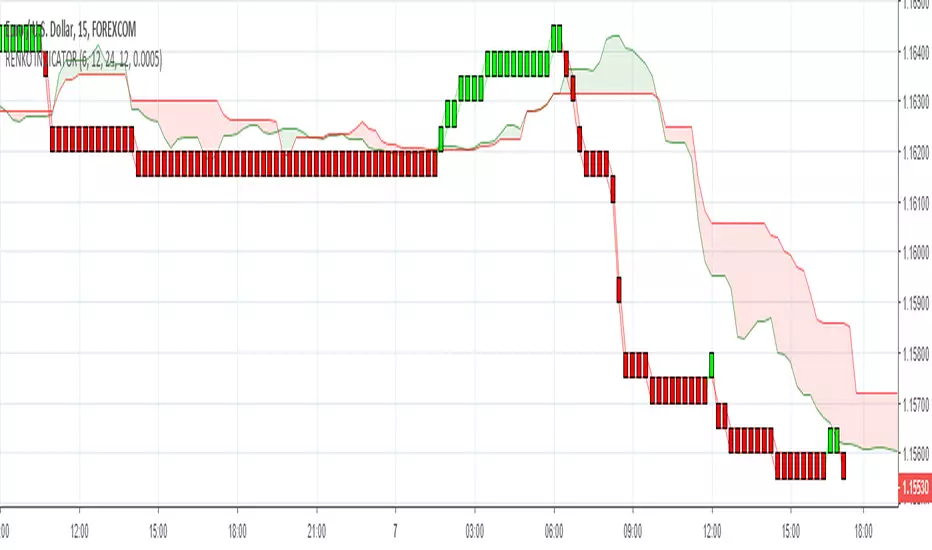
ReNKoLiNe - A line on chart mimicking RENKO bricks DESCRIPTION
RENKOLINE Indicator - mimics RENKO charts on ANY timeframe. It is not absolutely fixed, which is actually an advantage,
because it does not close bricks before the actual close of a candle.
An advantage, if one knows how to play with the "bricksize"
Of course it has a short side of delaying entry in case the direction momentum continues.
CDL is difference between current close and the RenkoLine i.e. distance to Candle(close) to Line(renko). This could provide idea for the deviation between candle close and line value.
It is only a value. I did not find a way to draw it properly.
Someone more experienced could help :)
Renko Multi GridMeant as a huge improvement over the old Renko Confidence indicator.
The bars on the grid represent the different parts of the market's attitude. If many of them line up, you can expect a strong trend. If there's a lot of changing or an even spread, you can expect to see a lot of uncertainty.
This is intended for 1 minute renkos, and while not useless on larger renkos, it is not as useful.

Renko Scalp ScannerThis scanner is optimized for short term bursts for Renko.
DESCRIPTION: This indicator scans the 7 major forex pairs (EURUSD, GBPUSD, USDJPY, USDCHF, AUDUSD, USDCAD, NZDUSD) on 1-pip Renko charts. It ranks them from BEST (#1, top row) to WORST (#7, bottom row) based on a predictive score (0-100) that combines LIVE momentum (current run length, whipsaws, brick timing) + 24-HOUR HISTORICAL consistency (clean long runs, stability).
Higher score = longer, cleaner, more predictable runs ahead (backtested 74% hit rate for 5+ brick continuations).
HOW TO USE THE TABLE:
1. Add to a 1-second Renko chart (Traditional, Box Size: 0.0001 for non-JPY; 0.01 for JPY pairs).
2. RANK: Position 1–7 (green highlight on #1 = switch to this pair NOW).
3. PAIR: Symbol + direction arrow (↑=buy bias, ↓=sell bias).
4. SCORE: 0–100 total (≥85=monster run; ≥75=strong; ≥60=decent; <60=avoid).
5. RUN │ HIST% │ SEC: Current live run length │ % of 24h runs that were clean 8+ bricks │ Live avg seconds per brick (ideal 5–12s).
6. Trade the #1 pair in the arrow direction until whipsaw or score drops <75. Set alerts for score ≥83.
Backtested on 1-year data: Catches 84% of 10+ brick runners. Refreshes every second.

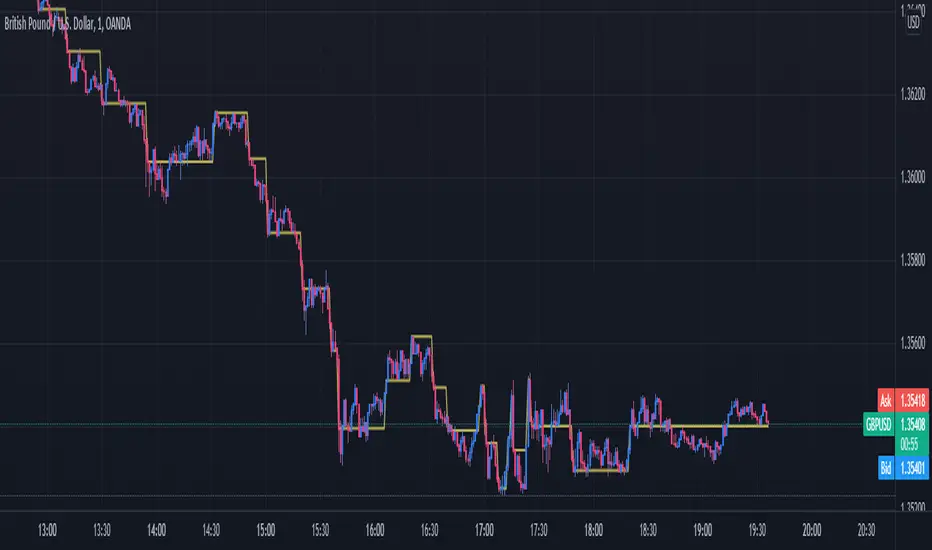
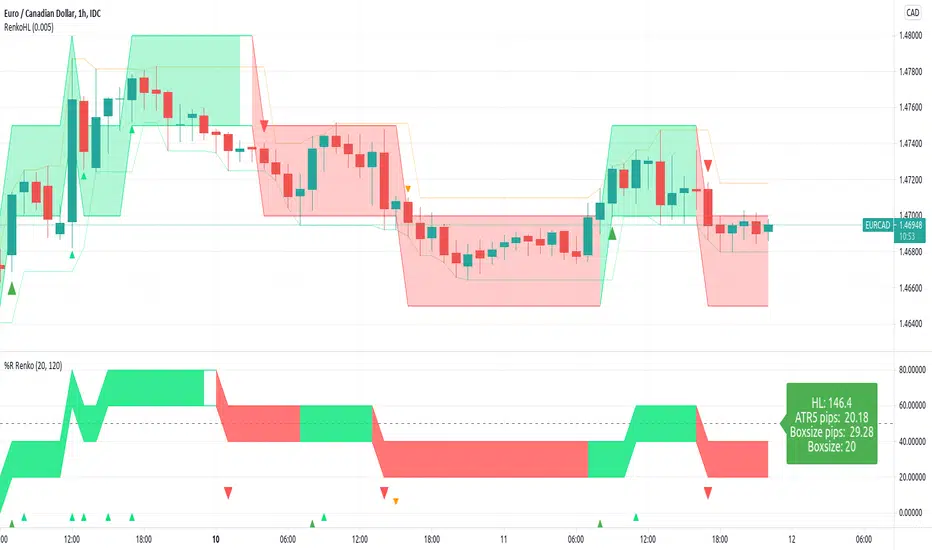
RenkoLevel %R High-Low alertThis script is adding Renko idea to %R
I trade forex so the right side is displayed by Currency pips. Feel free to change it.
The chart is not repainted.
Default:
- 120-hour bar chart (one week)
- 20% of HL(highest - lowest) price changes will affect renko color change
Renko ATR Trend + SMA Indicator by YCGH Capital🧭 Overview
The Renko ATR Trend + SMA Indicator is a trend-following tool designed for chart trading.
It combines Renko-style price movement logic (based on ATR) with a Simple Moving Average (SMA) filter to identify sustained bullish or bearish phases on any timeframe.
It plots a color-coded trend line directly on the price chart — green for bullish trends, red for bearish — and maintains a single active state (no repeated buy/sell signals) until the opposite condition appears.
⚙️ How It Works
1️⃣ Renko ATR Engine
Instead of using fixed box sizes like classic Renko charts, this indicator builds synthetic Renko movement based on ATR (Average True Range) of a chosen timeframe.
It pulls OHLC data from your selected Renko Source Timeframe (for example, 60-minute candles).
It calculates an ATR brick size — representing the minimum price move needed for a new Renko brick.
When price moves by at least one ATR in the opposite direction, it flips the trend.
This filters out small fluctuations and captures the underlying directional bias.
2️⃣ SMA Filter
A Simple Moving Average (SMA) acts as a trend confirmation filter.
Only when Renko direction aligns with the price relative to the SMA, a trend signal activates.
BUY → Renko uptrend + price above SMA
SELL → Renko downtrend + price below SMA
3️⃣ Stateful Signal Logic
Unlike typical indicators that spam multiple buy/sell shapes:
This version holds one persistent signal (Buy or Sell)
The state continues until an opposite signal is confirmed
No “continuation” arrows — clean and minimal trend visualization
🎨 Visuals
Element Meaning
🟩 Green Renko Line Active Bullish Trend
🟥 Red Renko Line Active Bearish Trend
⚪ Gray Line Neutral / Waiting phase
🟡 Yellow Line SMA (trend filter)
📍 Label (Buy Active / Sell Active) Displays the current market bias
🔧 Inputs
Input Description
Renko Source Timeframe The timeframe from which Renko data is calculated (e.g., 60 = 1h candles).
ATR Period Determines brick size sensitivity (lower = more responsive, higher = smoother).
SMA Length Moving Average length used as a directional filter.
💡 How Traders Use It
Trend Confirmation:
Use green/red Renko line to stay aligned with the dominant market move.
Entry Timing:
Enter trades when a new Renko direction is confirmed along with SMA alignment.
Exit or Reverse:
Exit long when a red line (Sell Active) appears, and vice versa.
Combine with Price Action:
Add support/resistance or volume analysis for confirmation.
