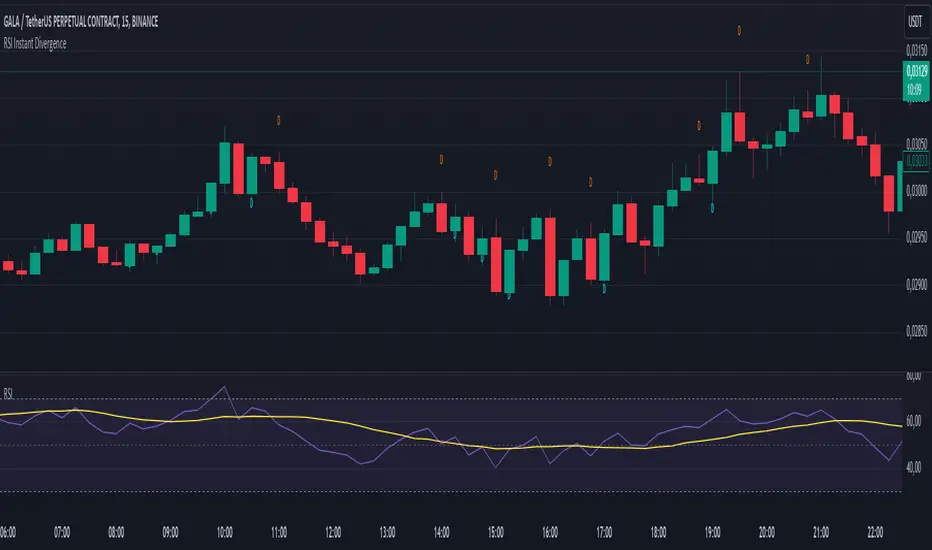
RSI Instant DivergenceThis script detects RSI divergence—a common signal indicating potential trend reversals. It compares price action and RSI behavior to identify two types of divergences:
1- Bearish Divergence (Sell Signal):
Occurs when the price forms a higher high while RSI drops (weaker momentum).
A label appears above the candle, and an alert is triggered: "Divergence: Sell Signal."
2 -Bullish Divergence (Buy Signal):
Occurs when the price makes a lower low while RSI rises (stronger momentum).
A label appears below the candle, and an alert is triggered: "Divergence: Buy Signal."
The labels are color-coded (orange for sell, blue for buy) and include detailed RSI and price info in a tooltip. Alerts help you act immediately when divergence is detected.
This tool is perfect for spotting potential trend reversals and refining your entry/exit strategy. Let me know if you'd like to customize it further! 😊
Tooltip Feature: Each label includes a tooltip with precise RSI and price details (current and previous values) as well as the percentage change in RSI, giving you deeper insight into the divergence. This tool is great for identifying trend reversal points and includes visual labels, tooltips, and alerts to make real-time trading decisions easier. Let me know if you’d like adjustments!
Cerca negli script per "rsi"
RSI - Made EasyThis indicator is a visually improved version of RSI. It makes it much easier to see what's happening by simplifying those confusing, intersecting lines. With this, you can detect the RSI direction more clearly. All the features are also explained in the tooltips of the input fields. Some extra features are included, such as average top and bottom calculation, standard deviation and divergences.
Color legend:
Green: RSI Above MA and Rising
Light Green: RSI Above MA and Falling
Red: RSI Below MA and Falling
Light Red: RSI Below MA and Rising
Blue: RSI Crossover MA
Orange: RSI Crossunder MA
Blue Arrow: Bullish Divergence
Orange Arrow: Bearish Divergence
RSI over screener (any tickers)█ OVERVIEW
This screener allow you to watch up to 240 any tickers you need to check RSI overbought and oversold using multiple periods, including the percentage of RSIs of different periods being overbought/oversold, as well as the average between these multiple RSIs.
█ THANKS
LuxAlgo for his RSI over multi length
I made function for this RSI and screener based on it.
allanster for his amazing idea how to split multiple symbols at once using a CSV list of ticker IDs
█ HOW TO USE
- hide chart:
- add 6 copies of screener
- change list number at settings from 1 to 6
- add you tickers
Screener shows signals when RSI was overbought or oversold and become to 0, this signal you may use to enter position(check other market condition before enter).
At settings you cam change Prefics, Appendix and put you tickers.
limitations are:
- max 40 tickers for one list
- max 4096 characters for one list
- tickers list should be separated by comma and may contains one space after the comma
By default it shows almost all BINANCE USD-M USDT tickers
Also you can adjust table for your screen by changing width of columns at settings.
If you have any questions or suggestions write comment or message.

RSI of Zero Lag MA (ValueRay)The RSI of a Zero Lag Moving Average a powerful tool for for reliable exit signals.
The Relative Strength Index (RSI) is a widely recognized momentum oscillator that measures the speed and change of price movements. It provides valuable insights into overbought and oversold conditions, enabling traders to identify potential reversal points and take advantage of market inefficiencies.
The RSI of a Zero Lag Indicator takes this concept a step further by incorporating the Zero Lag Moving Average. The Zero Lag Moving Average is a cutting-edge indicator that minimizes lag and provides a smoother representation of price action, allowing for quicker and more precise responses to market movements.
By combining the RSI with the Zero Lag Moving Average, this indicator offers traders a superior exit strategy. When the RSI reaches extreme levels of overbought or oversold conditions, it indicates a potential reversal in the market. The Zero Lag Moving Average further enhances this signal by reducing delays and providing timely exit points.
Moreover, the RSI of a Zero Lag Indicator is not limited to mean reversion strategies. While it excels in identifying mean reversion opportunities, it can also be used in conjunction with other trading approaches. Traders can take advantage of its objective signals to exit trades profitably, regardless of their chosen strategy.
With its ability to accurately pinpoint overbought and oversold conditions, the RSI of a Zero Lag Indicator offers traders a competitive edge in the market. By providing timely exit signals and minimizing lag, it helps traders optimize their trading decisions and increase their chances of success.

RSI MTF DashboardThis is an RSI dashboard, which allows you to see the current RSI value for five timeframes across up to 8 tickers of your choice. This is a useful tool to gauge momentum across multiple timeframes, where you would look to enter a buy with high RSI values across the timeframes (and vice versa for sell positions).
Conversely, some traders use RSI to identify potential areas for reversals, so you would look to buy with low RSI values (and vice versa for sell positions).
In the settings, please select which 5 timeframes you require. Then select which tickers you wish to see, and you will find a dashboard on your chart to show the RSI values. The dashboard can be highlighted when the RSI value shows bearish momentum (a value under 50, of your choice) and bullish momentum (a value over 50, again of your choice). These colours and values are fully customisable.
In the settings you can also select the location of the dashboard, as well as some colour and transparency settings to enable the best possible view on screen.

RSI Past Can Turn RSI Into a Directional ToolThe Relative Strength Index was created by J. Welles Wilder to measure overbought and oversold conditions. It’s also found popularity as an overall measure of direction because upward-trending stocks often hit overbought conditions. The opposite can be true with underperformers.
Today’s custom script, RSI Past, attempts to capture this secondary use of RSI as a directional indicator.
RSI Past achieves this by comparing how many bars have passed since RSI's most recent overbought and oversold readings. It then plots a simple difference between those two numbers.
Stocks with “bullish” signals will have positive readings that will increase each time RSI hits an overbought condition.
“Bearish” readings are just the opposite, growing more negative as oversold conditions occur.
An examination of some individual stocks may show the usefulness of this approach.
Meta Platforms , for example, hit an oversold condition almost exactly one year ago, and has remained under heavy selling pressure since:
Exxon Mobil , on the other hand, flipped to a bullish reading last October and has trended higher since:
This raises some interesting questions for Apple, shown on the main chart above. AAPL’s RSI Past has maintained a bullish reading for over a year -- unlike most other big technology stocks and the broader Nasdaq-100. Could this reflect bigger directional strength, especially with prices holding the $150 level that’s had relevance several times mid-2021?
TradeStation has, for decades, advanced the trading industry, providing access to stocks, options, futures and cryptocurrencies. See our Overview for more.
Important Information
TradeStation Securities, Inc., TradeStation Crypto, Inc., and TradeStation Technologies, Inc. are each wholly owned subsidiaries of TradeStation Group, Inc., all operating, and providing products and services, under the TradeStation brand and trademark. You Can Trade, Inc. is also a wholly owned subsidiary of TradeStation Group, Inc., operating under its own brand and trademarks. TradeStation Crypto, Inc. offers to self-directed investors and traders cryptocurrency brokerage services. It is neither licensed with the SEC or the CFTC nor is it a Member of NFA. When applying for, or purchasing, accounts, subscriptions, products, and services, it is important that you know which company you will be dealing with. Please click here for further important information explaining what this means.
This content is for informational and educational purposes only. This is not a recommendation regarding any investment or investment strategy. Any opinions expressed herein are those of the author and do not represent the views or opinions of TradeStation or any of its affiliates.
Investing involves risks. Past performance, whether actual or indicated by historical tests of strategies, is no guarantee of future performance or success. There is a possibility that you may sustain a loss equal to or greater than your entire investment regardless of which asset class you trade (equities, options, futures, or digital assets); therefore, you should not invest or risk money that you cannot afford to lose. Before trading any asset class, first read the relevant risk disclosure statements on the Important Documents page, found here: www.tradestation.com .

RSI based support resistance levelsThis indicator draws support line and resistance lines in the price chart.
How ?
For drawing the support/resistance line we need to first determine the demand and supply.
We are using too-familiar indicator RSI to determine when the script is oversold and overbought.
Now oversold (in RSI) is not a point, it’s a zone. The RSI indicator comes below 30, stays there and goes up above 30. Similarly for overbought.
Now if you carefully look at the oversold region – the lowest point of the oversold region is the place where the demand came (for surety) and push the indicator (and price) up.
Similarly: the highest point of overbought is the place where (for surety) the supply came and push the indicator (and price) down.
So that’ the supply / demand line (for surety).
In this indicator, based on the RSI we are just drawing support and resistance lines in the chat. That’s all.
What is unique ?
Trendline concept is not new. RSI is not new. RSI overbought/oversold is not new.
There are indicators exist to draw trendlines. Some of them works beautifully.
However, none of these, we are aware of, uses RSI to determine it. And, we believe, the most logical way to determine support/resistance is RSI.
Note: We are not responsible for any trading/investment decision you are taking out of the outcome of this indicator.

RSI PacingThe RSI Pacing indicator compares the movement of the RSI directly with the movement of the asset to help identify divergences.
Bullish Divergences
The RSI is increasing at a greater rate than the pace of the asset.
The RSI is decreasing at a lesser rate than the pace of the asset.
Bearish Divergences
The RSI is decreasing at a greater rate than the pace of the asset.
The RSI is increasing at a lesser rate than the pace of the asset.
Warning: Does not yet work on higher timeframes yet. Working on getting the pace normalized to the RSI's bounds.

[_ParkF]RSIRSI
Typical RSI indicators were plotted with candles and expressed wick to resemble a candle chart,
and linear regression was added to predict changes in force intensity,
which allowed us to confirm support and resistance within linear regression.
In addition, divergence signal was marked as an additional basis for the price fluctuation point due to support and resistance.
In other words,
if the diversity signal appears together when the rsi candle is supported and resisted within linear regression,
this is the basis for predicting that it is a point of change in the existing trend.
Finally, the period value and standard deviation of linear regression can be arbitrarily modified and used.
I hope it will help you with your trading.
일반적인 RSI 지표를 캔들화 하였고 꼬리까지 포함하여 캔들 차트와 유사하게 표현 하고,
캔들화한 RSI 지표에 선형회귀(채널)를 추가 하여 RSI 지표 특유의 힘의 강도의 변화를 지지와 저항으로 확인할 수 있게 해봤습니다.
또한 다이버전스 신호를 추가하여 선형회귀(채널)로 인한 지지와 저항에 따른 가격 변동의 근거로 삼을 수 있습니다.
즉, 선형회귀(채널) 안에서 RSI 캔들이 지지와 저항을 받을 때 다이버전스 신호가 함께 나타난다면 이는 기존 추세의 변화 지점임을
예측해 볼 수 있는 근거가 됩니다.
마지막으로 선형회귀(채널)의 기간값과 표준편차는 임의로 수정하여 사용할 수 있습니다.
당신의 트레이딩에 도움이 되었으면 합니다.
* I would like to express my gratitude to zdmre for revealing the linear regression source.

RSI Div at Daily VWAP StDevMean Reversion indicator based on RSI Divergences at Overbought/Oversold conditions with Price above/below a Standard Deviation from Daily VWAP. Useful for intra-day trading.
Signal criteria:
1. RSI is at Overbought/Oversold
2. RSI Divergence present (not hidden)
3. RSI has not reached Neutral level (i.e. 50)
4. Price has crossed above/below a Standard Deviation from Daily VWAP
Config Options:
- RSI length (default:14)
- Divergence Lookback Period (default:14)
- RSI Oversold/Overbought tresholds (default: 70/30)
- RSI Reset Level (default: 55/45)
- Use VWAP Std Dev (default: yes)
- Standard Deviation from Daily VWAP (default: 1.51)
Use with discretion.

RSI TunnelsAn experimental RSI Tunnels indicator that plots RSI inside RSI High/Low tunnels and shows the breakouts of the tunnel.
The tunnels are made by fetching the RSI previous highest high and previous lowest low.
==Explanation==
If current RSI CROSS OVER the higher band and above zero line, we have a bullish signal.
If current RSI CROSS UNDER the lower band and below zero line, we have a bearish signal.
==Colors==
The colors define the trend strength and define if current RSI is below zero line or above zero line.
GREEN: Strong up trend.
LIGHT GREEN: Weakening up trend. (Might indicate an up reversal)
RED: Strong down trend.
Light Red: Weakening down trend. (Might indicate a down reversal)
The Trick is that trend continues until the other way signal triggers, than we change color.
==Notes==
Bars are not colored by default.
From a few tests it seems to work better on higher time frames - 1 hour and above.
Each asset can have its own rhythm, adjust 'Tunnels look back' period in settings to meet the asset rhythm.
Quote which i like: “Minimizing downside risk while maximizing the upside is a powerful concept.” – Mohnish Pabrai
Enjoy and like if you like. :)
Follow for up coming indicators: www.tradingview.com

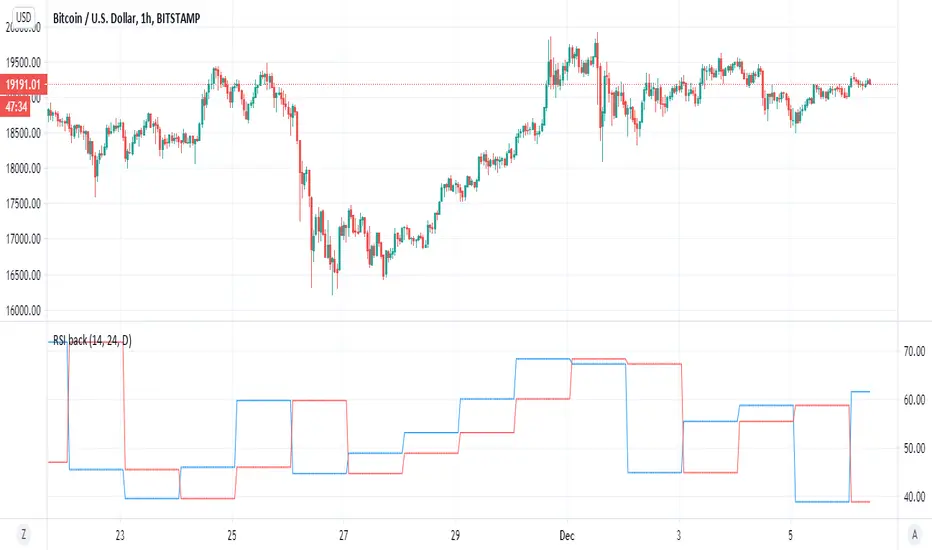
RSI backsimple indicator that based on difference between current RSI and past RSI (historic)
so lets say if take 1 hour chart then in a day there are 24 hour
so our RSI back if we put close will be the rsi of 24 hour before and this we compare it to the current rsi
if the current is above the past one then the signal is bullish , and vice versa. (similar logic to system of buy that based on close yesterday compare open of today)
so to this logic we can add no security MTF to make it nicer
blue line is current MTF RSI , red line is historic RSI based on the number of candles we choose
when blue over red is bullish ,red over blue is bearish
same on 4 hour mTF '1 hour chart and 24 candle back
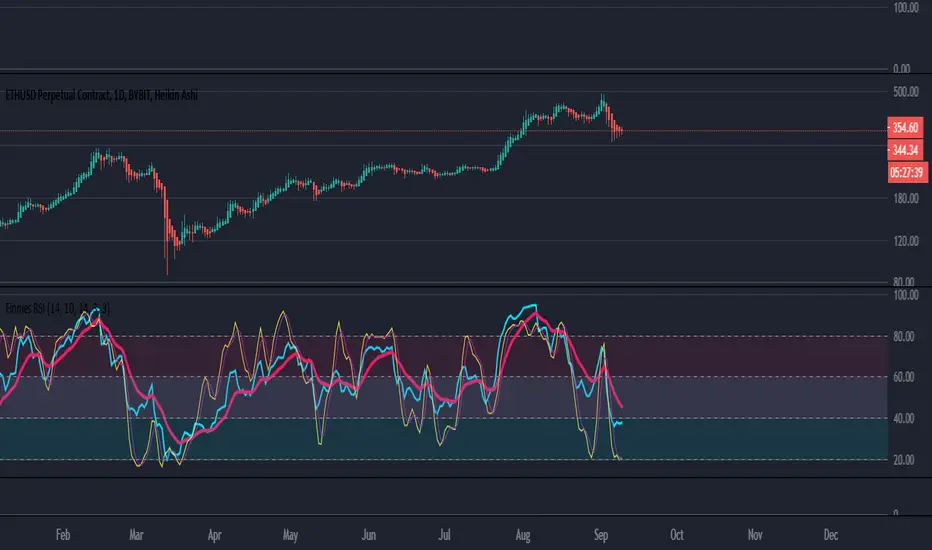
Finnie's RSI with EMA crossover + StochRSI seams to be one of the most used indicators by far, and that comes because of merit. With that in mind, the goal of this indicator is to expand upon the tradition RSI or Relative Strength Index we all know and love :) I started by adding an EMA crossover. Which gives you, the users, a general idea of when to buy and sell outside of just watching a line go down and up. To take thinks even further, I decided to add options for both Fast and Slow Stochastic oscillators. Adding STOCH brings in another variable when deciding on an entry, technically its a bit hard to explain but in practice it would go something like this: you notice RSI is down around the level 20 mark and RSI is crossing up above it's EMA, which is BULLISH signal, and you're thinking about going long. As a second confirmation you can look at the STOCH rsi, if it's also crossing above the previously spoken EMA that's another BULLISH signal. This process can be repeated once RSI has risen to find an exit.
EDIT: If you find the indicator is a bit too cluttered for you, feel free to disable the 'STOCH rsi' feature in settings :)
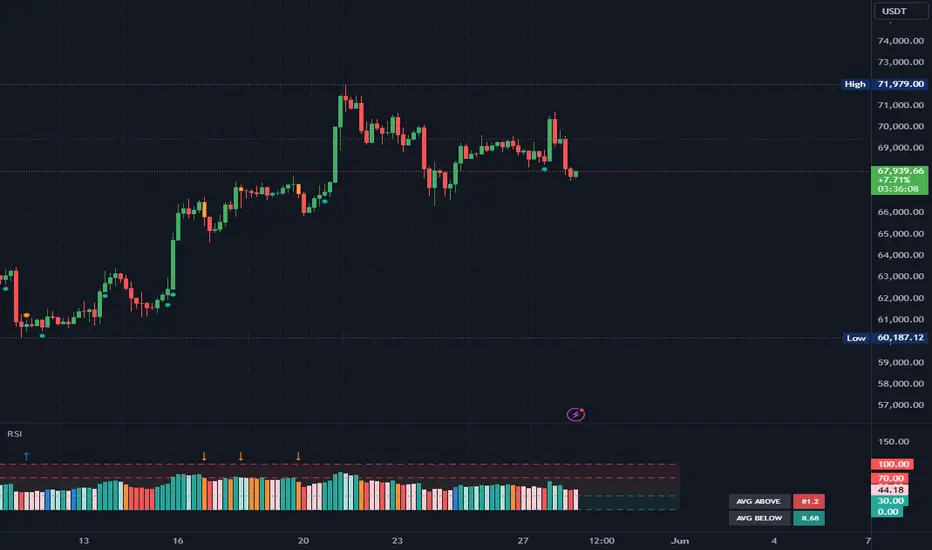
RSI HeatmapHeatmap showing version measurement lengths of RSI (user selectable)
For each bar on the chart, the script calculates RSI at that point for multiple RSI lengths (e.g. 3, 7, 14, 16 etc) and displays them vertically top to bottom, fastest RSI to slowest RSI respectively. It indicates the actual RSI reading (0 to 100) by way of a colour (green for overbought, red for oversold).
So for example, if the indicator shows a cluster of reds, you know that price is oversold on several RSI lengths simultaneously.
Idea was taken from an article.

RSI MTF by PeterOThis is my take on reaching Higher TimeFrame charts, what is usually helpful when determining the trend. On the example of RSI.
So imagine you want to check RSI from higher timeframe. 15x higher for example. There are 3 ways to do it.
1. security(tickerid,"15",rsi(close,14))
DON'T!!! I strongly advise against this method. Security() function is buggy in PineScript, leads to so-called "repainting" issues. Repainting is caused by creating leak from future data and leads to abnormally fantastic strategy backtest results like the one in Open Close Cross Strategy. Theoretically speaking if security() used correctly - with Pine version3 and barmerge.lookahead_off - you should encounter no repainting, but I could swear I saw scripts repaint even with security() implemented properly.
Even assuming security() implemented correctly will not repaint - it will create delay in your script. I'm using "15" multiplier in my example, and this means, I have to wait for 15 candles to close to produce indicators value. If a strong move happens in the meantime, I'm blind, because I have to wait anyway.
So for your own security, stay away from security() at all times.
2. rsi(close,14*15)
This will produce RSI plot with no delay, but a very flattened one. RSI will move between 45 and 45, never even reaching 30 or 70 levels. So pretty useless.
3. Dig-in-the-formula way.
Doing a bit more math produces RSI line, which is not delayed, not repainting and moving in full 0-100 RSI range. Actually - looking almost identical to the one from the higher timeframe. Which was the goal of this script.

RSI-buy forceThis indicator give you the buy and sell force of RSI .
in blue is volume based RSI ( I like better as it more smooth then regular RSI
the columns in green is when RSI strength go up , columns in red when RSI power go down
this way you see better the sell and buy power based on the rsi
I used the model of modelius volume and hybrid it with this rsi . so results look interesting

RSI + BB (EMA) + Dispersion (2.0)First version here
Initial data:
1) RSI
2) Bollinger Bands (Basis - EMA )
3) Dispersion (around basis)
Signal for purchase: RSI crosses the dispersion zone upwards
Signal for sale: RSI crosses the dispersion zone downwards
Buffer zone: white area, it is not recommended to make transactions.
--- Add ( 02.10.2018 )
1) RSI lines (overbought / oversold) = 70 / 30. Сan be changed in the settings.
2) Alerts:
• RSI line crossover Dispersion Zone (green)
• RSI line crossunder Dispersion Zone (red)

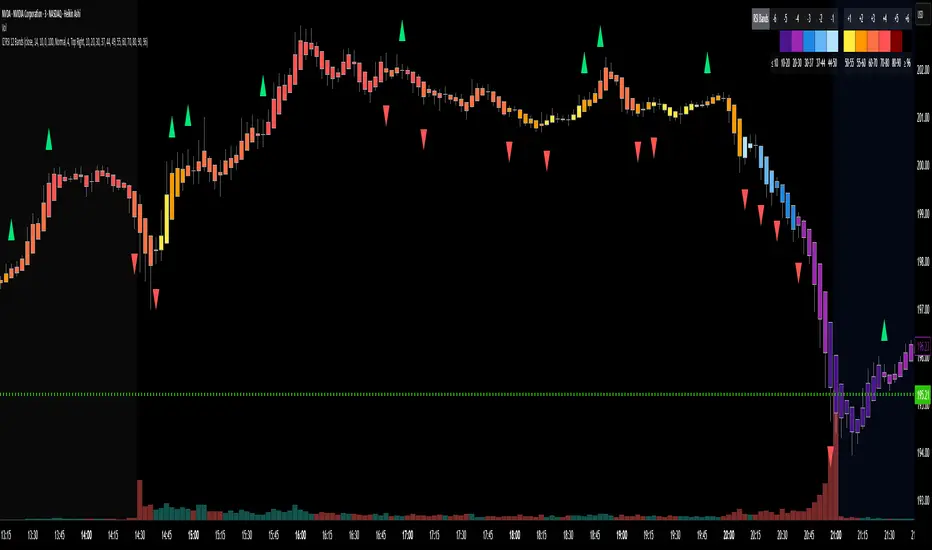
RSI Candle 12-Band SpectrumExperience RSI like never before. This multi-band visualizer transforms relative strength into a living color map — directly over price action — revealing momentum shifts long before traditional RSI signals.
🔹 12 Dynamic RSI Bands – A full emotional spectrum from oversold to overbought, colored from deep blue to burning red.
🔹 Adaptive Pulse System – Highlights every shift in RSI state with an intelligent fade-out pulse that measures the strength of each rotation.
🔹 Precision Legend Display – Clear RSI cutoff zones with user-defined thresholds and color ranges.
🔹 Multi-Timeframe Engine – Optionally view higher-timeframe RSI context while scalping lower frames.
🔹 Stealth Mode – Borders-only visualization for minimal chart impact on dark themes.
🔹 Complete Customization – Adjustable band levels, color palettes, and fade behavior.
🧠 Designed for professional traders who move with rhythm, not randomness.
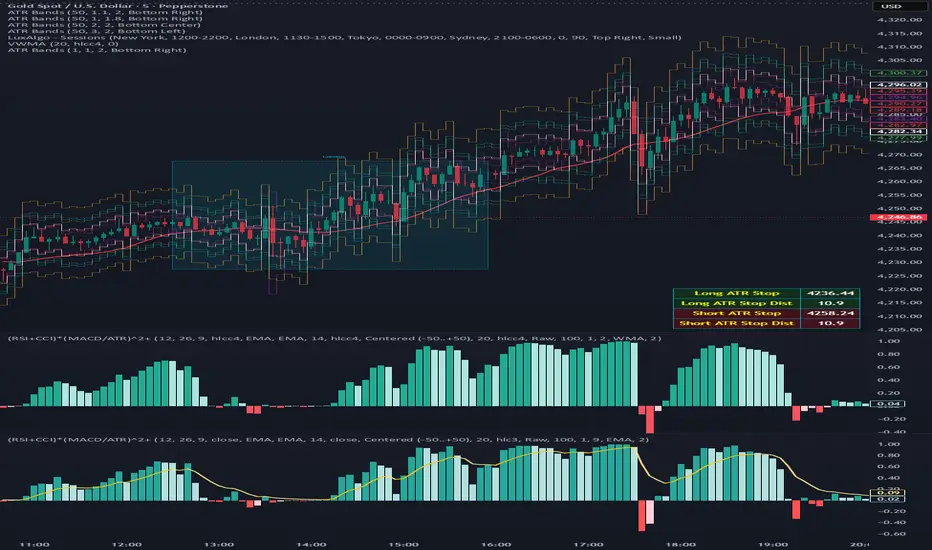
(RSI + CCI) × (MACD/ATR)^2⚙️ (RSI + CCI) × (MACD / ATR)² Composite — Normalized, Compressed, Dynamic Colors
This advanced composite oscillator merges three powerful momentum indicators — RSI, CCI, and MACD — into one normalized and volatility-adjusted signal that reacts smoothly across all markets.
By dividing MACD by ATR (Average True Range), the indicator self-scales for different symbols, and an optional tanh-like compression prevents extreme spikes while keeping the movement fluid and responsive.
🧩 Core Formula
(RSI + CCI) × (MACD / ATR)²
(optionally passed through a tanh compression for stability)
RSI and CCI are normalized (RSI ÷ 50, CCI ÷ 100) → roughly −2 to +2 range.
MACD is volatility-adjusted by ATR → scale-independent between assets.
The result is centered around 0 for clear bullish/bearish momentum comparison.
🎨 Visual Features
🟢🔴 Dynamic 4-Color Histogram
Positive + Rising = Strong Teal
Positive + Falling = Light Teal
Negative + Falling = Strong Red
Negative + Rising = Light Red
🟡⚫ 4-Color Smoothing Line
Positive & Rising = Bright Yellow
Positive & Falling = Soft Yellow
Negative & Rising = Grey
Negative & Falling = Dark Grey
Zero-centered layout for intuitive bullish/bearish visualization.
⚙️ Adjustable Parameters
Individual RSI, CCI, and MACD lengths and sources.
ATR length for volatility normalization.
Optional tanh-style compression with adjustable gain (to keep values in ±1 range).
Fully customizable colors and line widths for both bars and smoothing line.
🔔 Alerts
Triggered automatically when the composite crosses above or below zero, signaling potential trend reversals or momentum shifts.
💡 How to Use
Composite > 0 → Bullish momentum ↑
Composite < 0 → Bearish momentum ↓
A brightening line or bar = momentum accelerating.
A fading color = momentum weakening or reversal forming.
Combine with higher-timeframe trend filters (EMA, VWAP, Supertrend) for confirmation.
RSI HIGHs and LOWs MarkerThis indicator marks significant RSI (14) pivot points directly on the price chart.
Red markers above candles highlight confirmed RSI highs where the RSI value exceeded 75 (overbought zone).
Green markers below candles highlight confirmed RSI lows where the RSI value dropped below 25 (oversold zone).
These signals help traders quickly identify potential reversal zones and overextended market conditions without having to monitor the RSI window separately.

RSI mura visionOverview
The Enhanced RSI with Custom 40/60 Zones is a Pine Script™ v6 open-source indicator that builds on the classic Relative Strength Index by adding two additional horizontal levels at 40 and 60, alongside the standard 30/70. These extra zones help you identify early momentum shifts and distinguish trending markets from ranging ones with greater precision.
Key Features & Originality
* Custom Mid-Zones (40/60): Standard RSI signals can be noisy around the 50 midpoint. By marking 40 as a “weak momentum” threshold and 60 as a “strong momentum” confirmation, you get clearer entry and exit cues.
* Color-Coded Zones: The RSI line changes color when crossing 40, 50, 60, 70, and 30, letting you visually spot momentum acceleration or deceleration.
* Configurable Alerts: Built-in alert conditions fire when RSI crosses 40 or 60 in either direction, so you never miss a potential trend onset or exhaustion.
* Lightweight & Clean: No external dependencies, no look-ahead bias, and minimal repainting—ideal for both novice and professional traders.
How It Works
1. Momentum Decomposition: The standard 14-period RSI measures overbought/oversold extremes. Adding 40/60 lets you see when momentum shifts from neutral to bullish (crossing above 60) or bearish (dropping below 40) earlier than the classic 70/30 thresholds.
2. Trend Confirmation vs. Pullbacks: Readings between 40–60 often correspond to healthy pullbacks within a trend. A bounce off 40 suggests continuation; a rejection at 60 warns of a deeper pullback or reversal.
Usage & Inputs
* RSI Length (default 14): Period for calculating RSI.
* Level Inputs: Customize levels for overbought (70), support (60), neutral (50), weak (40), and oversold (30).
* Alert Toggles: Enable/disable alerts on each cross.
Why This Adds Value
* Early Signals: Capture trend beginnings before the market reaches extreme overbought/oversold levels.
* Noise Reduction: Filter sideways chop by watching the 40–60 corridor.
* Flexibility: Works on any timeframe or ticker.
Pine Script™ Version: v6
Open-Source License: MPL-2.0
Feel free to fork, modify, and share.

RSI + ADX + ATR Combo Indicator: RSI + ADX + ATR Combo Filter
This indicator is a confluence filter tool that combines RSI, ADX, and ATR into a single, easy-to-read chart overlay. It is designed to help traders identify low-volatility, non-trending zones with balanced momentum—ideal for strategies that rely on breakouts or reversals.
🔍 Core Components:
RSI (Relative Strength Index)
Standard RSI with custom upper and lower bounds (default: 60 and 40).
Filters out extreme overbought/oversold regions and focuses on price consolidation zones.
ADX (Average Directional Index)
Measures trend strength.
When ADX is below a custom threshold (default: 20), it indicates a weak or range-bound trend.
ATR (Average True Range)
Represents volatility.
Low ATR values (default threshold: 2.5) are used to filter out high-volatility environments, helping refine entries.
🟣 Signal Logic:
A signal is highlighted with a background color when all three conditions are met:
RSI is between lower and upper bounds (e.g., 40 < RSI < 60) ✅
ADX is below the trend threshold (e.g., ADX < 20) ✅
ATR is below the volatility threshold (e.g., ATR < 2.5) ✅
These combined conditions suggest a low-volatility, low-trend strength, and balanced momentum zone—perfect for anticipating breakouts or strong directional moves.

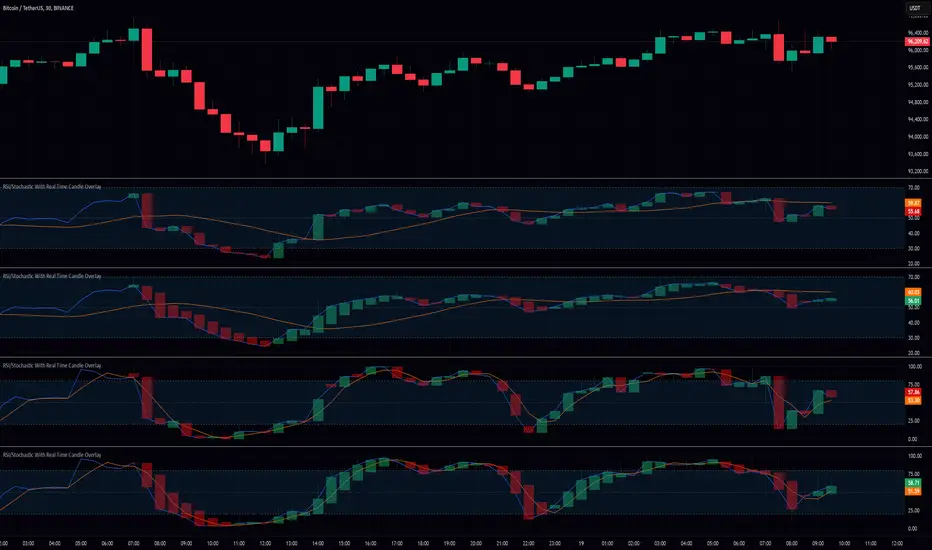
RSI/Stochastic With Real Time Candle OverlayThis indicator provides an alternative way to visualize either RSI or Stochastic values by representing them as candle bars in real time, allowing a more detailed view of momentum shifts within each bar. By default, it displays the standard historical plot of the chosen oscillator in the background, but once you are receiving real-time data (or if you keep your chart open through the close), it begins overlaying candles that track the oscillator’s intrabar movements. These candles only exist for as long as the chart remains open; if you refresh or load the chart anew, there is no stored candle history, although the standard RSI or Stochastic line is still fully retained. These candles offer insight into short-term fluctuations that are otherwise hidden when viewing a single line for RSI or Stochastic.
In the settings, there is an option to switch between standard candlesticks and Heiken Ashi. When Heiken Ashi is selected, the indicator uses the Heiken Ashi close once it updates in real time, producing a smoothed view of intrabar price movement for the oscillator. This can help identify trends in RSI or Stochastic by making it easier to spot subtle changes in direction, though some may prefer the unmodified values that come from using regular candles. The combination of these candle styles with an oscillator’s output offers flexibility for different analytical preferences.
Traders who use RSI or Stochastic often focus on entry and exit signals derived from crossing certain thresholds, but they are usually limited to a single reading per bar. With this tool, it becomes possible to watch how the oscillator’s value evolves within the bar itself, which can be especially useful for shorter timeframes or for those who prefer a more granular look at momentum shifts. The visual separation between bullish and bearish candle bodies within the indicator can highlight sudden reversals or confirm ongoing trends in the oscillator, aiding in more precise decision-making. Because the candle overlay is cleared as soon as the bar closes, the chart remains uncluttered when scrolling through historical data, ensuring that only the necessary real-time candle information is displayed.
Overall, this indicator is intended for users who wish to track intrabar changes in RSI or Stochastic, with the added choice of standard or Heiken Ashi candle representation. The real-time candle overlay clarifies short-lived fluctuations, while the standard line plots maintain the usual clarity of past data. This approach can be beneficial for those who want deeper insights into how oscillator values develop in real time, without permanently altering the simplicity of the chart’s historical view.