Cerca negli script per "rsi"


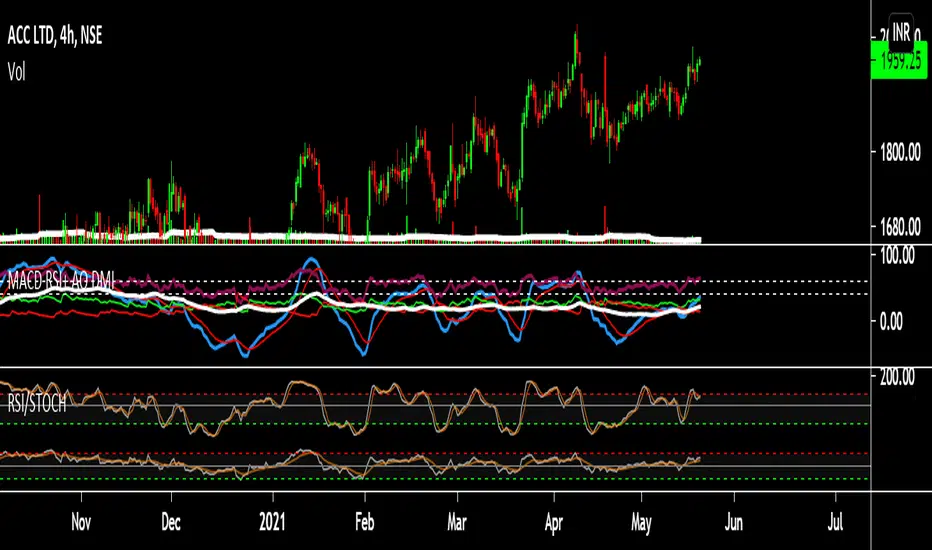
RSI MTF TableRSI MTF covers the timeframes 1m, 5m, 15m, 1H, 4H and Daily
Works on any intraday chart and appears in bottom left of screen
Can customise colors and transparency

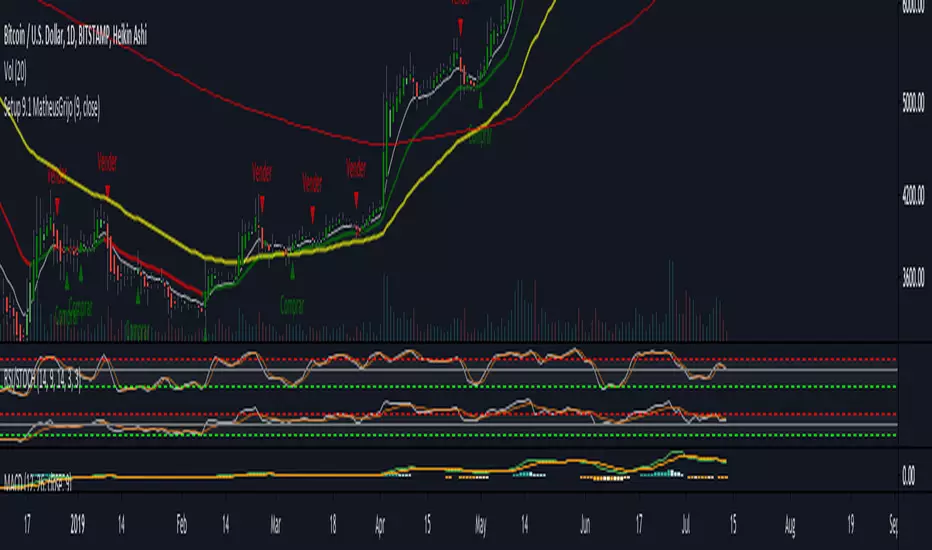
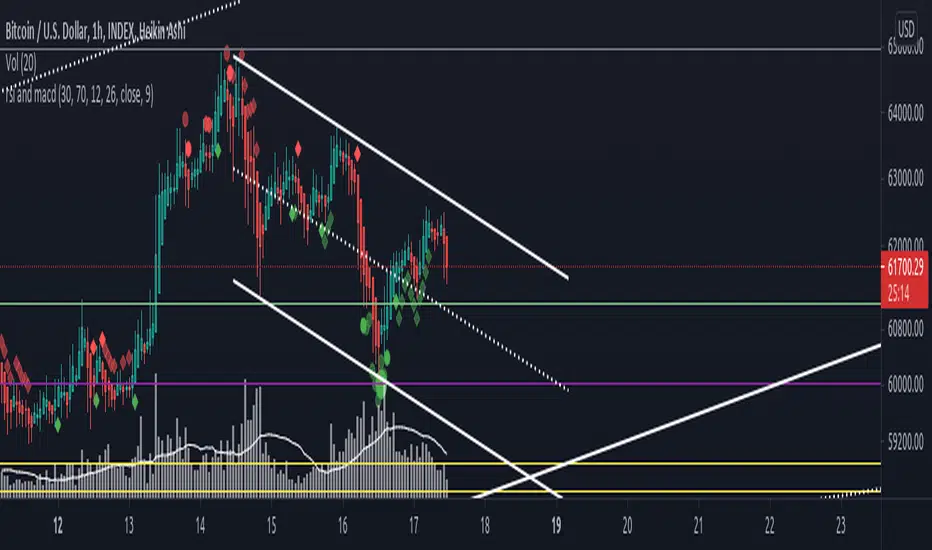
rsi and macdRSI and MACD in the chart:
- small circles -> oversold/overbought
- big circles -> oversold/overbought rising/falling
- small diamonds -> macd over/under signal with macd over/under zero
Please comment if you have an idea to improve it ;)

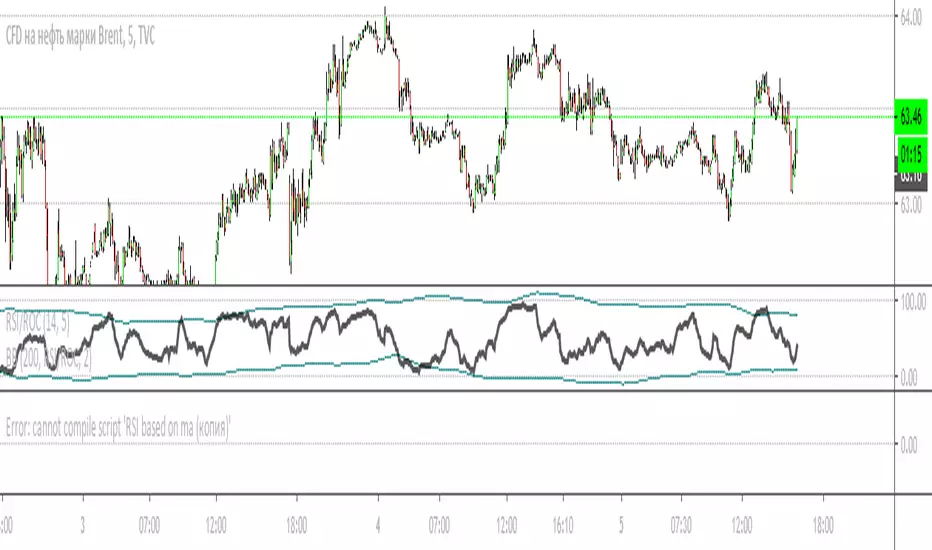
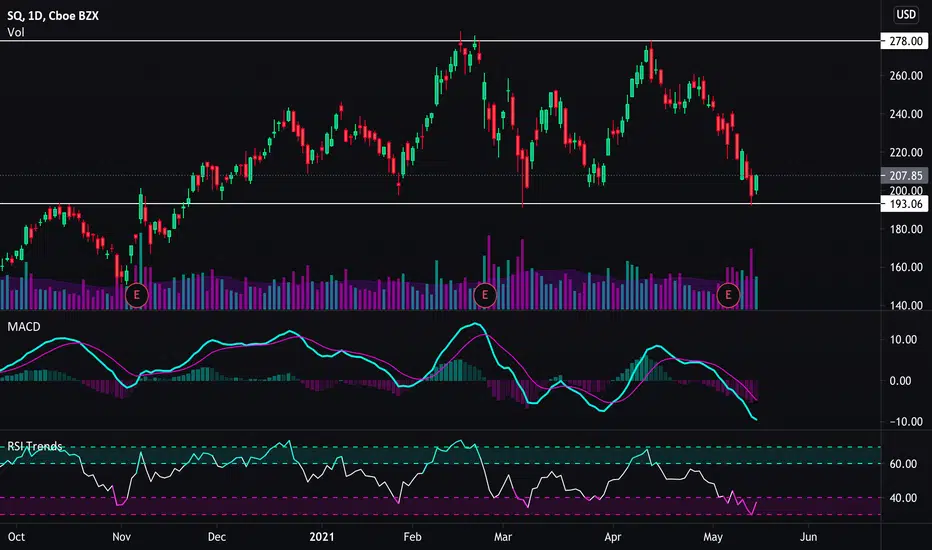
RSI BAR COLOR (KETT)RSI BAR COLOR
1) White - looking for a long
2) Orange - looking for a short
3) Gray - think
//-----------
1) Белый - ищем вход в LONG
2) Оранжевый - ищем вход в SHORT
3) Серый - думаем
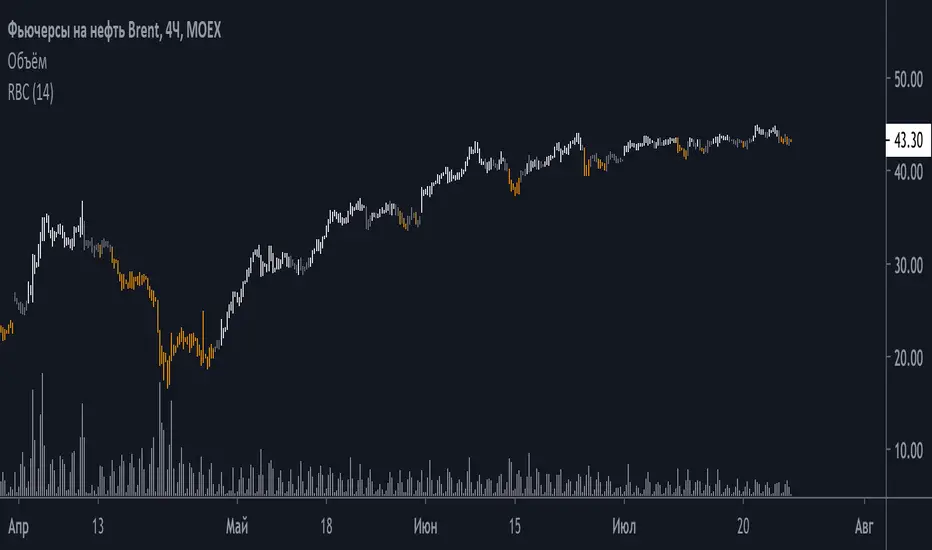
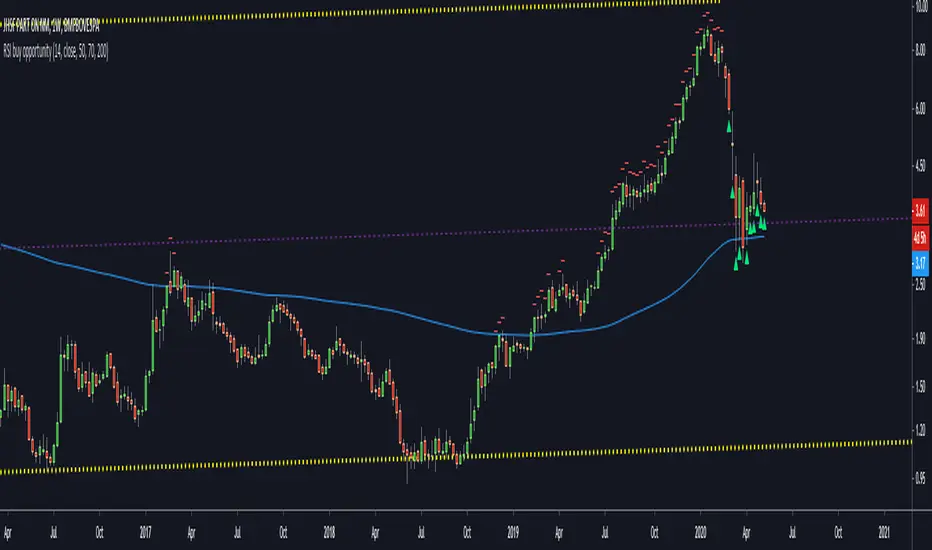
RSI buy opportunityRSI buy opportunity is an indicator to look for the best entries on weekly charts.
It depends on each stock and the values should change to optimize the entry.
Buy when green triangle shows up.
Never buy when red signal appears.