Multi-Timeframe RSIRSI Divergence (Time-Based Engine)
This script is a powerful and highly customizable tool designed to automatically detect and display RSI divergences from up to three independent, user-defined timeframes directly on your chart. It eliminates the need to manually switch between timeframes to find these critical trading signals, allowing you to see long-term and short-term divergences all in one place.
The engine is built to be flexible, supporting both regular (reversal) divergences and hidden (trend-continuation) divergences. It's designed for traders who rely on divergence analysis as a core part of their strategy.
Key Features
Multi-Timeframe (MTF) Analysis: Configure and display divergences from up to three different timeframes simultaneously (e.g., show 4-Hour, Daily, and Weekly divergences on your 1-Hour chart). Each timeframe operates independently with its own settings.
Regular & Hidden Divergence: The script can detect both standard regular divergences that signal potential reversals and hidden divergences that suggest a trend may continue.
Configurable Pivot Strength: You have full control over the sensitivity of pivot detection. The 'Left Strength' and 'Right Strength' settings allow you to define what qualifies as a significant price pivot, filtering out market noise.
Bar Count Filter: Refine your signals by setting the minimum and maximum number of bars allowed between two pivots. This ensures you only see divergences that fit your specific strategic timeframe.
Dedicated Alerts: Each of the three timeframes has its own "Enable Alerts" toggle. When a new divergence line is drawn on the chart for a specific timeframe, a corresponding alert can be triggered, ensuring you never miss a potential setup.
Full Visual Customization: Tailor the look and feel of the indicator to your preference. Each timeframe has unique color settings for its bullish and bearish lines, allowing for easy visual identification. You can also toggle the visibility of various chart markers to keep your view clean.
How to Use
1. Add the indicator to your chart.
2. Open the Settings panel.
3. For each timeframe you wish to use (1, 2, or 3), check the "Enable Timeframe" box.
4. Select the desired Timeframe, RSI Length, and Pivot Strength for each active engine.
5. Adjust the Min/Max Bars filter to match your trading style.
6. If you want to receive notifications, check the "Enable Alerts" box for the desired timeframe(s). Then, create an alert using TradingView's alert manager, selecting the indicator and choosing the "Any alert() function call" option.
Cerca negli script per "rsi"

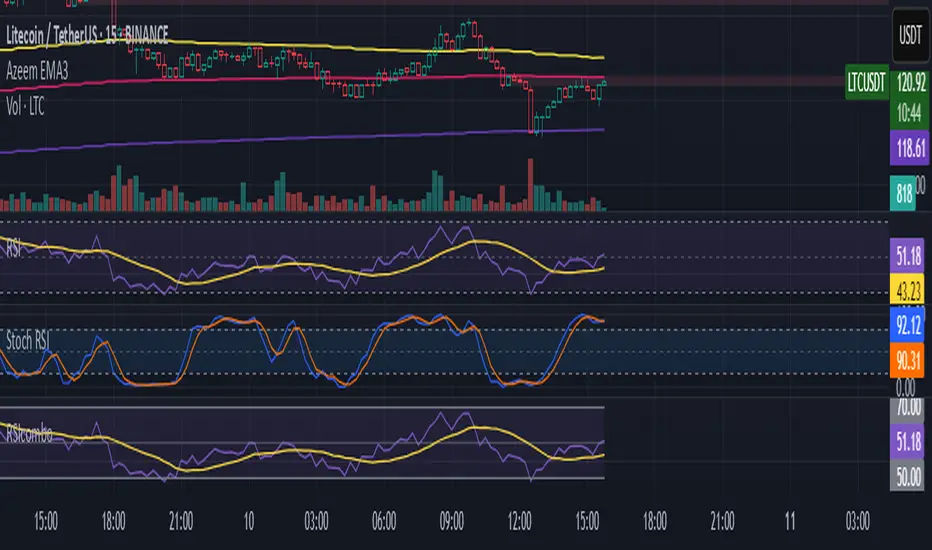
RSI/Stoch RSI ComboIt shows both rsi and stoch rsi as one indicator. You need to select which one using checkbox.
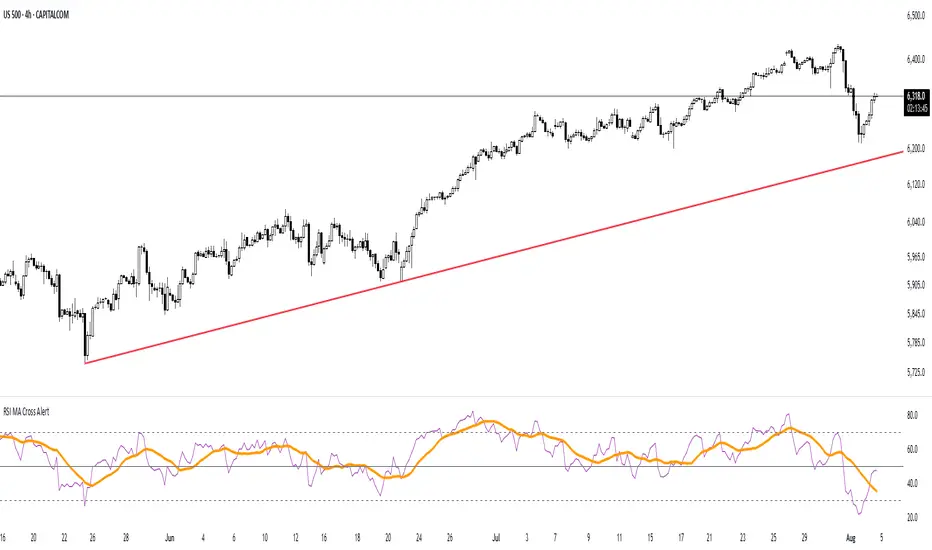
RSI MA Cross AlertAlerts when RSI-based Moving Average crosses above 50. Can be used on any symbol and timeframe. Displays RSI, RSI-MA, and levels 30/50/70.
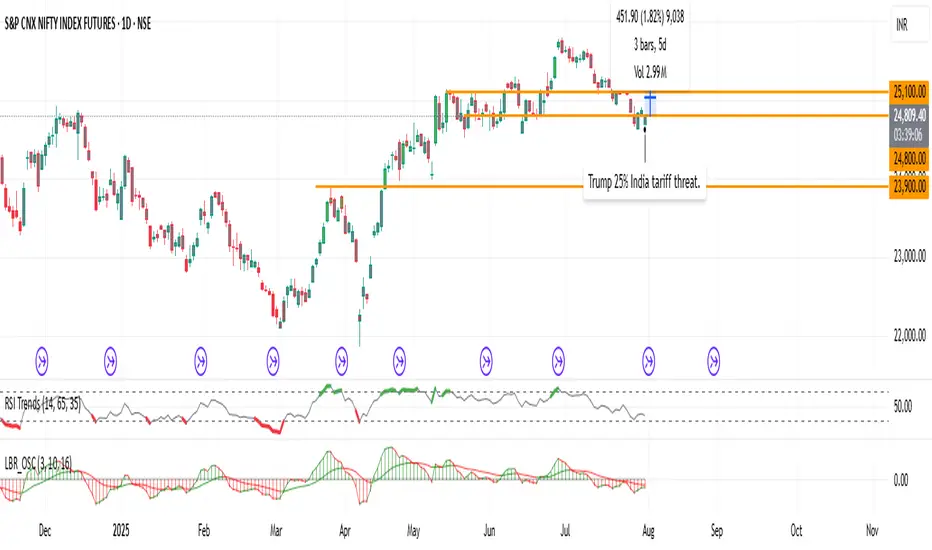
RSI TrendsColor chart with RSI colors
Simple RSI which colors green candle when RSI above 65, red when below 35 and grey when in between.
RSI + VWAP Strategy by vipindaskr🔍 This script combines RSI and VWAP for intraday trend-based entries.
✅ *Buy Signal:*
- Price above VWAP
- RSI > 60
- Green background + up triangle shown
❌ *Sell Signal:*
- Price below VWAP
- RSI < 40
- Red background + down triangle shown
📈 Ideal for Nifty 50 intraday traders using 5-minute chart.
Developed by vipindaskr 💻

RSI Mansfield +RSI Mansfield+ – Adaptive Relative Strength Indicator with Divergences
Overview
RSI Mansfield+ is an advanced relative strength indicator that compares your instrument’s performance against a configurable benchmark index or asset (e.g., Bitcoin Dominance, S&P 500). It combines Mansfield normalization, adaptive smoothing techniques, and automatic detection of bullish and bearish divergences (regular and hidden), delivering a comprehensive tool for assessing relative strength across any market and timeframe.
Originality and Motivation
Unlike traditional relative strength scripts, this indicator introduces several distinctive improvements:
Mansfield Normalization: Scales the ratio between the asset and the benchmark relative to its moving average, transforming it into a normalized oscillator that fluctuates around zero, making it easier to spot outperformance or underperformance.
Adaptive Smoothing: Automatically selects whether to use EMA or SMA based on the market type (crypto or stocks) and timeframe (intraday, daily, weekly, monthly), avoiding manual configuration and providing more robust results under varying volatility conditions.
Divergence Detection: Identifies four types of divergences in the Mansfield oscillator to help anticipate potential reversal points or trend confirmations.
Multi-Market Support: Offers benchmark selection among major crypto and global stock indices from a single input.
These enhancements make RSI Mansfield+ more practical and powerful than conventional relative strength scripts with static benchmarks or without divergence capabilities.
Core Concepts
Relative Strength (RS): Compares price evolution between your asset and the selected benchmark.
Mansfield Normalization: Measures how much the RS deviates from its historical moving average, expressed as a scaled oscillator.
Divergences: Detects regular and hidden bullish or bearish divergences within the Mansfield oscillator.
Timeframe Adaptation: Dynamically adjusts moving average lengths based on timeframe and market type.
How It Works
Benchmark Selection
Choose among over 10 indices or market domains (BTC Dominance, ETH Dominance, S&P 500, European indices, etc.).
Ratio Calculation
Computes the price-to-benchmark ratio and smooths it with the adaptive moving average.
Normalization and Scaling
Transforms deviations into a Mansfield oscillator centered around zero.
Dynamic Coloring
Green indicates relative outperformance, red signals underperformance.
Divergence Detection
Automatically identifies bullish and bearish (regular and hidden) divergences by comparing oscillator pivots against price pivots.
Baseline Reference
A clear zero line helps interpret relative strength trends.
Usage Guidelines
Benchmark Comparison
Ideal for traders analyzing whether an asset is outperforming or lagging its sector or market.
Divergence Analysis
Helps detect potential reversal or continuation signals in relative strength.
Multi-Timeframe Compatibility
Can be applied to intraday, daily, weekly, or monthly charts.
Interpretation
Oscillator >0 and green: outperforming the benchmark.
Oscillator <0 and red: underperforming.
Bullish divergences: potential relative strength reversal to the upside.
Bearish divergences: possible loss of momentum or reversal to the downside.
Credits
The concept of Mansfield Relative Strength is based on Stan Weinstein’s original work on relative performance analysis. This script was built entirely from scratch in TradingView Pine Script v6, incorporating original logic for adaptive smoothing, normalized scaling, and divergence detection, without reusing any external open-source code.

RSI Divergence Indicator - Trading VidhyalayaThis indicator automatically identifies RSI-based bullish and bearish divergences and visually marks them directly on the candlestick chart, making it easier for traders to spot potential reversals.
✅ Key Features:
Bullish Divergence
When the price makes a lower low, but the RSI makes a higher low, the indicator highlights the candle with a green arrow or label to signal potential upward reversal.
Bearish Divergence
When the price makes a higher high, but the RSI forms a lower high, the indicator marks the candle with a red arrow or label to indicate a possible downside move.
Real-time Detection
Divergences are plotted in real-time, helping traders react quickly to changing market conditions.
Candlestick Overlay
Signals are shown directly on the chart, rather than below in a separate panel, allowing for faster and clearer decision-making.
📊 Benefits:
Helps in identifying early trend reversals
Works well with other indicators like MACD, Moving Averages, or Volume
Great for both beginners and advanced traders
Saves time by automating divergence spotting, reducing manual errors

RSI MACD Combined Color StrategyOverview
This indicator combines RSI and MACD signals to create a powerful visual trading system, inspired by TrendSpider's AI Strategy Coder examples. It colors candles based on the alignment of three key technical conditions, providing clear visual signals for potential trend strength and direction.
Technical Components
Core Conditions
RSI (Relative Strength Index) > 50
Indicates bullish momentum when price is trading above the centerline
Traditional indicator of trend strength
MACD Line > Signal Line
Shows positive momentum
Classic signal for potential upward movement
MACD Line > 0
Confirms bullish territory
Indicates overall positive momentum
Color Coding System
🟢 Green Candles: All three conditions are met
Strongest bullish signal
Suggests high probability trading opportunities
⚪ Grey Candles: One or two conditions are met
Neutral or transitioning market
Suggests caution or waiting for stronger confirmation
🔴 Red Candles: No conditions are met
Bearish signal
Suggests potential downward pressure
How to Use This Indicator
For Entry Signals
Look for transitions from red or grey to green candles
Green candles suggest strong bullish alignment
Consider entering long positions when candles turn green
For Exit Signals
Watch for color transitions from green to grey or red
Consider taking profits when candles change from green to grey
Consider stop losses when candles turn red
Risk Management
Use color transitions as part of your broader strategy
Don't rely solely on color changes for trading decisions
Combine with other technical analysis tools and risk management practices
Customizable Parameters
RSI Length (default: 14)
MACD Fast Length (default: 12)
MACD Slow Length (default: 26)
MACD Signal Length (default: 9)
Best Practices
Use multiple timeframes for confirmation
Look for confluences with support/resistance levels
Consider volume and market context
Start with default settings and adjust based on your trading style
Backtest different parameter combinations
Notes
This indicator works best in trending markets
Grey candles can indicate transition periods
Consider market conditions and volatility when interpreting signals
Credits
Inspired by TrendSpider's AI Strategy Coder examples and adapted for TradingView using Pine Script v5.
Disclaimer
This technical indicator is for informational purposes only. Always conduct your own analysis and consider risk management principles before making trading decisions. Past performance does not guarantee future results.

RSI/MFI Ultimate MAHello!
Today, I want to discuss a special indicator that I've developed. centers around a weighted moving average based on RSI/MFI.
1. Development Purpose
The primary goal of this indicator is to provide clearer insights into bullish and bearish signals in the market. It applies a weight to the RSI (Relative Strength Index) and MFI (Money Flow Index) values to offer more sensitive and predictive trend signals than traditional moving averages.
2. Usefulness
This indicator aids traders in identifying market volatility and bullish or bearish trends more easily. It is particularly responsive to market volatility, providing more accurate information for trading decisions.
3. Real-World Usage Examples
When applied to actual market data, this indicator clearly delineates bullish or bearish sections with its weighted moving average line. For instance, an upward trending moving average line indicates a bullish signal, while a downward trend suggests bearish momentum.
4. Meaning of Parameter Values
option: Allows choosing between RSI or MFI, each analyzing different market signals.
osc_len: Adjusting the oscillator length alters sensitivity.
ma_len: Setting the moving average length helps to modulate responsiveness to market fluctuations.
weight: Changing the weight fine-tunes the sensitivity of the moving average line.
By adjusting these parameters, the indicator can be customized to suit various market conditions.
Wishing you a successful trading day. Thank you!

RSI + Fibonacci HH LL Support Resistance I have integrated my past scripts and brushed them up further.
This tool allows for support/resistance, stop loss, take profit, and trend analysis using RSI and Fibonacci ratios.
For example, the Fibonacci ratio is used as follows
l1 = m - dist * 0.618
l2 = m - dist * 1.618
l3 = m - dist * 2.618
l4 = m - dist * 4.235
l5 = m - dist * 6.857
l6 = m - dist * 11.089
When the Fibonacci ratio reaches 2.618 or higher and the RSI smoothed by the 5-day EMA is oversold/overbought, the bar color is changed by a gradation.
We have tried to make the design as beautiful and good-looking as possible. You can also hide the lines to suit your own preference.
Example usages are here:
BTCUSDT 1Hour Chart
Using Fibonacci numbers
BTCUSDT 15min Chart, for Scalping
Here, to set the highest and lowest prices one hour ago, "4" is substituted as the calculation: 15 minutes x 4 = 60
BTCUSDT 15min Chart, for Scalping
To set the highest and lowest prices 4 hours ago , "4" is substituted as the calculation: 15 minutes x 16 = 240
BTCUSDT 15min Chart, for Scalping
To draw yesterday's high and low as support/resistance lines, I substituted the number "96" as 1440/15=96.
BTCUSDT 1min Chart, for Scalping
Substituted "60" to trail the highest and lowest prices over a 60-minute period on a 1-minute chart, and removed lines to beautify
BTCUSDT 1day Chart, for Long-Term Investers
This is an example of using "90" because it is a 1-day chart and assumes that 3 months = 90 days in order to trail the highest and lowest prices over a 3-month period and no lines.
My past scripts are here:
RSI + FIB HH LL StopLoss Finder/Contrarian Trades
Fibonacci HH LL TRAMA Band

RSI Momentum Trend ScreenerIntroducing The RSI Momentum Trend Screener, to have the ability to scan 40 symbols at once
The screener is based on RSI Momentum Trend Indicator
It will show Positive Or Negative based on the symbol condition.
You can change the values on the screener, symbols, activate/disable symbols and change table position and color

RSI Divergence Screener by zdmreThis screener tracks the following for up to 20 assets:
-All selected tickers will be screened in same timeframes (as in the chart).
-Values in table indicate that how many days passed after the last Bullish or Bearish of RSI Divergence.
For example, when BTCUSDT appears Bullish-Days Ago (15) , Bitcoin has switched to a Bullish Divergence signal 15 days ago.
Thanks to @QuantNomad and @MUQWISHI for building the base for this screener.
*Use it at your own risk
Note:
Screener shows the information about the RSI Divergence Scanner by zdmre with default settings.
Based indicator:

RSI with Keltner Channel (+EMA Ribbon)Note that the EMA Ribbon is not embedded into the custom RSI with KC. In the future I plan to embed it. The EMA Ribbon I use is the following:
This is my very first attempt at modifying an indicator. I basically attempted to add a Keltner Channel around RSI.
This was used as an alternative channel to the standard Bollinger Band. KC goes hand-in-hand with the EMA Ribbon. KC also helps to better pinpoint relative-overbought/oversold conditions.
In my belief, the 20-80 levels don't behave as overbought/oversold levels. An exponential chart would always be overbought. So a Keltner Channel could in theory (and in practice) give us greater understanding on chart analysis.
This custom indicator is a bodge . It has lots of extra calculations that can be removed. I post this rough indicator for the community to give feedback on how I can improve it, or perhaps give an idea to some of you. Please don't judge me, I wouldn't post it but lately some have asked me about it.
In the future I would like to embed an EMA ribbon in this RSI indicator, just like I did in the following idea.
During this period, I don't really have the time to fix this indicator to my standards. So I will leave it as is for the foreseeable future.
If you have the will and knowledge however, feel free to built upon this indicator and share it!
Tread lightly, for this is hallowed ground.
-Father Grigori
PS. In this indicator, I would replace all the moving averages with an EMA Ribbon "average".

RSI Impact Heat Map [Trendoscope]Here is a simple tool to measure and display outcome of certain RSI event over heat map.
🎲 Process
🎯Event
Event can be either Crossover or Crossunder of RSI on certain value.
🎯Measuring Impact
Impact of the event after N number of bars is measured in terms of highest and lowest displacement from the last close price. Impact can be collected as either number of times of ATR or percentage of price. Impact for each trigger is recorded separately and stored in array of custom type.
🎯Plotting Heat Map
Heat map is displayed using pine tables. Users can select heat map size - which can vary from 10 to 90. Selecting optimal size is important in order to get right interpretation of data. Having higher number of cells can give more granular data. But, chart may not fit into the window. Having lower size means, stats are combined together to get less granular data which may not give right picture of the results. Default value for size is 50 - meaning data is displayed in 51X51 cells.
Range of the heat map is adjusted automatically based on min and max value of the displacement. In order to filter out or merge extreme values, range is calculated based on certain percentile of the values. This will avoid displaying lots of empty cells which can obscure the actual impact.
🎲 Settings
Settings allow users to define their event, impact duration and reference, and few display related properties. The description of these parameters are as below:
🎲 Use Cases
In this script, we have taken RSI as an example to measure impact. But, we can do this for any event. This can be price crossing over/under upper/lower bollinger bands, moving average crossovers or even complex entry or exit conditions. Overall, we can use this to plot and evaluate our trade criteria.
🎲 Interpretation
Q1 - If more coloured dots appear on the top right corner of the table, then the event is considered to trigger high volatility and high risk environment.
Q2 - If more coloured dots appear on the top left corner, then the events are considered to trigger bearish environment.
Q3 - If more coloured dots appear on the bottom left corner of the chart, then the events are considered insignificant as they neither generate higher displacement in positive or negative side. You can further alter outlier percentage to reduce the bracket and hence have higher distribution move towards
Q4 - If more coloured dots appear on the bottom right corner, then the events are considered to trigger bullish environment.
Will also look forward to implement this as library so that any conditions or events can be plugged into it.

RSI Pull-BackA pull-back occurs whenever the price or the value of an indicator breaks a line and comes back to test it before continuing in the prevailing trend.
The RSI has oversold and overbought levels such as 20 and 80 and whenever the market breaks them returns to normality, we can await a pull-back to them before the reversal continues.
This indicator shows the following signals:
* A bullish signal is generated whenever the RSI surpasses the chosen oversold level then directly shapes a pull-back to it without breaking it again.
* A bearish signal is generated whenever the RSI breaks the chosen overbought level then directly shapes a pull-back to it without surpassing it again.

RSI + Stothis one can be used for over-bought and oversold
1d time frame is the best time frame for using this indicator
RSI measures the speed and magnitude of a security's recent price changes to evaluate overvalued or undervalued conditions in the price of that security.
The RSI can do more than point to overbought and oversold securities. It can also indicate securities that may be primed for a trend reversal or corrective pullback in price. It can signal when to buy and sell. T
traditionally, an RSI reading of 70 or above indicates an overbought situation. A reading of 30 or below indicates an oversold condition.

RSI + Moving AverageSimple regular RSI Indicator that plots a Moving Average (Hull, SMA, EMA, RMA, etc) that you specify the MA and length.
Contains Over Bought and Over Sold areas that you can customize color and zone.
Plots signals of the RSI crossing up over the over sold area or down below the over bought area.
Plots crosses of the RSI crossing the Moving Average.

RSI Divergence Scanner by zdmreDivergence is when the price of an asset is moving in the opposite direction of a technical indicator, such as an oscillator, or is moving contrary to other data. Divergence warns that the current price trend may be weakening, and in some cases may lead to the price changing direction.
If the stock is rising and making new highs, ideally the RSI is reaching new highs as well. If the stock is making new highs, but the RSI starts making lower highs, this warns the price uptrend may be weakening. This is negative divergence.
Positive divergence is the opposite situation. Imagine the price of a stock is making new lows while the RSI makes higher lows with each swing in the stock price. Investors may conclude that the lower lows in the stock price are losing their downward momentum and a trend reversal may soon follow.
Divergence is one of the common uses of many technical indicators, primarily the oscillators.
Use it at your own risk

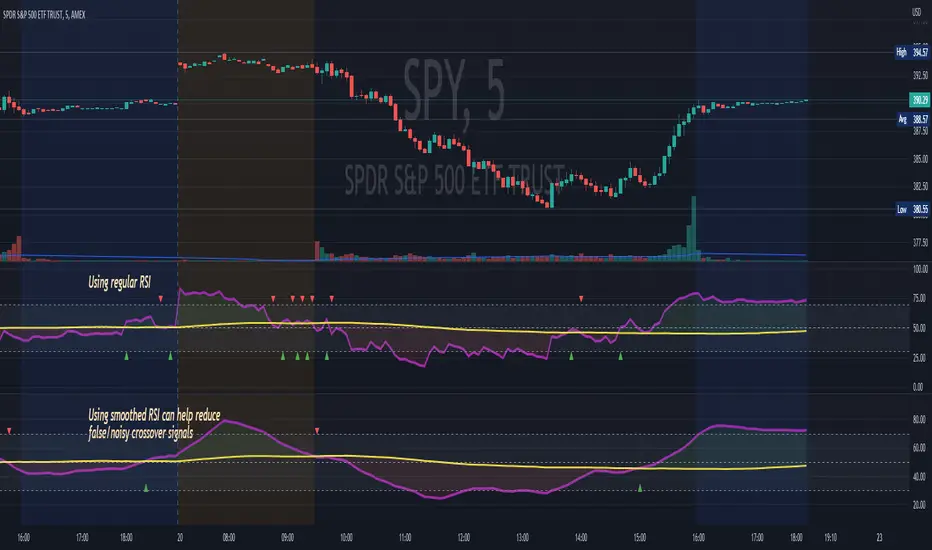
RSI MA CrossBuilding onto the standard RSI indicator, with the following modification and improvements:
- Added signals for RSI moving average crossovers, which usually indicator a bull or bear trend
- Added option to use smoothed RSI line
- Added alert for crossover signals
Enjoy~~~!
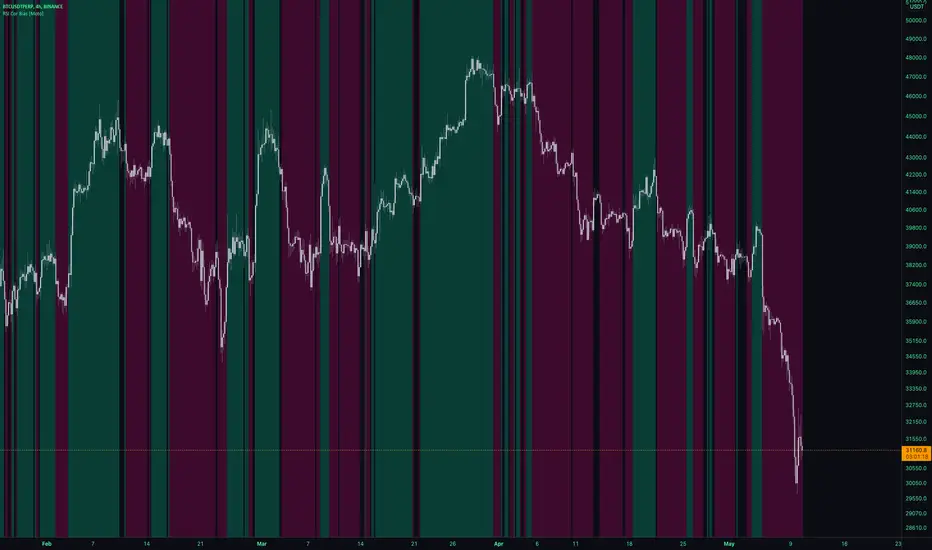
RSI Cor Bias [Moto]Hello traders,
This is a pretty simple script. It gives a background directional bias color respective to RSI levels from input thresholds in the settings. Users can choose the upper and lower thresholds and the symbol that the RSI is from.
For example, by default, the upper threshold is 52 and the lower 48. If Bitcoins RSi is above 52, the background color will be green, below 48 it's pink, between and no color will be applied.
Generally, buying should be occurring in pink to green transition or in green, and conversely selling should be occurring in green to pink transition or in pink.
Thanks,
Moto
RSI Swing Trading Setup (2-Period)A simple script that adjusts the RSI visibly in order to better accommodate swing trading and certain swing trading setups/strategies.
--------------------------------------------------------------------------------------------------------------------------------------------------------
Best used in conjunction with "Linear Regression Channel by LonesomeTheBlue" with 2.2σ (std.dev) and Show Fib Levels.
^Click image for a redirect to that script.
--------------------------------------------------------------------------------------------------------------------------------------------------------
In certain price action patterns:
A bearish reversal from a previously bullish move can indicate tops of a rally if the RSI moves from 0-40 to 60 (1)
A bullish reversal from a previously bearish move can indicate bottoms of a pullback if the RSI moves from 60-100 to 40 (2)
(USE THE LINEAR REGRESSION CHANNEL TO VALIDIFY THE RETRACEMENTS)
--------------------------------------------------------------------------------------------------------------------------------------------------------
(1)
--------------------------------------------------------------------------------------------------------------------------------------------------------
(2)
--------------------------------------------------------------------------------------------------------------------------------------------------------

RSI true swingsRelative Strength Index (RSI) is being used by majority of the traders to get benefitted based on the swings. But these swings are hard to Identify.
This Indicator uses 4 major factors for finding the potential reversal points:
RSI Crossover or crossunder
Relative volume
Overall volume against the moving average volume
Relative closing of the candles
Size of the bars
Please read Instructions carefully before using this indicator
Recommended entry is the OHLC4 of the signal bars.
If signal bar is too large, try to enter in the retracement when another signal comes either through indicator or through types of bars
when signals comes opposite to the trend, then try to wait for the next signal of same type. This creates a RSI-price divergence in confirmation by volume price action
Timeframe can be of your choice
Recommended stoploss should be swing highs or lows

RSI Divergences + Bollinger Bands█ OVERVIEW
Here's the RSI divergences with Bollingers bands.
█ CONCEPTS
5 features
1 — RSI
2 — Bollinger bands
3 — RSI signal is in another color when above 70 or below 30
4 — Looking for previous Divergences, Bullish, Bearish and Hidden Bullish and Bearish but I don't like Hidden divergences
5 — Color fill when overbuy or oversold
█ OTHER SECTIONS
I like to see it like a moutain, with snow on top and lake on bottom. I think you don't want to start walking at the top, nor sink to the bottom of the lake for ever and ever.
It is an idea of sjoerd , tip him if you like it.
An oscillator is good to know where we are in the trends, but it's not enough to run a small business of trading, you need to learn how to use it.
What is a divergence ?
Thanks to The rational investor for teaching me how to use this indicator.