TMB Invest - Smart Money Concept StrategyEnglish:
**Quick Overview**
The "TMB_SMC_Strategy_v1.1.3" combines a classic trend filter using two EMAs with contrarian RSI entries and simple SMC elements (Fair Value Gaps & Order Blocks). Stop-loss and take-profit orders are volatility-adaptive and controlled via the ATR. An integrated dashboard displays the setup status, stop-loss/take-profit levels, entry reference, and trend, RSI, and ATR values.
---
## Operating Principle
1. **Trend Filter:** A fast EMA (default 50) is compared to a slow EMA (default 200). Trading occurs only in the direction of the trend: long in uptrends, short in downtrends.
2. **Timing via RSI:** Contrarian entries within the trend. Go long when the RSI is below a buy level (default 40); Short when the RSI is above a sell level (standard 60).
3. **Structure Check (SMC Proxy):** An "FVG Touch" serves as additional confirmation that an inefficient price zone has been tested. Order blocks are visualized for guidance but are not a direct entry trigger.
4. **Risk Management via ATR:** Stop-loss and take-profit levels are set as multipliers of the current ATR (e.g., SL = 1×ATR, TP = 2×ATR). This allows target and risk distances to adjust to market volatility.
5. **Simple Position Logic:** Only one position is held at a time (no pyramiding). After entry, stop and limit orders (bracket exit) are automatically placed.
---
## Input Values
* **EMA Fast / EMA Slow:** Lengths of the moving averages for the trend filter.
* **RSI Length / Levels:** Length of the RSI as well as buy and sell thresholds (contra signals within the trend direction).
* **Take Profit (RR) / Stop Loss (RR):** ATR multipliers for TP and SL.
* **Show FVGs & Order Blocks:** Toggles the visual SMC elements (zones/boxes) on or off.
--
## Signals & Execution
* **Long Setup:** Uptrend (fast EMA above slow EMA) **and** RSI below the buy level **and** a current FVG signal in a bullish direction.
* **Short Setup:** Downtrend (fast EMA below slow EMA) **and** RSI above the sell level **and** a current FVG touch in a bearish direction.
* **Entry & Exit:** If the setup is met, the market is entered; stop-loss/take-profit orders are placed immediately according to ATR multiples.
--
## Visualization
* **EMAs:** The fast and slow EMAs are plotted to illustrate the trend.
* **FVGs:** Fair Value Gaps are drawn as semi-transparent boxes in the trend color and projected slightly into the future.
* **Order Blocks:** Potential order block zones from the previous candle are visually highlighted (for informational purposes only).
---
## Integrated Dashboard
A compact table dashboard (bottom left) displays:
* Current **Setup Status** (Long/Short active, Long/Short ready, No Setup),
* **Stop-Loss**, **Take-Profit**, and **Entry Reference**,
* **Trend Status** (Bull/Bear/Sideways),
* **RSI Value**, and **ATR Value**.
Active long/short positions are highlighted in color (green/red).
--
## Practical Guide
1. **Place on Chart** and select the desired timeframe.
2. **Calibrate Parameters** (EMA lengths, RSI levels, ATR multipliers) to match the market and timeframe.
3. **Backtest** across different market phases; prioritize robustness over maximum curve fit.
4. **Fine-Tuning:**
* Shorter EMAs are often useful intraday (e.g., 20/100 or 34/144).
* Adjust RSI levels to market characteristics (45/55 for aggressive trading, 30/70 for conservative trading).
* Increase or decrease ATR multipliers depending on volatility/trading style.
--
## Notes, Limitations & Extensions
* **FVG Definition:** The FVG detection used here is intentionally simplified. Those who prefer a more rigorous approach can switch to a 3-candle definition and fill levels.
* **Order Blocks:** These primarily serve as a guide. Integration into entry/exit logic (e.g., retests) is possible as an extension.
* **Backtest Realism:** Fills may differ from the displayed closing price. For greater accuracy, intrabar backtests or an entry indicator based on the average position price are conceivable.
* **Alerts:** Currently, no alert conditions are defined; these can be added for long/short setups and status messages.
* **Position Management:** By default, no scaling is performed. Partial sales, trailing stops, or multiple entries can be added.
---
## Purpose & Benefits
The strategy offers a clear, modular framework: trend filter (direction), RSI contra timing (entry), SMC proxy via FVG Touch (structure), and ATR-based exits (risk adaptation). This makes it robust, easy to understand, and highly extensible—both for discretionary traders who appreciate visual SMC elements and for systematic testers who prefer a clean, parameterizable foundation.
Cerca negli script per "smart"

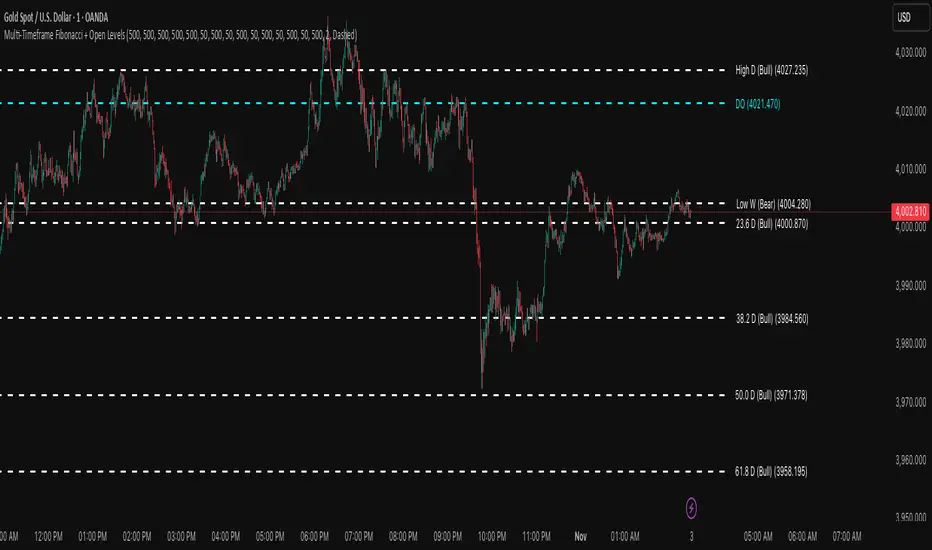
Multi-Timeframe Fibonacci + Open Levels🟣 Multi-Timeframe Fibonacci Levels + Open Levels | Trade Symmetry
This indicator automatically plots Fibonacci levels derived from higher timeframe candle ranges — all at once, directly on your current chart.
It helps you quickly visualize confluence zones and reaction levels where institutional traders are likely to participate.
⚙️ Features
✅ Multi-timeframe Fibonacci Levels — Daily, Weekly, Monthly, Quarterly & Yearly
✅ Automatic Bullish/Bearish detection based on previous candle
✅ Dynamic overlap detection (combines overlapping Fib levels into a single clean label)
✅ Configurable Fibonacci levels, colors, and styles
✅ Optional Open-Price Levels (Daily, Weekly, Monthly)
✅ Clean memory management to keep your chart lightweight
🧠 How to Use
• Add it to any timeframe — it will automatically overlay higher timeframe Fibs.
• Use overlapping or aligned Fib zones as confluence areas.
• Combine with structure or liquidity indicators for high-probability setups.
💡 Inspired by
The concept of higher-timeframe Fibonacci confluences used in Smart Money Concepts (SMC) and ICT-style analysis.
Supply and Demand Scanner Toolkit [TradingFinder]🔵 Introduction
The analytical system presented here is built upon a deep quantitative foundation designed to capture the dynamic behavior of supply and demand in live markets. At its core, it calculates continuously adaptive zones where institutional liquidity, volatility shifts, and momentum transitions converge. These zones are derived from a combination of a regression-based moving average, a long-period ATR, and Fibonacci expansion ratios, all working together to model real-time volatility, price momentum, and the underlying market imbalance.
In practice, this means that at any given moment, five primary bands and seven variable analytical zones are generated around price, representing different market states ranging from extreme overbought to extreme oversold.
Each band reacts dynamically to price volatility, recalibrating with every new candle, which allows the system to mirror the true, constantly changing structure of supply and demand. Every movement between these zones reflects a transition in the strength and dominance of buyers and sellers, a process referred to as volatility-driven price state transitions.
Traditional analytical models often rely on fixed or static indicators that cannot keep up with the rapid microstructural changes in modern markets. This system instead uses regression and smoothing logic to adapt on the fly. By combining a regression moving average with a smoothed moving average, the model calculates real-time trend direction, momentum flow, and trend strength.
When the regression average rises above the smoothed one, the system classifies the trend as bullish; when it falls below, bearish. This dual-layer structure not only helps confirm direction but also enables the automatic detection of critical structural shifts such as Break of Structure (BoS), Change of Character (CHoCH), and directional reversals.
Both the current trend (Live Trend) and projected future trend (Vision Trend) are calculated simultaneously across all available timeframes. This dual analysis allows traders to identify structural changes earlier and to recognize whether a trend is gaining or losing momentum.
In most conventional moving-average-based frameworks, trading signals are delayed because these models react to price rather than anticipate it. As a result, many buy or sell signals appear after the real move has already begun, leading to entries that contradict the current trend. This system eliminates that lag by employing a mean reversion trading model. Instead of waiting for crossovers, it observes how far price deviates from its statistical mean and reacts when that deviation begins to shrink, the moment when equilibrium forces reemerge.
This approach produces non-lagging, data-driven signals that appear at the exact moment price begins to revert toward balance. At the same time, traders can visually assess the market’s condition by observing the spacing, compression, or expansion of the dynamic bands, which represent volatility shifts and trend energy. Through this interaction, the trader can quickly gauge whether a trend is strengthening, losing power, or preparing for a reversal. In other words, the model provides both quantitative precision and intuitive visualization.
A unique visual element in this system is how candles are displayed during transitional states. When Live Trend and Vision Trend contradict each other, for instance, when the current trend is bullish but the projected trend turns bearish, candle bodies automatically appear as hollow.
These hollow candles act as visual alerts for zones of uncertainty or equilibrium between buyers and sellers, often preceding trend reversals, liquidity sweeps, or volatility compression phases. Traders quickly learn to interpret hollow candles as signals to pause, observe, or prepare for potential shifts rather than to act impulsively.
Signal generation in this model occurs when price reverts from extreme zones back toward neutrality. When price exits the strong overbought or strong oversold zones and reenters a milder area, the system produces a reversal signal that aligns with real-time market dynamics. To refine accuracy, these signals are confirmed through several filters, including momentum verification, volatility behavior, and smart money validation. This multi-layered signal logic significantly reduces false entries, helping traders avoid overreactions to temporary liquidity spikes and enhancing performance in volatility-driven markets.
On a broader level, the model supports full multi-timeframe analysis. It can analyze up to twenty symbols simultaneously, across multiple timeframes, to detect directional bias, correlation, and confluence. The result is a holistic map of market structure in real time, showing how each asset aligns or diverges from others and how lower timeframes fit into the macro trend. Variables such as Live Trend, Vision Trend, Directional Strength, and Zone Positioning combine to give a complete structural snapshot at any given moment.
Risk management is handled by an adaptive Trailing Stop Engine that continuously aligns with current volatility and price flow. It integrates pivot mapping with ATR-based calculations to dynamically adjust stop-loss levels as price evolves. The engine offers four adaptive modes, Grip, Flow, Drift, and Glide, each tailored to different levels of market volatility and trader risk tolerance. In visualization, the profit area between entry and stop-loss is shaded light green for long positions and light red for short positions. This design allows immediate recognition of active risk exposure and profit lock-in zones, all in real time.
Altogether, the combination of ATR Volatility Mapping, Fibonacci Band Calibration, Regression-Based Trend Engine, Dynamic Supply and Demand Equilibrium, Conflict Detection through Hollow Candles, Mean Reversion Signal Model, and Adaptive Trailing Stop forms a unified analytical system. It maps the market’s structure, identifies current and future trends, measures the real-time balance of buyers and sellers, and highlights optimal entry and exit points. The final result is higher analytical precision, improved risk control, and a clearer view of the true, data-defined market structure.
🔵 How to Use
Analyzing supply and demand in live financial markets is one of the most complex challenges traders face. Price rarely moves in a straight line; instead, it evolves through phases of expansion, compression, and redistribution. Many traders misinterpret these movements because the zones that appear strong or reactive at first glance often represent nothing more than temporary liquidity redistributions.
These areas, while visually convincing, may lose relevance quickly when volatility increases or when viewed from another timeframe. In high-volatility environments, traditional zone analysis becomes even more unreliable. Price may seem to respect a support or resistance level only to break through it a few candles later. This behavior creates false zones and misleading reversal points.
The key to filtering such movements lies in understanding the context, how volatility, momentum, and structural flow interact across different timeframes. A single timeframe can only tell part of the story. The market’s true structure emerges only when data is synchronized from macro to micro levels.
This is where multi-timeframe correlation becomes essential. Every timeframe offers a different lens through which supply and demand balance can be observed. For example, a trader might see a bullish setup on a 15-minute chart while the 4-hour chart is still showing a strong distribution phase. Without alignment between these layers, trades are easily positioned against the dominant liquidity flow. The model presented here solves this by processing all relevant timeframes simultaneously, allowing traders to see how short-term movements fit within higher-level structures.
Each market phase, whether accumulation, expansion, or reversion, carries a unique volatility fingerprint. The system tracks transitions in volatility regimes, momentum divergence, and structural breakouts to anticipate when a phase change is approaching. For instance, when volatility compresses and ATR readings narrow, it often signals an upcoming breakout or reversal. By monitoring these shifts in real time, the model helps the trader differentiate between liquidity grabs (temporary volatility spikes) and genuine structural changes.
Every supply-demand interaction within this system is adaptive rather than static. The zones continuously recalibrate based on live parameters such as price velocity, momentum distribution, and liquidity displacement. This adaptive structure ensures that the balance between buyers and sellers is represented accurately as market conditions evolve.
In practice, this allows the user to identify early signs of trend exhaustion, potential reversals, and continuation patterns long before traditional indicators would react.
In essence, successful supply and demand analysis requires moving beyond subjective interpretation toward data-driven decision-making.
Manual drawing of zones or relying solely on visual intuition can lead to inconsistent results, especially in fast-changing markets. By combining ATR-driven volatility mapping, mean reversion dynamics, and multi-timeframe alignment, this framework offers a clear, objective, and responsive model of how market forces actually operate. Each decision becomes grounded in measurable context, not assumptions.
The analytical interface is divided into two main sections : the visual chart framework and the scanner data table.
On the chart, five dynamic bands and seven analytical zones appear around price. These are calculated from ATR, regression moving average, and Fibonacci expansion ratios to define whether the market is overbought, oversold, or neutral. Each zone has distinct color coding, allowing traders to recognize the market state instantly without switching tools or indicators.
Price movement within these bands reveals more than just direction, it tells a story of volatility, liquidity flow, and market equilibrium. The upper zones typically indicate exhaustion of buying pressure, while lower zones highlight areas of overselling or potential recovery. The way price reacts near these boundaries can help determine whether a continuation or reversal is likely.
At the heart of the visualization are two layered trend components : Live Trend and Vision Trend.
The Live Trend shows the present market direction based on regression and smoothing logic, while the Vision Trend projects the probable future trajectory by analyzing slope deviation and momentum displacement. When these two align, the trader sees confirmation of market strength. When they diverge, candle bodies turn hollow, a simple yet powerful visual alert signaling hesitation, consolidation, or a possible turning point.
At the bottom of the interface, the Scanner Table organizes all analytical data into a structured display. Each row corresponds to a symbol and timeframe, showing the current Live Trend, Vision Trend, Directional Strength, Zone Position, and Signal Age. This table provides a real-time overview of all assets being tracked, showing which ones are trending, which are in reversal, and which are entering transition zones. By analyzing this table, traders can instantly identify correlation clusters, where multiple assets share the same trend direction, often a sign of broader market sentiment shifts.
The Scanner can simultaneously process multiple timeframes and up to twenty different assets, producing a panoramic market overview. This makes it easy to apply a top-down analytical workflow, starting with higher timeframe alignment, then drilling down into lower levels for execution. Instead of reacting to isolated signals, traders can see where confluence exists across structures and focus only on setups that align with overall market context.
The bands and their color coding make interpretation intuitive even for less experienced users. Darker shades correspond to extreme zones, typically where institutional orders are being absorbed or distributed, while lighter zones mark mild overbought or oversold conditions. When price transitions from an outer extreme zone into a milder region, a signal condition becomes active. At this point, traders can cross-check the event using momentum and volatility filters before acting.
The trailing stop section of the display adds another critical dimension to decision-making. It visualizes stop levels as continuously updating colored lines that follow price movement. These levels are calculated dynamically through pivot mapping and ATR-based sensitivity. The shaded area between the entry point and active stop loss (light green for buys, light red for sells) gives traders immediate insight into how much of the move is currently secured as profit and how much remains exposed. This simple visual cue transforms risk management from a static calculation into a living, responsive process.
All components of this analytical system are fully customizable. Users can adjust signal type, calculation periods, smoothing intensity, and band sensitivity to match their trading style. For example, a scalper might shorten ATR and MA periods to capture rapid fluctuations, while a swing trader might increase them for smoother and more stable readings. Because every element responds to live data, even small adjustments lead to meaningful changes in how the system behaves.
When combined with the scanner’s data table, these features enable a top-down analytical workflow, one where decisions are not made from isolated indicators but from a complete, multi-dimensional understanding of market structure. The result is a system that supports both reactive precision and proactive market awareness.
🟣 Long Signal
A long signal is generated when price begins to rebound from deeply oversold conditions. More precisely, when price enters the strong or extreme oversold zones and then returns into the mild oversold region, the system identifies the start of a mean reversion phase. This transition is not based on subjective interpretation but on mathematical deviation from equilibrium, meaning that selling pressure has been exhausted and liquidity begins to shift toward buyers.
Unlike delayed signals that depend on moving average crossovers or oscillators, this signal appears the moment price starts moving back toward balance. The model’s mean reversion logic detects when volatility contraction and momentum realignment coincide, producing a non-lagging entry condition.
In this situation, traders can visually confirm the setup by observing the spacing and curvature of the lower bands. When the lower volatility bands begin to flatten or curve upward while ATR readings stabilize, it indicates that the market is transitioning from distribution to accumulation.
The strength and quality of each long signal depend on the configuration of trend variables. When both Live Trend and Vision Trend are bullish, the probability of continuation is significantly higher. This alignment suggests that the market’s short-term momentum is supported by long-term structure. On the other hand, when the two trends contradict each other, which the chart highlights with hollow candles, it represents a temporary phase of indecision or conflicting forces.
In these moments, traders are encouraged to monitor volatility compression and observe whether the next few candles confirm a real breakout or revert back to range conditions.
Additional confirmation can be derived from observing the slope of the regression moving average and the magnitude of ATR fluctuations. A steeper upward slope combined with decreasing volatility indicates stronger bullish intent. In contrast, if ATR expands while price remains flat, it signals potential traps or fakeouts driven by short-term liquidity grabs.
Valid long signals often emerge near the end of volatility compression periods or immediately after liquidity sweeps around major lows. These are points where large players typically absorb remaining sell orders before initiating upward movement. Once the long condition triggers, the system automatically calculates the initial stop loss using a combination of recent pivots and ATR range. From that point, the Trailing Stop Engine dynamically adjusts as price rises, maintaining optimal distance from the entry point and locking in profits without restricting trade potential.
For educational context, consider a situation where the market has been trending downward for several sessions, and the ATR value begins to decline, showing that volatility is compressing. As price touches the lower extreme zone and reverses into the mild oversold region while Live Trend starts turning positive, this creates an ideal long condition. A new cycle of expansion often begins right after such compression, and the system captures that early shift automatically.
🟣 Short Signal
A short signal represents the opposite scenario, a point where buying momentum weakens after a strong rally, and price begins to revert downward toward equilibrium. When price exits the strong or extreme overbought zones and moves into the mild overbought region, the model detects the start of a bearish mean reversion phase.
Here too, the signal appears without delay, as it is based on the real-time relationship between price and its volatility boundaries rather than on indicator crossovers.
The system identifies these short conditions when upward momentum shows visible fatigue in the volatility bands. The upper bands start to flatten or turn downward while the regression slope begins to lose angle. This is often accompanied by rising ATR readings, showing an expansion in volatility that reflects distribution rather than continuation.
The quality of the short signal is strongly influenced by the interaction between the two trend layers. When both Live Trend and Vision Trend point downward, the likelihood of sustained bearish continuation increases dramatically. However, if they diverge, candle bodies turn hollow, clearly marking zones of conflict or hesitation. These phases often coincide with the end of a bullish impulse wave and the start of an early correction.
A practical example can illustrate this clearly. Imagine a market that has been trending upward for several days with expanding volatility. When price pushes into the extreme overbought zone and starts pulling back into the mild region, the system interprets it as the first sign of distribution. If at the same time the regression moving average flattens and ATR begins to rise, it strongly suggests that institutional participants are taking profit. The generated short signal allows the trader to position early in anticipation of the downward reversion that follows.
The initial stop loss for short trades is calculated above the most recent pivot high, ensuring logical protection based on the structural context. From there, the Trailing Stop Engine automatically tracks the price movement downward, tightening stops as volatility decreases or expanding them during sharp swings to avoid premature exits.
The engine’s dynamic nature makes it suitable for both aggressive scalpers and patient swing traders. Scalpers can set the trailing sensitivity to “Grip” mode for tighter control, while swing traders can use “Glide” mode to capture larger portions of the trend.
Most short signals form right after volatility expansion or liquidity grabs around major highs, classic exhaustion areas where momentum divergence becomes evident. The combination of visual cues (upper band curvature, hollow candles, ATR spikes) provides traders with multiple layers of confirmation before taking action.
In both long and short scenarios, this analytical system replaces emotional decision-making with structured interpretation. By translating volatility, momentum, and price positioning into clear contextual patterns, it empowers the trader to see where reversals are forming in real time rather than guessing after the move has started.
🔵 Setting
🟣 Logical Setting
Channel Period : The main channel period that defines the base moving average used to calculate the central line of the bands. Higher values create a smoother and longer-term structure, while lower values increase short-term sensitivity and faster reactions.
Channel Coefficient Period : The ATR period used to measure volatility for determining the channel width. Higher values provide greater channel stability and reduce reactions to short-term market noise.
Channel Coefficient : The ATR sensitivity factor that defines the distance of the bands from the central average. A higher coefficient widens the bands and increases the probability of detecting overbought or oversold conditions earlier.
Band Smooth Period : The smoothing period applied to the bands to filter minor price noise. Lower values produce quicker reactions to price changes, while higher values create smoother and more stable lines.
Trend Period : The period used in the regression moving average calculation to identify overall trend direction. Shorter values highlight faster trend shifts, while longer values emphasize broader market trends.
Trend Smooth Period : The smoothing period for the regression trend to reduce volatility and confirm the dominant market direction. This setting helps to better distinguish between corrective and continuation phases.
Signals Gap : The time interval between generated signals to prevent consecutive signal clustering. A higher value strengthens the temporal filter and produces more selective and refined signals.
Bars to Calculate : Defines the number of historical candles used in calculations. Limiting this value optimizes script performance and reduces processing load, especially when multiple symbols or timeframes are analyzed simultaneously. Higher values increase analytical depth by including more historical data, while lower values improve responsiveness and reduce potential lag during live chart updates.
Trailing Stop : Enables or disables the dynamic trailing stop engine. When active, the system automatically adjusts stop loss levels based on live volatility and price structure, maintaining alignment with market flow and trend direction.
Trailing Stop Level : Defines the operational mode of the trailing stop engine with four adaptive styles: Grip, Flow, Drift, and Glide. Grip offers tight stop management for scalping and high precision setups, while Glide allows wider flexibility for swing or long-term trades.
Trailing Stop Noise Filter : Applies an additional filtering layer that smooths minor fluctuations and prevents unnecessary stop adjustments caused by short-term market noise or micro volatility.
🟣 Display Settings
Show Trend on Candles : Displays the current trend direction directly on price candles by applying dynamic color coding. When Live Trend and Vision Trend align bullish, candles appear in green tones, while bearish alignment displays in red. If the two trends conflict, candle bodies turn hollow, marking a Trend Conflict Zone that signals potential indecision or upcoming reversal. This feature provides instant visual confirmation of market direction without the need for external indicators
Table on Chart : Allows users to choose whether the analytical table appears directly over the chart or positioned below it. This gives full control over screen layout based on personal workspace preference and chart design.
Number of Symbols : Controls how many symbols are displayed in the screener table, adjustable from 10 up to 20 in steps of 2. This flexibility helps balance between detailed screening and visual clarity on different screen sizes.
Table Mode : Defines how the screener table is visually arranged.
Basic Mode : Displays all symbols in a single column for vertical readability.
Extended Mode : Arranges symbols side by side in pairs to create a more compact and space-efficient layout.
Table Size : Adjusts the visual scaling of the table. Available options include auto, tiny, small, normal, large, and huge, allowing traders to optimize table visibility based on their screen resolution and preferred chart density.
Table Position : Determines the exact placement of the screener table within the chart interface. Users can select from nine available alignments combining top, middle, and bottom vertically with left, center, and right horizontally.
🟣 Symbol Settings
Each of the 10 available symbol slots includes a full range of adjustable parameters for personalized analysis.
Symbol : Defines or selects the asset to be tracked in the screener, such as XAUUSD, BTCUSD, or EURUSD. This enables multi-asset scanning across different markets including forex, commodities, indices, and crypto.
Timeframe : Sets the specific timeframe for analysis for each selected symbol. Examples include 15 minutes, 1 hour (60), 4 hours (240), or 1 day (1D). This flexibility ensures precise control over how each asset is monitored within the multi-timeframe structure.
🟣 Alert Settings
Alert : Enables alerts for AAS.
Message Frequency : Determines the frequency of alerts. Options include 'All' (every function call), 'Once Per Bar' (first call within the bar), and 'Once Per Bar Close' (final script execution of the real-time bar). Default is 'Once per Bar'.
Show Alert Time by Time Zone : Configures the time zone for alert messages. Default is 'UTC'.
🔵 Conclusion
Understanding financial markets requires more than indicators, it demands a framework that captures the interaction of price, volatility, and structure in real time. This analytical system achieves that by combining mean reversion logic, volatility mapping, and dynamic supply and demand modeling into an adaptive, data-driven environment. Its computational bands and trend layers visualize market intent, showing when momentum is strengthening, fading, or preparing to shift.
Each signal, derived from statistical equilibrium rather than delayed indicators, reflects the exact moment when the balance between buyers and sellers changes. Variables like Live Trend, Vision Trend, Directional Strength, and ATR-based Volatility Context help traders assess signal quality and alignment across multiple timeframes. The system blends automation with human interpretation, preserving macro-to-micro consistency and enabling confident entries, exits, and stop management through its adaptive Trailing Stop Engine.
Every component, from color-coded zones to hollow candles, forms part of a broader narrative that teaches traders to read the market’s language instead of reacting to it. Built on self-correcting analysis, the framework continuously recalibrates with live data. By transforming volatility, liquidity, and price behavior into structured insight, it empowers traders to move from reaction to prediction, a living ecosystem that evolves with both the market and the trader.
Script a pagamento

SMC FVG/IFVG (Multi-TF x 4) [ZAUTEC]SMC FVG/IFVG (Multi-TF x 4): Multi-Timeframe Fair Value Gap with Inversed FVG Detection
This powerful Pine Script indicator is designed to help traders identify, track, and manage Fair Value Gaps (FVGs) and their respective Inversed Fair Value Gaps (IFVGs) across up to four different timeframes simultaneously.
Key Features
Multi-Timeframe Analysis (4x): Analyze and display FVGs from four distinct timeframes alongside your current chart, offering a comprehensive view of market imbalances across various scales.
Fair Value Gap (FVG) Detection: Automatically identifies classic three-candle FVGs (market inefficiencies).
Customizable FVG Length: Set how many bars the FVG boxes should initially extend for.
Minimum Gap Size: Filter out minor, insignificant gaps using a tick-based minimum size threshold.
Optional Box Extension: Dynamically extend FVG boxes to the current bar index or use a fixed extension for a cleaner chart.
Inversed FVG (IFVG) Logic: Detects a high-probability reversal pattern where a previously filled FVG zone is immediately followed by the formation of a new, opposite FVG within or adjacent to the same area. This confirms the old FVG has "flipped roles" (e.g., from support to resistance).
Lookback Period: Defines how long the indicator searches for a corresponding FVG breach to confirm the IFVG.
IFVG Minimum Size: Customizable minimum size threshold for the IFVG.
Dynamic Box Management:
Automatic Fill Deletion: FVGs are automatically removed from the chart when price action fully trades through the gap, signifying the imbalance has been "filled."
IFVG Tracking: IFVGs are tracked and removed from the chart after the configurable lookback period.
Full Customization: Control the visibility, colors, border styles (solid, dashed, dotted), and width for FVG, Bearish FVG, Bullish FVG, and IFVG boxes independently for each of the four timeframes.
How to Use
Select Timeframes: Choose up to four desired timeframes in the settings (e.g., "15" for 15-minute, "4H" for 4-hour, "D" for Daily). Leave the field empty to use the chart's current timeframe.
Toggle Visibility: Use the Show FVG and Show IFVG toggles to focus on the imbalances you wish to see.
Adjust Extension: Set Extend Boxes to bar index to true to keep all open FVG boxes drawn all the way to the current live price bar.
Interpret the Gaps:
FVG (Bullish/Bearish): Potential areas for price to return to and find support/resistance.
IFVG (Inverse FVG): Stronger signals that a previous zone of imbalance has been violated and is likely to act as a significant flip zone for future price movements.
This indicator is an essential tool for traders utilizing concepts like ICT (Inner Circle Trader) and SMC (Smart Money Concepts), providing a clear visual representation of market structure and liquidity voids.

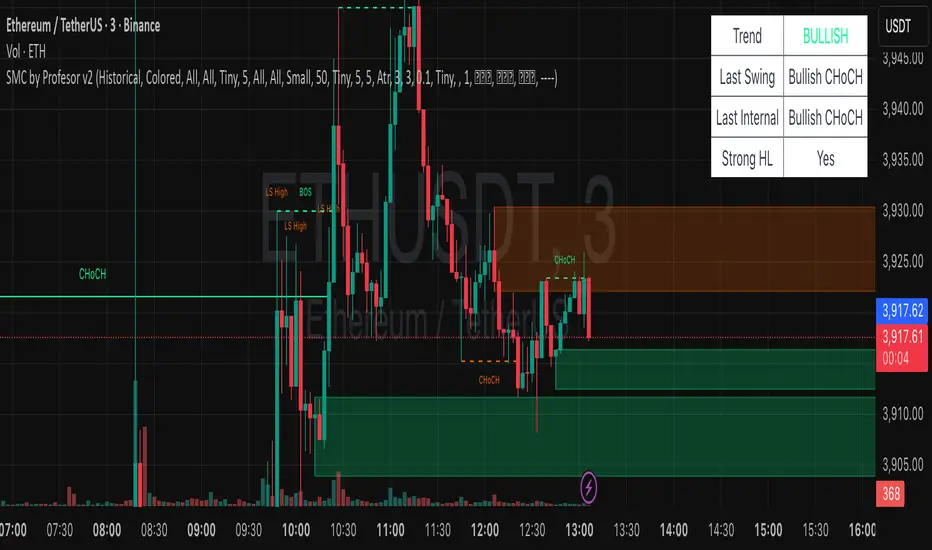
SMC by ProfesorSMC by Profesor
Discover market structure mastery with SMC by Profesor – your ultimate Smart Money Concepts toolkit for TradingView. Identify bullish/bearish BOS & CHoCH breaks, plot internal/swing order blocks, detect EQH/EQL levels, highlight FVGs, and zone premium/discount areas. Visualize swing points, PDH/PDL lines, and trend-colored candles. Receive instant alerts for breakouts, gaps, and more. Perfect for ICT traders seeking precision in any timeframe. Historical or real-time mode – elevate your edge today!
ICT Daily Levels & Liquidity Zones [HatefBW]ICT Daily Levels & Liquidity Zones
This indicator automatically detects and plots the daily high and low levels for the current day and the two previous days.
Each level dynamically tracks the exact candle that created it, allowing traders to identify where short-term liquidity pools form across multiple timeframes.
What makes this tool unique:
• Three-day structure: Displays current, previous, and 2-day-old highs/lows for contextual price action.
• Dynamic mapping: On lower timeframes, each level aligns precisely with the candle that created the daily high or low.
• Full customization: Traders can toggle each day’s levels, colors, label size, and extension behavior independently.
• Adaptive logic: Lines automatically extend or stay fixed depending on the chosen setting, avoiding chart clutter.
This tool helps ICT traders and smart money practitioners visualize daily liquidity zones — potential areas of stop hunts or institutional targeting.
The script is originally coded by @HatefBW from scratch, with no reused or modified open-source code

FVG +Displcement/ATR/3thClosedBody [hatefbw]Overview
This indicator is a modified version of the LuxAlgo group’s FVG indicator. It now includes three advanced optional filters that help traders identify only the strongest and most reliable Fair Value Gaps (FVGs), aligned with Smart Money Concepts (SMC) and ICT methodology.
How it works
We’ve added the following new configurable options to the indicator:
✅ Confirm Third Closed Body
When enabled, ensures the third candle (right after the gap) closes beyond the wick of the second candle.
✔️ Adds extra validation to price direction and filters out weaker FVGs.
✅ Confirm Displacement Candle
Validates that the second candle (the one forming the FVG) is a strong displacement candle. This condition checks for:
📏 Large body relative to total range (customizable %, default: 70%)
📈 High volume above 20-period moving average
🔺 Break of Structure (BOS) in the direction of the FVG
Bullish FVG: breaks above recent highs
Bearish FVG: breaks below recent lows
✅ ATR-Based Validation (optional)
Adds an additional filter where the second candle’s body or range must exceed the ATR (default: ATR 14, configurable).
✔️ Further confirms that the displacement candle has significant market movement.
Usage
All features are 100% optional and can be toggled in the settings.
Use them to filter out weak FVGs and align trades with institutional-grade setups.

Dizzy HOLO🚀 Dizzy HOLO is an all-in-one professional trading suite designed for serious traders.
It combines Pivot Points, Opening Range Breakout (ORB), HOLO (High of Low / Low of High), Weekly Levels, SMA Thresholds, and Real-Time Alerts into a single lightweight indicator.
🔑 Key Features:
✅ Pivot Points (Fibonacci & Camarilla) – Automatic support & resistance with labels.
✅ Opening Range Breakout (ORB) – Custom session ORB with historical data and breakout alerts.
✅ HOLO Strategy – Daily High/Low, Highest H1 Open, Lowest H1 Close with dynamic buy/sell zones.
✅ Weekly Levels – Previous Week High/Low/Open/Close with extended dotted projections.
✅ SMA Threshold Zones – Dynamic SMA with gray zone filter and trend-based candle coloring.
✅ Multi-Timeframe Analysis – Auto-switching pivots & real-time confirmation.
✅ Smart Alerts – Pivot breakouts, ORB levels, HOLO crosses, and Weekly breaks.
🎯 Why Use Dizzy HOLO?
This indicator is built for breakout, reversal, and trend traders. It provides clear market structure, liquidity zones, and actionable alerts so you never miss important setups.
🛠️ Best Suited For:
Intraday scalpers
Swing traders
Breakout traders
HOLO strategy followers
Multi-timeframe traders

Riz Goldbach FrameworkRiz Goldbach Framework maps a dynamic dealing range and a set of Goldbach-derived price levels to structure intraday decision-making. It blends range math (PO3), level clustering, session weighting, volume/volatility context, and an explainable scoring engine that can issue BUY/SELL signals with risk levels (SL/TP). It is designed for discretionary traders who want rules-based context rather than a black box.
Core concepts (how it works)
1) PO3 Dealing-Range Engine
⦁ The script builds a tri-based PO3 range around current price (Auto or Manual).
⦁ It shifts the range when price “accepts” outside (close/wick—user selectable) and adapts width with ATR so the range expands in high volatility and tightens in low volatility.
⦁ From this range it computes mid, premium/discount halves, and sub-mids.
2) Goldbach Levels (structure map)
Within the active PO3 range, fixed percentages anchor recurring behaviors:
⦁ Rejection edges: 3%, 97%
⦁ Order-block tendency: 11%, 89%
⦁ FVG tendency: 17%, 83%
⦁ Liquidity void / expansion: 29%, 71%
⦁ Breaker band: 41%, 59%
⦁ Mitigation band: 47%, 53%
⦁ Equilibrium: 50%
⦁ Touch/near logic is tolerance-based (body-only optional). The script also counts confluence clusters (2=moderate, 3+=strong) near price.
3) Market elements the script tracks
⦁ Order Blocks (OB): detected after BOS behavior when price is sitting on OB-biased GB levels (11/89).
⦁ FVG: 3-bar gaps at FVG-biased levels (17/83) with optional “% fill” confirmation.
⦁ LV bars: wide-range, high-range bars around 29/71 for displacement/voids.
⦁ Equal Highs/Lows (EQH/EQL): tolerance with labeling for sweep risk.
⦁ Circuit Breaker (CB): zone seeded at 41/59. States: intact → broken → retest → revalidated/failed. A shaded band shows the active breaker zone.
⦁ Twin Towers (TT): equal-high/equal-low doublet with spacing/volume/RSI checks, then sweep-and-return into the breaker zone for confirmation.
4) Context & filters
⦁ Trend vs Range: DMI/ADX + EMA stack infer TREND/RANGE/TRANSITION and scale the required score.
⦁ MTF alignment: compares current PO3 halves vs HTF PO3 halves (user timeframe), rewarding alignment and flagging divergence.
⦁ Fib–Goldbach confluence: checks 61.8/38.2/78.6/127.2/161.8 against key GB levels for added weight.
⦁ Session weighting: Asia/London/NY bias different GB levels; weights are higher for London/NY.
⦁ Volume-weighted liquidity: tracks volume at EQH/EQL to flag “high-commitment” sweeps.
⦁ AMD cycle (smart): accumulation/manipulation/distribution estimated from ATR regimes, sweeps, BOS continuation, divergence and PO3 shifts.
⦁ Optional filters: HTF bias, SMT divergence via a second symbol, VSA volume emphasis, news blackout session.
5) Signal engine
⦁ Modes: MMxM, Trending, or Hybrid (auto switches depending on CB acceptance + ATR expansion).
⦁ A score (0–100) aggregates weighted conditions (GB touch/confluence, AMD alignment, CB state, TT, FVG/OB interaction, HTF bias, SMT, high-volume, RSI momentum).
⦁ Adaptive threshold raises/lowers requirements in TREND vs RANGE.
⦁ Outputs: BUY/SELL label with strength (WEAK/NORMAL/STRONG), a reasons string (e.g., GB+AMD+Breaker+TT+FVG+HTF+RSI), and risk levels:
⦁ SL: rejection/structure anchored (e.g., GB3/GB97 or recent swing ± ATR).
⦁ TP1: opposite breaker (41/59).
⦁ TP2: opposite FVG tendency (17/83).
⦁ Live RR displayed on label and plotted as dashed lines.
⦁ Cooldown, session/time, weekend, and volatility gates suppress poor-quality or clustered signals.
What you see on the chart
⦁ PO3 bands: High/Low/Mid lines plus background shading for Premium (bear tint), Discount (bull tint), Equilibrium (neutral).
⦁ Goldbach lines: Major structure (0/50/100) plus the functional GB set (11/17/29/41/47/53/59/71/83/89/3/97).
⦁ Blocks & gaps: OB lines, FVG boxes (extend right, fill progress), LV box, breaker zone band, and TT logic states.
⦁ CE/MT: Central equilibrium (~3.5%/96.5%) and mid-towers (25%/75%) trigger optional alerts.
⦁ Session overlays: Asia/London/NY (optional).
⦁ Opens: Daily/Weekly (optional).
⦁ Dashboard: PO3 value, Zone (Premium/Discount/Equilibrium), AMD phase, Session, Mode (MMxM/Trending/Hybrid), CB state, nearest GB tag, Market context (TREND/RANGE/TRANS), recent Events, and rolling win-rate tallies (signals/CB/TT) from the current chart session.
How to use it (workflow)
1. Pick a preset
⦁ Minimal: only core structure.
⦁ Standard: levels + dashboard.
⦁ Full: adds sessions + GBT window overlays.
2. Choose range logic
⦁ PO3 Auto is reactive and scales with ATR.
⦁ Manual PO3 is for precise range control.
3. Scope your bias
⦁ Confirm Zone (Premium/Discount), CB state, and AMD phase; check MTF row if enabled.
⦁ Strong setups usually appear when session-weighted GB levels + confluence ≥ 2 + CB revalidated + AMD = manipulation → distribution (short) or accumulation → manipulation (long).
4. Act on signals (optional)
⦁ When a label prints, read the factors string and score.
⦁ Use plotted SL/TP1/TP2 lines and RR.
⦁ Respect cooldown, news blackout, and volatility filter.
Inputs you might tweak
⦁ PO3: Auto/Manual, acceptance by Close vs Wick, adaptive widening/tightening.
⦁ Levels: Major-only vs All; tolerance %; wick vs body touches.
⦁ Signals: Mode, score threshold, cooldown, confirm on close.
⦁ CB/TT: breaker width %, spacing window & tolerance, suppress bars after TT.
⦁ Filters: HTF timeframe, SMT symbol, VSA on/off, news blackout session.
⦁ Visuals: colors, line opacity, label sizes, dashboard position/size.
⦁ FVG/LV/CE/MT: fill %, and per-event alerts.
Alerts available
⦁ BUY/SELL signal, PO3 shift, GB touch (with tag), CB broken/retest pass/fail, TT setup/confirmed, OB tagged, FVG formed/filled, LV expansion, CE/MT touches.
Limitations & notes
⦁ Signals are contextual—they depend on the active PO3, tolerance, filters, session weighting, and volatility regime.
⦁ HTF requests depend on broker/exchange data and the timeframe you assign; if HTF is empty or illiquid, features degrade gracefully but may be less informative.
⦁ Win-rate tallies are session-local (not a historical performance guarantee).
⦁ Parameter choices (e.g., tolerance, breaker width, thresholds) materially change behavior.
Disclaimer
This tool is for educational/informational purposes only. It does not constitute financial advice, an invitation to trade, or performance assurance. Markets involve risk—always test on replay/paper and manage risk independently.

SMC Analysis - Fair Value Gaps (Enhanced)SMC Analysis - Fair Value Gaps (Enhanced) Script Summary
Overview
The "SMC Analysis - Fair Value Gaps (Enhanced)" script, written in Pine Script (version 6), is a technical analysis indicator designed for TradingView to identify and visualize Fair Value Gaps (FVGs) on a price chart. It supports both the main timeframe and multiple higher timeframes (MTF) for comprehensive market analysis. FVGs are price gaps formed by a three-candle pattern, indicating potential areas of market inefficiency where price may return to fill the gap.
Key Features
FVG Detection:
Identifies bullish FVGs: Occur when the high of a candle two bars prior is lower than the low of the current candle, with the middle candle being bullish (close > open).
Identifies bearish FVGs: Occur when the low of a candle two bars prior is higher than the high of the current candle, with the middle candle being bearish (close < open).
Visualizes FVGs as colored boxes on the chart (green for bullish, red for bearish).
Mitigation Tracking:
Tracks when FVGs are touched (price overlaps the gap range) or mitigated (price fully closes the gap).
Strict Mode: Marks an FVG as mitigated when price touches the gap range.
Normal Mode: Requires a full breakthrough (price crossing the gap’s bottom for bullish FVGs or top for bearish FVGs) for mitigation.
Optionally converts FVG box borders to dashed lines and increases transparency when partially touched.
Multi-Timeframe (MTF) Support:
Analyzes FVGs on three user-defined higher timeframes (default: 15m, 60m, 240m).
Displays MTF FVGs with distinct labels and slightly more transparent colors.
Ensures no duplicate processing of MTF bars to maintain performance.
Customization Options:
FVG Length: Adjustable duration for how long FVGs are displayed (default: 20 bars).
Show/Hide FVGs: Toggle visibility for main timeframe and each MTF.
Color Customization: User-defined colors for bullish and bearish FVGs (default: green and red).
Display Options: Toggle for showing dashed lines after partial touches and strict mitigation mode.
Performance Optimization:
Limits the number of displayed boxes (50 for main timeframe, 20 per MTF) to prevent performance issues.
Automatically removes older boxes to maintain a clean chart.
Functionality
Visualization: Draws boxes around detected FVGs, with customizable colors and text labels ("FVG" for main timeframe, "FVG " for MTF).
Dynamic Updates: Extends or terminates FVG boxes based on mitigation status and user settings.
Efficient Storage: Uses arrays to manage FVG data (boxes, tops, bottoms, indices, mitigation status, and touch status) separately for main and MTF analyses.
Use Case
This indicator is designed for traders using Smart Money Concepts (SMC) to identify areas of market inefficiency (FVGs) for potential price reversals or continuations. The MTF support allows analysis across different timeframes, aiding in confirming trends or spotting higher-timeframe support/resistance zones.

FlowScope [Hapharmonic]FlowScope: Uncover the Market's True Intent 🔬
Ever wished you could look inside the candles and see where the real action is happening? FlowScope is your microscope for the market's flow, designed to give you a powerful edge by revealing the volume distribution that price action alone can't show you.
Instead of just looking at the open, high, low, and close, FlowScope lets you dive deeper into the market's auction process. It groups candles together and builds a detailed Volume Profile for that period, showing you exactly where the trading happened and revealing the story behind the price action.
Let's explore how you can use it to gain a powerful new edge.
🧐 Core Concept: How It Works
At its heart, FlowScope does three key things:
It Groups Candles: You decide how many candles to group together. For example, setting " Group Candles " to 4 on a 5-minute chart effectively gives you a detailed 20-minute candle and profile. This helps you see the bigger picture and filter out market noise.
It Builds a Volume Profile: For each group, FlowScope analyzes the volume at every single price level. It then displays this as a horizontal histogram (we call this a "footprint" or profile). Longer bars mean more volume was traded at that price, indicating a "fair" price or an area of acceptance. Shorter bars mean price moved through quickly, indicating rejection.
It Creates a Custom "Grouped Candle": To summarize the group's overall price action, FlowScope draws a single, custom candle representing the entire group's:
Open: The open of the first candle in the group.
High: The absolute highest price reached within the group.
Low: The absolute lowest price reached within the group.
Close: The close of the last candle in the group.
This gives you a crystal-clear view of the group's net result, free from the back-and-forth noise of the individual candles inside it.
Below are some of the stunning preset color palettes you can choose from to customize your view:
🚀 How to Use: Practical Applications
FlowScope isn't just for looking pretty; it's a powerful analysis tool. Here are a few ways to integrate it into your trading:
Identify High-Volume Nodes (HVNs): Look for the longest bars in the profile. These are price levels where the market spent the most time and traded the most volume. HVNs often act as powerful "magnets" for price, becoming key areas of support and resistance.
Spot Low-Volume Nodes (LVNs): These are areas with very short bars or gaps in the profile. They represent price levels that the market moved through quickly and inefficiently. If price returns to an LVN, it's likely to move through it quickly again.
Analyze the Summary Box: This is where the real magic happens! ✨
Total Volume (Σ): The total volume for the entire group.
Buy (B) vs. Sell (S) Volume: FlowScope analyzes the lower timeframe action to estimate the buying and selling pressure that made up the total volume. Is a big red candle mostly aggressive selling, or was it just a lack of buyers? The B/S data gives you clues. A high-volume candle with nearly 50/50 buy/sell pressure might indicate absorption or a potential reversal.
Use the Grouped Candle for Clarity: Is the market in a clear uptrend, or is it just choppy? The grouped candle can give you a much clearer signal. A series of strong, green grouped candles shows much more conviction than a mix of small green and red candles.
⚙️ Settings & Customization
This is where you can truly make FlowScope your own. Let's walk through each setting.
Profile Settings
Group Candles: The number of standard chart candles you want to combine into a single FlowScope profile. A setting of 1 will analyze every single bar. A higher number gives you a broader market view. When Group Candles is set to 5, the data from the 5 individual candles are combined, and the volume is calculated accordingly.
Max Profile Boxes: This setting is more than just a number; it's a smart limit that ensures your profiles are always readable and relevant to the current market conditions.
Adaptive Sizing (The Ideal Goal): FlowScope first tries to create the perfect profile by making each volume box's height proportional to the current market volatility. It calculates an "ideal" box height based on the Average True Range ( ATR / 10 ). This is powerful because it automatically adapts: you get smaller, more detailed boxes in quiet, low-volatility markets, and larger, clearer boxes in volatile, fast-moving markets.
The Safety Cap (Your Setting): However, what if you group several candles during a massive price move? The price range could be huge! If we only used the small, ATR-based box height, you might end up with hundreds of tiny, unreadable boxes. This is where your Max Profile Boxes setting (defaulting to 50) comes in. It acts as a maximum detail cap . If the adaptive, volatility-based calculation determines that it would need more boxes than your setting (e.g., more than 50), the indicator will override it. It will then simply divide the entire price range of the group into exactly the number of boxes you specified (e.g., 50).
In short: You are setting the maximum allowable detail. FlowScope intelligently adapts the profile's granularity below that limit based on market volatility, ensuring you always get a clear and meaningful picture.
Style
Show Profile BG: A simple toggle to show or hide the faint background color behind the volume bars. Turning it off can create a cleaner look.
Color Mode: This dropdown controls how the volume profile text is colored.
Custom Gradient: This mode uses the three custom colors you select in the "Profile Colors" section to create a beautiful gradient across the profile.
Candle Color: This mode colors the profile based on whether the grouped candle was bullish (green) or bearish (red). The color will be a gradient, with the most intense color applied to the box with the highest volume; the colors of the other boxes will fade out from that point. It's a great way to see the profile's "mood" at a glance.
Profile Colors 🎨
Use Preset Palette: This is the master switch!
If checked: You can choose from 10 stunning, pre-designed color palettes from the Palette dropdown. The custom color pickers below will be disabled.
If unchecked (Default): The Palette dropdown will be disabled, and you can now choose your own three colors for the gradient.
Palette: (Only active when "Use Preset Palette" is checked) . Choose from 10 luxurious, eye-catching color schemes like "Solar Flare" or "Deep Space" to instantly change the look and feel of your chart.
Low Price / Mid Price / High Price: (Only active when "Use Preset Palette" is unchecked) . These three color pickers allow you to design your own unique gradient for the Custom Gradient color mode.
Candle Display
These settings control the custom "Grouped Candle" that summarizes the profile. When using the "Show Custom Candle" feature, you should change the chart's candlestick display to Bars for a cleaner view.
Show Custom Candle: This is the main toggle. When you check this box, the original chart candles will be hidden, and your custom FlowScope candle will be displayed instead. This custom candle is intentionally small to ensure it does not visually overlap with the volume profile boxes.
Show Body: (Only active when "Show Custom Candle" is checked) . Toggles the visibility of the candle's body.
Wick Width & Body Width: (Only active when "Show Custom Candle" is checked) . These sliders let you control the thickness of the wick and body lines to match your personal style.
Up Color / Down Color: (Only active when "Show Custom Candle" is checked) . Choose the colors for your bullish and bearish custom candles.
Experiment with the settings, find a style that works for you, and start seeing the market in a whole new light.
Happy trading! 📈😊

Unfilled ImbalancesUNFILLED IMBALANCES TRACKER - IDENTIFY HIGH-PROBABILITY REVERSAL ZONES
This advanced indicator automatically detects and tracks unfilled price imbalances (Fair Value Gaps/FVGs) between candle bodies, providing traders with crucial levels where price is likely to return.
METHODOLOGY
This indicator employs an approach to imbalance detection that differs from standard FVG indicators:
1. Body-to-Body Gap Detection: Unlike typical FVG indicators that use wicks, this system exclusively tracks gaps between candle bodies, filtering out noise and focusing on the most significant price inefficiencies.
2. Dynamic Partial Fill Tracking: Our unique algorithm continuously monitors and adjusts imbalance zones as they're partially filled, showing exactly how much of each gap remains unfilled in real-time. This feature helps traders identify the strongest remaining levels.
3. Dual Fill Detection Logic: Proprietary fill detection offers two distinct modes - Distal (gap filled when touched) and Through (requires complete price movement through the entire gap), allowing adaptation to different market behaviors.
KEY FEATURES
Real-Time Imbalance Detection
Identifies body-to-body gaps between consecutive candles
Tracks both bullish and bearish imbalances
Automatically removes filled imbalances from the chart
Advanced Fill Detection Modes
Distal Mode: Imbalance considered filled when price touches the near edge
Through Mode: Requires price to completely trade through the gap
Body Fill Option: Requires candle body (not just wick) to enter the gap zone
Partial Fill Visualization
Watch imbalances shrink in real-time as price partially fills them
Visual representation shows exact percentage of gap remaining
Critical for position sizing and risk management
Flexible Display Options
Full Box Mode: Shows complete imbalance zones
Line Mode: Displays only critical edge levels for cleaner charts
Customizable visual parameters (colors, transparency, line thickness)
Smart Extension Features
Auto-extends visual elements to current price bar
Optional extension into future (0-500 bars)
Statistics table showing active imbalances count and fill rates
TRADING METHODOLOGY
Unfilled imbalances represent areas where price moved too quickly, leaving behind inefficiencies that markets tend to revisit. This indicator helps identify:
High-probability entry zones for trend continuation trades
Logical take profit targets at unfilled gaps
Stop loss placement beyond strong imbalance zones
Market structure breaks when key imbalances are filled
Supply and demand zone identification
HOW TO USE
Apply the indicator to any timeframe (works best on 15m and above)
Configure fill detection mode based on your trading style
Watch for price approaching unfilled imbalance zones
Use partial fill information to gauge zone strength
Combine with your existing strategy for confirmation
TARGET AUDIENCE & BEST PRACTICES
This tool is designed for traders who understand price action and market structure. It works best on:
Liquid instruments with consistent volume
Trending markets where imbalances are more likely to be revisited
Higher timeframes for more reliable signals
LIMITATIONS & CONSIDERATIONS
Imbalances may not always be filled, especially in strong trending markets
Performance varies across different market conditions and instruments
Should be used in conjunction with other analysis methods, not as a standalone system
Gap detection is based on candle closes and may miss intrabar movements
Historical imbalances from many bars ago may lose relevance
SETTINGS EXPLANATION
The indicator includes multiple customization options:
Require Body Fill: Controls whether wicks or bodies must enter gaps
Fill Detection Mode: Choose between Distal or Through modes
Visual Display: Select between boxes or lines
Alert Configuration: Set minimum age before fill alerts trigger
Debug Mode: Learn how the algorithm works with visual feedback
This indicator represents months of research into price inefficiency patterns and provides a systematic approach to identifying and tracking these critical market levels.
Note: Works on all timeframes and markets. Best results on liquid instruments with consistent volume patterns.

BTC Power Law Valuation BandsBTC Power Law Rainbow
A long-term valuation framework for Bitcoin based on Power Law growth — designed to help identify macro accumulation and distribution zones, aligned with long-term investor behavior.
🔍 What Is a Power Law?
A Power Law is a mathematical relationship where one quantity varies as a power of another. In this model:
Price ≈ a × (Time)^b
It captures the non-linear, exponentially slowing growth of Bitcoin over time. Rather than using linear or cyclical models, this approach aligns with how complex systems, such as networks or monetary adoption curves, often grow — rapidly at first, and then more slowly, but persistently.
🧠 Why Power Law for BTC?
Bitcoin:
Has finite supply and increasing adoption.
Operates as a monetary network , where Metcalfe’s Law and power laws naturally emerge.
Exhibits exponential growth over logarithmic time when viewed on a log-log chart .
This makes it uniquely well-suited for power law modeling.
🌈 How to Use the Valuation Bands
The central white line represents the modeled fair value according to the power law.
Colored bands represent deviations from the model in logarithmic space, acting as macro zones:
🔵 Lower Bands: Deep value / Accumulation zones.
🟡 Mid Bands: Fair value.
🔴 Upper Bands: Euphoria / Risk of macro tops.
📐 Smart Money Concepts (SMC) Alignment
Accumulation: Occurs when price consolidates near lower bands — often aligning with institutional positioning.
Markup: As price re-enters or ascends the bands, we often see breakout behavior and trend expansion.
Distribution: When price extends above upper bands, potential for exit liquidity creation and distribution events.
Reversion: Historically, price mean-reverts toward the model — rarely staying outside the bands for long.
This makes the model useful for:
Cycle timing
Long-term DCA strategy zones
Identifying value dislocations
Filtering short-term noise
⚠️ Disclaimer
This tool is for educational and informational purposes only . It is not financial advice. The power law model is a non-predictive, mathematical framework and does not guarantee future price movements .
Always use additional tools, risk management, and your own judgment before making trading or investment decisions.

Apex Edge – Liquidity RaiderApex Edge – Liquidity Raider
The Predator That Hunts Where Retail Never Looks
The Liquidity Raider is not your average liquidity line plotter.
This is an institutional-grade hunting system that tracks the pools of liquidity Smart Money algos stalk — and tells you exactly when price is circling in for the strike.
Where most retail tools simply mark lines, this one acts like a predator:
Scans the chart dynamically to detect clustered highs & lows (pivot-based liquidity zones).
Filters noise with sensitivity & price rounding so you only get real liquidity levels — not every random swing.
Plots live BSL (Buy-Side Liquidity) & SSL (Sell-Side Liquidity) lines in clean dotted format.
Auto-deletes levels when swept, so your chart stays clean and focused.
Triggers directional arrows when price comes within your specified % distance to the target liquidity pool — before the market moves.
EMA confluence layer lets you align with institutional flow (customizable Fast & Slow EMAs).
Core Power
Cluster Logic – Finds high-probability liquidity zones using repeated pivot levels.
Sweep Awareness – Lines vanish the moment liquidity is taken, keeping focus on the next pool.
Proximity Strike Detection – Arrow signals only when price is within striking range.
Directional Clarity – Red arrows = targeting BSL, Green arrows = targeting SSL.
Scalable Across Timeframes – Adapts to your chart’s timeframe with dynamic lookback scaling.
Institutional Flow Filter – Optional EMA confirmation keeps you aligned with the real trend.
How to Use
Identify liquidity pools – Dotted green = buy-side, dotted red = sell-side.
Watch proximity arrows – These mean price is in range and hunting that pool.
Align with EMA bias – Enter only in the direction of institutional momentum.
Target the sweep – Your take profit is where the liquidity is resting.
Why Liquidity Raider Wins
This is not a lagging signal system.
It’s a real-time, clean, predictive tool designed to mimic the targeting logic of high-frequency algos.
By removing swept levels and focusing only on the next available pools, Liquidity Raider keeps you one step ahead of the crowd — and perfectly positioned for the kill shot.

XAUMO MEGABAR Detector]XAUMO MegaBar Detector – Breakout Candle Identification Tool
Purpose:
The XAUMO MegaBar Detector is built to highlight rare, high-impact candles where strong price movement and high trading volume occur together. These moments often reflect aggressive market activity and can be used to confirm potential breakouts or reversals.
How It Works (High-Level Overview)
The tool continuously monitors two primary conditions:
Price Expansion – Identifies large-bodied candles compared to recent averages.
Volume Expansion – Confirms that the move is supported by above-average trading activity.
When both conditions are present, the candle is marked:
🟢 Mega Bull – Strong bullish pressure.
🔴 Mega Bear – Strong bearish pressure.
Key Features
Automatic Timeframe Adjustment – Detection sensitivity changes based on chart timeframe, so results stay relevant from 1-minute scalps to multi-day swing setups.
Clear Visual Output – Significant candles are highlighted directly on the chart for easy recognition.
Optional Labels – Toggle on/off text labels (“Mega Bull” / “Mega Bear”) for a cleaner chart view.
Alert Integration – Set TradingView alerts to be notified immediately when a qualifying candle appears.
Universal Compatibility – Works on Forex, Commodities, Indices, Crypto, Stocks, ETFs, and Futures.
Practical Uses for Traders
As a confirmation tool when price approaches support/resistance or Fibonacci levels.
To filter low-quality setups by focusing only on moments where both price and volume confirm the move.
As part of a trend-following or breakout strategy when combined with other analysis methods.
Using the Indicator
Add the indicator to any chart and select your preferred timeframe.
Watch for highlighted candles – they indicate significant combined momentum and liquidity.
Use as a signal filter or confirmation alongside your existing trading system.
Optional: Set alerts to receive push/email/webhook notifications.
===================================
📌 MEGA BAR TRADING CHEAT SHEET
Spot Big Money. Ride the Move.
===================================
🧠 WHAT’S A MEGA BAR?
A Mega Bar is a candle so big it makes the rest look tiny — and it often means institutions are making a move.
Check the 4 Rules:
✅ Body size ≥ 2x average
✅ High relative volume (vs. last 20 bars)
✅ Closes near high (bull) or low (bear)
✅ Comes after sideways chop or price squeeze
📈 WHY IT MATTERS
Mega Bars = intent, not random spikes.
🟢 Mega Bull near support/Fib pullback → Likely accumulation
🔴 Mega Bear near resistance/Fib extension → Likely distribution or trap
🔧 HOW TO TRADE IT
1. WAIT FOR IT
No Mega Bar → No trade.
Mega Bull (big green) → BUY bias.
Mega Bear (big red) → SELL bias.
2. FIND THE SPOT
Fib levels: 61.8% / 78.6% / 138.2%
Major Support/Resistance
3. CONFIRM ON BIGGER TIMEFRAME
Example: 15M Mega Bar → Check 1H trend direction.
4. SET YOUR LEVELS
Stop-Loss:
Long → Below Mega Bull low (+0.2×ATR)
Short → Above Mega Bear high (+0.2×ATR)
Take-Profit:
Fib extensions: 127.2% / 161.8% / 261.8%
Prior highs/lows
5. RISK SMART
Risk 1–2% max per trade
Aim for 2:1+ R:R
🌍 WORKS ON:
Forex • Commodities • Stocks • Crypto • Indices
THE RETAILER’S FORMULA:
🟢 Big Green → Buy
🔴 Big Red → Sell
🎯 Fibs = Payday
One setup. One signal. Discipline = profit.

Market Sessions — FOREXSOM Editionding for chart screenshots and videos.
Cleaner Interface: Organized settings into clear groups for a smoother user experience.
Bug Fixes: Improved “Only Last…” logic for more stable plotting.
Why I Use and Recommend It:
Easily spot active trading sessions with visual clarity.
Identify key institutional price levels in real time.
Ideal for day traders, swing traders, and anyone applying Smart Money Concepts.
Fully customizable colors and styles to fit any personal workflow.

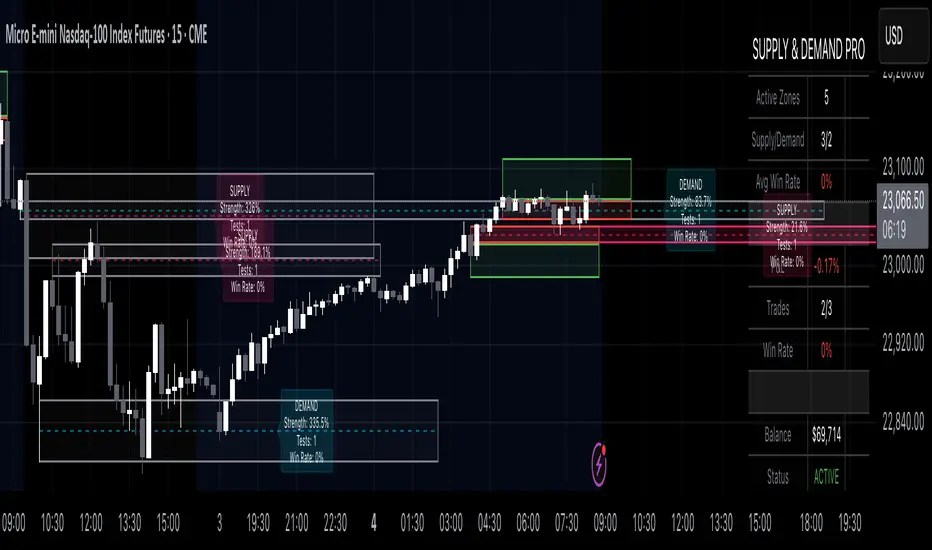
Supply & Demand Pro [Institutional]🎯 Overview
The most comprehensive Supply & Demand indicator on TradingView, designed for serious traders and prop firm professionals. Unlike traditional S&D indicators that just draw pretty zones, this system tracks actual performance metrics, provides entry/exit signals, and includes professional risk management tools.
❓ Why This Indicator?
After extensive research into what traders actually need (not just want), this indicator addresses the TOP complaints about Supply & Demand trading:
- ❌ "I don't know which zones to trust" → ✅ Each zone shows historical win rate
- ❌ "No clear entry/exit rules" → ✅ Multiple entry methods with visual R:R
- ❌ "Can't backtest effectiveness" → ✅ Full performance tracking
- ❌ "Too many false signals" → ✅ Quality filters and volume validation
🚀 Key Features
🎯 Professional Zone Detection
- Volume Profile Analysis (finds institutional accumulation/distribution)
- Swing Point Detection (classic pivot-based zones)
- Order Flow Analysis (coming in v2)
- Hybrid Mode (combines multiple methods)
📊 Performance Analytics
- Individual zone win rates
- Daily P&L tracking
- Account balance simulation
- Success/failure ratio for each zone
- Historical performance data
💼 Prop Firm Tools
- Daily loss limits (auto-stops trading)
- Position sizing controls
- Maximum concurrent positions
- Daily profit targets
- Clean reporting for evaluations
🎨 Entry & Risk Management
- Zone Edge entry (immediate)
- 50% Retracement entry (patient)
- Momentum Confirmation entry
- Visual Risk:Reward boxes
- Multiple stop loss methods (ATR, Fixed %, Zone-based)
📈 Advanced Features
- Auto-removes failed zones
- Volume confirmation requirements
- Strength-based zone ranking
- Smart alerts for high-probability setups
- Multi-timeframe compatibility
📋 How It Works
1. Zone Creation: Continuously scans for high-quality supply/demand zones using your selected method
2. Quality Filtering: Each zone must pass strength, volume, and historical performance filters
3. Visual Feedback: Zones display strength %, test count, and win rate directly on chart
4. Trade Signals: When price touches a zone, the system calculates entry, stop, and target
5. Performance Tracking: Every zone touch is tracked to build historical win rates
⚙️ Quick Settings Guide
For Beginners:
- Detection Method: "Swing Points"
- Min Zone Strength: 15%
- Risk:Reward: 2:1
- Entry Method: "Zone Edge"
For Advanced Traders:
- Detection Method: "Volume Profile"
- Min Zone Strength: 20%
- Min Win Rate: 50%
- Entry Method: "Momentum Confirm"
For Prop Firm Traders:
- Enable all Prop Firm Tools
- Set Daily Loss Limit to your drawdown rules
- Max Positions: 2-3
- Use "Professional" theme for screenshots
📊 What Makes This Different?
Traditional S&D Indicators:
- Draw zones based on one method
- No performance tracking
- No entry/exit rules
- Can't verify effectiveness
Supply & Demand Pro:
- Multiple detection methods
- Tracks win rate for EVERY zone
- Clear entry/exit signals
- Full backtesting capability
- Risk management built-in
🎓 Best Practices
1. Start Conservative: Use higher strength requirements (20%+) until familiar
2. Trust the Data: Zones with 3+ tests and 60%+ win rate are golden
3. Respect Risk Limits: The daily loss limit feature will save your account
4. Volume Matters: Zones with volume confirmation are significantly stronger
5. Be Patient: Wait for high-probability setups (check the win rate!)
🔔 Alert Options
- Zone Touch Alerts (with strength & win rate)
- High Probability Setups (60%+ win rate zones)
- Daily Limit Warnings
- Risk Management Alerts
💡 Pro Tips
- Combine with market structure for best results
- Higher timeframe zones are more reliable
- Watch for zones that align with round numbers
- Use partial profits feature to lock in gains
- Review daily performance to improve
🐛 Troubleshooting
- No zones appearing? → Lower Min Zone Strength to 10%
- Too many zones? → Increase strength requirement or enable filters
- Win rates not updating? → Zones need multiple tests to calculate
⚡ Performance Note
This indicator uses advanced calculations and may take a moment to load on lower-end devices. The comprehensive analytics are worth the wait!
🎁 Bonus Features
- 4 Professional themes
- Customizable dashboard
- R:R visualization
- Zone strength ranking
- Session-based filtering (coming soon)
📧 Support & Updates
This is an actively maintained indicator. Updates include:
- New detection methods
- Enhanced analytics
- Community-requested features
- Performance optimizations
⭐ If you find this indicator helpful, please leave a rating and comment with your results!
📌 Remember: No indicator is perfect. Always use proper risk management and never risk more than you can afford to lose.
SMT Divergences V2 [OutOfOptions]Smart Money Technique (SMT) Divergence is designed to identify discrepancies between correlated assets within the same timeframe. It occurs when two related assets exhibit opposing signals, such as one forming a higher low while the other forms a lower low. This technique is particularly useful for anticipating market shifts or reversals before they become evident through other Premium Discount (PD) Arrays.
This indicator works by identifying the highs and lows that have formed for an asset on the current chart and the correlated symbol defined in the settings. Once a pivot on either asset is formed, it checks if the pivot has taken liquidity as identified by the previous pivot in the same direction (i.e., a new high taking out a previous high). If this is the case and the corresponding asset has not taken a similar pivot, the condition is determined to be a potential valid divergence. The indicator will then filter out SMTs formed by adjacent candles, requiring at least one candle difference between the candles forming the SMT.
If the “Candle Direction Validation” setting is enabled, the indicator will further check both assets to ensure that for bullish SMTs, the last high on both assets was formed by down candle, and for bearish SMTs, the low was formed by an up candle. This check can often eliminate low-probability SMTs that are frequently broken.
The referenced chart shows divergence between Nasdaq (NQ) and S&P 500 (ES) futures, which are normally closely correlated assets that move in the same direction. The lines shown represent bullish and bearish divergences between the two when they are formed. As you can see from the chart, SMT Divergences may not always indicate a reversal, or a reversal might be just a short-term retrace. Therefore, SMT Divergences should not be used independently. However, in conjunction with other PD arrays, they can provide strong confirmation of a change in market direction.
Configurability:
Pivot strength - Indicates how many bars to the left/right of a high for pivot to be considered, recommended to keep at 1 for maximum detection speed
Candle Direction Validation - Additional SMT validation to filter out weak/low-probability SMTs be examining candle direction
Remove Broken SMTs - Keeps the chart clean by removing broken (invalidate) SMTs from the chart, once price moves beyond the outmost edge of the SMT
Work in Realtime - Enabled real-time mode for even faster detection of SMTs
Line Styling for Bullish/Bearish SMTs - Ability to customize line style, color & width for bullish/bearish SMTs
Label Control - Whether or not to show SMT label and if shown what font size & color should be used and if labels should include a tooltip containing information about the SMT
What makes this indicator different:
When used on NQ/ES it will automatically detect the matching the corresponding ticker, i.e. if you have chart on NQU2025 it'll automatically match to ESU2025 and vice-versa. Works for mini/micro/continuous contract
Unlike other SMT indicators, this indicator has an option to remove broken (no longer valid SMTs)
Allows real-time detection of SMTs prior to the pivot being fully formed
Allows validation of SMTs to only display high-probability SMTs, that are more likely to signal a possible reversal
Includes alerting capability for both SMT creation and when the SMT is broken (invalidated)

52SIGNAL RECIPE CME Gap Support & Resistance Detector═══ 52SIGNAL RECIPE CME Gap Support & Resistance Detector ═══
◆ Overview
The 52SIGNAL RECIPE CME Gap Support & Resistance Detector is an advanced technical indicator that automatically detects and visualizes all types of price gaps occurring in the CME Bitcoin futures market on trading charts. It captures not only gaps formed during weekend and holiday closures, but also those created during the daily 1-hour maintenance period on weekdays, and sudden price gaps resulting from economic indicator releases or news events.
The core value of this indicator lies beyond simply displaying gaps; it visualizes how these price discontinuities act as powerful support and resistance zones that influence future price movements. In real markets, these CME gaps have a high probability of either being "filled" or functioning as important reaction zones, providing traders with valuable entry and exit signals.
─────────────────────────────────────
◆ Key Features
• Comprehensive Gap Detection: Detects gaps in all market conditions
- Weekend/holiday closure gaps
- Weekday 1-hour maintenance period gaps
- Gaps from economic indicators/news events causing rapid price changes
• Intuitive Color Coding:
- Blue: When gaps act as support (price is above the gap)
- Red: When gaps act as resistance (price is below the gap)
- Gray: Filled gaps (price has completely passed through the gap area)
• Real-time Role Switching: Automatically changes colors as price moves above/below gaps, visualizing support↔resistance role transitions
• Status Tracking System: Automatically tracks whether gaps are "Filled" or "Unfilled"
• Dynamic Boxes: Clearly marks gap areas with boxes and dynamically changes colors based on price movement
• Precise Labeling: Accurately displays the price range of each gap to support trader decision-making
• Smart Filtering: Improved algorithm that solves consecutive gap detection issues for complete gap tracking
• Key Usage Points:
- Pay special attention when price approaches gap areas
- Color changes in gaps signal important market sentiment shifts
- Areas with multiple clustered gaps are particularly strong reaction zones
─────────────────────────────────────
◆ User Guide: Understanding Gap Roles Through Colors
■ Color System Interpretation
• Blue Gaps (Support Role):
▶ Meaning: Current price is above the gap, making the gap act as support
▶ Trading Application: Consider buying opportunities when price approaches blue gap areas
▶ Psychological Meaning: Buying pressure likely to increase at this price level
• Red Gaps (Resistance Role):
▶ Meaning: Current price is below the gap, making the gap act as resistance
▶ Trading Application: Consider selling opportunities when price approaches red gap areas
▶ Psychological Meaning: Selling pressure likely to increase at this price level
• Gray Gaps (Filled Gaps):
▶ Meaning: Price has completely passed through the gap area, filling the gap
▶ Reference Value: Still valuable as reference for past important reaction zones
▶ Trading Application: Used to confirm trend strength and identify key psychological levels
■ Understanding Color Transitions
• Blue → Red Transition:
▶ Meaning: Price has fallen below the gap, changing its role from support to resistance
▶ Market Interpretation: Breakdown of previous support strengthens bearish signals
▶ Trading Application: Consider potential further decline; check gap bottom as resistance during bounces
• Red → Blue Transition:
▶ Meaning: Price has risen above the gap, changing its role from resistance to support
▶ Market Interpretation: Breakout above previous resistance strengthens bullish signals
▶ Trading Application: Consider potential further rise; check gap top as support during pullbacks
─────────────────────────────────────
◆ Practical Application Guide
■ Basic Trading Scenarios
• Blue Gap Support Strategy:
▶ Entry Point: When price approaches the top of a blue gap and forms a bounce candle
▶ Stop Loss: Below the gap bottom (if price completely breaks down through the gap)
▶ Take Profit: Previous swing high or next resistance level above
▶ Probability Enhancers: Gap aligned with major moving averages, oversold RSI, strong bounce candle pattern
• Red Gap Resistance Strategy:
▶ Entry Point: When price approaches the bottom of a red gap and forms a rejection candle
▶ Stop Loss: Above the gap top (if price completely breaks up through the gap)
▶ Take Profit: Previous swing low or next support level below
▶ Probability Enhancers: Gap aligned with major moving averages, overbought RSI, strong rejection candle pattern
■ Advanced Pattern Applications
• Multiple Gap Cluster Identification:
▶ Several gaps in close price proximity form extremely powerful support/resistance zones
▶ Same-color gap clusters: Very strong single-direction reaction zones
▶ Mixed-color gap clusters: High volatility zones with bidirectional reactions expected
• Gap Sequence Analysis:
▶ Consecutive same-direction gaps: Strong trend confirmation signal
▶ Increasing gap size pattern: Trend acceleration signal
▶ Decreasing gap size pattern: Trend weakening signal
• News/Indicator Release Gap Utilization:
▶ Gaps formed immediately after economic indicators: Measure market shock intensity
▶ Gap color change observation: Track market reinterpretation of news
▶ Gap filling speed analysis: Evaluate news impact duration
• Key Attention Points:
▶ Pay special attention to the chart whenever price approaches gap areas
▶ Gap color changes signal important market sentiment shifts
▶ Areas with multiple concentrated gaps are likely to show strong price reactions
─────────────────────────────────────
◆ Technical Foundation
■ CME Gap Formation Principles
• Key Gap Formation Scenarios:
▶ Weekend Closures (Friday close → Monday open): Most common CME gap formation point
▶ Holiday Closures: Gaps occurring due to CME closures on US holidays
▶ Weekday 1-hour Maintenance: Gaps during daily CME maintenance period (16:00-17:00 CT)
▶ Major Economic Indicator Releases: Gaps from rapid price changes during US employment reports, FOMC decisions, CPI releases, etc.
▶ Significant News Events: Gaps from regulatory announcements, geopolitical events, market shocks, etc.
• Psychological Importance of Gaps:
▶ Zones where price formation did not occur, representing imbalance between buying/selling forces
▶ Gap areas have no actual trading, resulting in accumulated potential orders
▶ Reflect institutional investor positions and liquidity distribution in the CME futures market
■ Support/Resistance Mechanism
• Psychological Level Formation Mechanism:
▶ Unexecuted order accumulation in gap areas: Loss of ordering opportunity at those price levels
▶ Liquidity imbalance: No trading occurred in gap areas, creating liquidity voids
▶ Institutional activity: Institutional participants in CME futures markets pay attention to these gap areas
• Evidence of Support/Resistance Function:
▶ Statistical gap fill phenomenon: Most gaps eventually "fill" (price returns to gap area)
▶ Gap-based reactions: Increased frequency of price reactions (bounces/rejections) when reaching gap areas
▶ Market psychology impact: Influences traders' perceived value and fair price assessment
─────────────────────────────────────
◆ Advanced Configuration Options
■ Visualization Settings
• Show Gap Labels (Default: On)
▶ On: Displays price ranges of each gap numerically for precise support/resistance level identification
▶ Off: Hides labels for visual cleanliness
• Color Settings
▶ Filled Gap Color: Gray tones, shows gaps already traversed by price
▶ Unfilled Gap Color - Support: Blue, shows gaps currently acting as support
▶ Unfilled Gap Color - Resistance: Red, shows gaps currently acting as resistance
■ Data Management Settings
• Filled Gap Storage Limit (Default: 10)
▶ Sets maximum number of filled gaps to retain on chart
▶ Recommended settings: Short-term traders (5-8), Swing traders (8-12), Position traders (10-15)
• Maximum Gap Retention Period (Default: 12 months)
▶ Sets period after which old unfilled gaps are automatically removed
▶ Recommended settings: Short-term analysis (3-6 months), Medium-term analysis (6-12 months), Long-term analysis (12-24 months)
─────────────────────────────────────
◆ Synergy with Other Indicators
• Volume Profile: Greatly increased reaction probability when CME gaps align with Volume Profile value areas
• Fibonacci Retracements: Formation of powerful reaction zones when major Fibonacci levels coincide with gap areas
• Moving Averages: Areas where major moving averages overlap with CME gaps act as "composite support/resistance"
• Horizontal Support/Resistance: Very strong price reactions expected when historical key price levels align with CME gaps
• Market Sentiment Indicators (RSI/MACD): Assess reaction probability by checking oversold/overbought conditions when price approaches gap areas
─────────────────────────────────────
◆ Conclusion
The 52SIGNAL RECIPE CME Gap Support & Resistance Detector is not merely a gap display tool, but an advanced analytical tool that visualizes important support/resistance areas where price may strongly react, using intuitive color codes (blue=support, red=resistance). It detects all types of gaps without omission, whether from weekend and holiday closures, weekday 1-hour maintenance periods, important economic indicator releases, or market shock situations.
The core value of this indicator lies in clearly expressing through intuitive color coding that gaps are not simple price discontinuities, but psychological support/resistance areas that significantly influence future price action. Traders can instantly identify areas where blue gaps act as support and red gaps act as resistance, enabling quick and effective decision-making.
By referencing the color codes when price approaches gap areas to predict possible price reactions, and especially interpreting color transition moments (blue→red or red→blue) as signals of important market sentiment changes and integrating them into trading strategies, traders can capture higher-probability trading opportunities.
─────────────────────────────────────
※ Disclaimer: Like all trading tools, the CME Gap Detector should be used as a supplementary indicator and not relied upon alone for trading decisions. Past gap reaction patterns cannot guarantee the same behavior in the future. Always use appropriate risk management strategies.
═══ 52SIGNAL RECIPE CME Gap Support & Resistance Detector ═══
◆ 개요
52SIGNAL RECIPE CME Gap Support & Resistance Detector는 CME 비트코인 선물 시장에서 발생하는 모든 유형의 가격 갭(Gap)을 자동으로 감지하여 트레이딩 차트에 시각화하는 고급 기술적 지표입니다. 주말과 공휴일 휴장은 물론, 평일 1시간 휴장 시간, 그리고 중요 경제지표 발표나 뉴스 이벤트 시 발생하는 급격한 가격 갭까지 누락 없이 포착합니다.
이 인디케이터의 핵심 가치는 단순히 갭을 표시하는 것을 넘어, 이러한 가격 불연속성이 미래 가격 움직임에 영향을 미치는 강력한 지지(Support)와 저항(Resistance) 영역으로 작용한다는 원리를 시각화하는 데 있습니다. 실제 시장에서 이러한 CME 갭은 높은 확률로 미래에 "매꿔지거나" 중요한 반응 구간으로 기능하여 트레이더에게 귀중한 진입/퇴출 신호를 제공합니다.
─────────────────────────────────────
◆ 주요 특징
• 전방위 갭 감지: 모든 시장 조건에서 발생하는 갭을 감지
- 주말/공휴일 휴장 갭
- 평일 1시간 휴장 시간 갭
- 경제지표/뉴스 이벤트 시 급격한 가격 변동 갭
• 직관적 색상 구분:
- 파란색: 갭이 지지 역할을 할 때(가격이 갭 위에 있을 때)
- 빨간색: 갭이 저항 역할을 할 때(가격이 갭 아래에 있을 때)
- 회색: 이미 매꿔진 갭(가격이 갭 영역을 완전히 통과)
• 실시간 역할 전환: 가격이 갭 위/아래로 이동함에 따라 지지↔저항 역할 전환을 자동으로 색상 변경으로 시각화
• 상태 추적 시스템: 갭이 "매꿔짐(Filled)" 또는 "매꿔지지 않음(Unfilled)" 상태를 자동 추적
• 다이나믹 박스: 갭 영역을 명확한 박스로 표시하고 가격 움직임에 따라 동적으로 색상 변경
• 정밀 레이블링: 각 갭의 가격 범위를 정확히 표시하여 트레이더의 의사결정 지원
• 스마트 필터링: 연속적 갭 감지 문제를 해결하는 개선된 알고리즘으로 누락 없는 갭 추적
• 핵심 활용 포인트:
- 가격이 갭 영역에 접근할 때 특별히 주목하세요
- 갭 색상 변경 시점은 중요한 시장 심리 변화 신호입니다
- 여러 갭이 밀집된 영역은 특히 강한 반응이 예상되는 구간입니다
─────────────────────────────────────
◆ 사용 가이드: 색상으로 이해하는 갭 역할
■ 색상 시스템 해석법
• 파란색 갭 (지지 역할):
▶ 의미: 현재 가격이 갭 위에 있어 갭이 지지선으로 작용
▶ 트레이딩 응용: 가격이 파란색 갭 영역으로 하락 접근 시 매수 기회 고려
▶ 심리적 의미: 매수세력이 이 가격대에서 수요 증가 가능성
• 빨간색 갭 (저항 역할):
▶ 의미: 현재 가격이 갭 아래에 있어 갭이 저항선으로 작용
▶ 트레이딩 응용: 가격이 빨간색 갭 영역으로 상승 접근 시 매도 기회 고려
▶ 심리적 의미: 매도세력이 이 가격대에서 공급 증가 가능성
• 회색 갭 (매꿔진 갭):
▶ 의미: 가격이 갭 영역을 완전히 통과하여 갭이 매꿔진 상태
▶ 참조 가치: 과거 중요 반응 구간으로 여전히 참고 가치 있음
▶ 트레이딩 응용: 추세 강도 확인 및 주요 심리적 레벨 식별에 활용
■ 색상 전환 이해하기
• 파란색 → 빨간색 전환:
▶ 의미: 가격이 갭 아래로 하락하여 갭이 지지에서 저항으로 역할 변경
▶ 시장 해석: 이전 지지선 붕괴로 약세 신호 강화
▶ 트레이딩 응용: 추가 하락 가능성 고려, 반등 시 갭 하단 저항 확인
• 빨간색 → 파란색 전환:
▶ 의미: 가격이 갭 위로 상승하여 갭이 저항에서 지지로 역할 변경
▶ 시장 해석: 이전 저항선 돌파로 강세 신호 강화
▶ 트레이딩 응용: 추가 상승 가능성 고려, 조정 시 갭 상단 지지 확인
─────────────────────────────────────
◆ 실전 활용 가이드
■ 기본 트레이딩 시나리오
• 파란색 갭 지지 전략:
▶ 진입 시점: 가격이 파란색 갭 상단에 접근하여 반등 캔들 형성 시
▶ 손절 위치: 갭 하단 아래(갭 완전히 하향 돌파 시)
▶ 이익실현: 이전 스윙 고점 또는 상방 다음 저항선
▶ 확률 증가 조건: 갭과 주요 이동평균선 일치, 과매도 RSI, 강한 반등 캔들
• 빨간색 갭 저항 전략:
▶ 진입 시점: 가격이 빨간색 갭 하단에 접근하여 거부 캔들 형성 시
▶ 손절 위치: 갭 상단 위(갭 완전히 상향 돌파 시)
▶ 이익실현: 이전 스윙 저점 또는 하방 다음 지지선
▶ 확률 증가 조건: 갭과 주요 이동평균선 일치, 과매수 RSI, 강한 거부 캔들
■ 고급 패턴 활용법
• 다중 갭 클러스터 식별:
▶ 여러 갭이 근접한 가격대에 있다면 더욱 강력한 지지/저항 존
▶ 동일 색상 갭 클러스터: 매우 강력한 단일 방향 반응 구간
▶ 색상 혼합 갭 클러스터: 심한 변동성과 양방향 반응 예상 구간
• 갭 시퀀스 분석:
▶ 연속적인 동일 방향 갭: 강한 추세 확인 신호
▶ 갭 크기 증가 패턴: 추세 가속화 신호
▶ 갭 크기 감소 패턴: 추세 약화 신호
• 뉴스/지표 발표 후 갭 활용:
▶ 경제지표 발표 직후 형성된 갭: 시장 충격 강도 측정
▶ 갭 색상 변화 관찰: 시장의 뉴스 재해석 과정 파악
▶ 갭 매꿈 속도 분석: 뉴스 임팩트의 지속성 평가
• 핵심 주목 포인트:
▶ 가격이 갭 영역에 접근할 때마다 차트를 특별히 주목하세요
▶ 갭 색상이 변경되는 시점은 중요한 시장 심리 변화를 의미합니다
▶ 여러 갭이 밀집된 영역은 가격이 강하게 반응할 가능성이 높습니다
─────────────────────────────────────
◆ 기술적 기반
■ CME 갭의 발생 원리
• 주요 갭 발생 상황:
▶ 주말 휴장 (금요일 종가 → 월요일 시가): 가장 일반적인 CME 갭 형성 시점
▶ 공휴일 휴장: 미국 공휴일에 따른 CME 휴장 시 발생
▶ 평일 1시간 휴장: CME 시장의 일일 정비 시간(16:00~17:00 CT) 동안 발생
▶ 주요 경제지표 발표: 미 고용지표, FOMC 결정, CPI 등 발표 시 급격한 가격 변동으로 인한 갭
▶ 중요 뉴스 이벤트: 규제 발표, 지정학적 이벤트, 시장 충격 등으로 인한 급격한 가격 변화
• 갭의 심리적 중요성:
▶ 가격 형성이 이루어지지 않은 구간으로, 매수/매도 세력의 불균형 영역
▶ 갭 구간에는 실제 거래가 없었기 때문에 잠재적 주문이 누적되는 영역
▶ 기관 투자자들의 선물 포지션과 유동성 분포가 반영된 중요한 가격 레벨
■ 지지/저항으로 작용하는 원리
• 심리적 레벨 형성 메커니즘:
▶ 갭 구간의 미실행 주문 축적: 갭 발생 시 해당 가격대에 대한 주문 기회 상실
▶ 유동성 불균형: 갭 구간에는 거래가 없었으므로 유동성 공백 발생
▶ 기관 투자자 활동: CME 선물 시장의 기관 참여자들은 이러한 갭 영역에 관심
• 지지/저항 작용 증거:
▶ 통계적 갭 필 현상: 대부분의 갭은 미래에 "매꿔짐"(가격이 갭 구간으로 회귀)
▶ 갭 기반 반응: 갭 영역에 도달 시 가격 반응(반등/거부) 발생 빈도 증가
▶ 시장 심리 영향: 트레이더들의 인지된 가치와 공정가격 평가에 영향
─────────────────────────────────────
◆ 고급 설정 옵션
■ 시각화 설정
• 라벨 표시 설정 (Show Gap Labels) (기본값: 켜짐)
▶ 켜짐: 각 갭의 가격 범위를 숫자로 표시하여 정확한 지지/저항 레벨 확인
▶ 꺼짐: 시각적 깔끔함을 위해 라벨 숨김
• 색상 설정
▶ 매꿔진 갭 색상(Filled Gap Color): 회색 계열, 이미 가격이 통과한 갭 표시
▶ 미매꿔진 갭 색상 - 지지(Support): 파란색, 현재 지지 역할을 하는 갭
▶ 미매꿔진 갭 색상 - 저항(Resistance): 빨간색, 현재 저항 역할을 하는 갭
■ 데이터 관리 설정
• 매꿔진 갭 저장 한도 (Filled Gap Storage Limit) (기본값: 10)
▶ 이미 매꿔진 갭을 최대 몇 개까지 차트에 유지할지 설정
▶ 권장 설정: 단기 트레이더(5-8), 스윙 트레이더(8-12), 포지션 트레이더(10-15)
• 최대 갭 보관 기간 (Maximum Gap Retention Period) (기본값: 12개월)
▶ 오래된 미매꿔진 갭을 자동으로 제거하는 기간 설정
▶ 권장 설정: 단기 분석(3-6개월), 중기 분석(6-12개월), 장기 분석(12-24개월)
─────────────────────────────────────
◆ 다른 지표와의 시너지
• 볼륨 프로파일: CME 갭과 볼륨 프로파일의 밸류 영역 일치 시 반응 확률 크게 증가
• 피보나치 리트레이스먼트: 주요 피보나치 레벨과 갭 영역 일치 시 강력한 반응 존 형성
• 이동평균선: 주요 이동평균선과 CME 갭이 겹치는 영역은 "복합 지지/저항"으로 작용
• 수평 지지/저항: 과거 중요 가격대와 CME 갭 일치 시 매우 강력한 가격 반응 예상 가능
• 시장 심리 지표(RSI/MACD): 갭 영역 접근 시 과매수/과매도 확인으로 반응 가능성 판단
─────────────────────────────────────
◆ 결론
52SIGNAL RECIPE CME Gap Support & Resistance Detector는 단순한 갭 표시 도구가 아닌, 가격이 강하게 반응할 수 있는 중요한 지지/저항 영역을 직관적인 색상 코드(파란색=지지, 빨간색=저항)로 시각화하는 고급 분석 도구입니다. 주말과 공휴일 휴장 시간뿐만 아니라, 평일 1시간 휴장 시간, 중요 경제지표 발표, 그리고 시장 충격 상황에서 발생하는 모든 유형의 갭을 누락 없이 감지합니다.
인디케이터의 핵심 가치는 갭이 단순한 가격 불연속성이 아닌, 미래 가격 행동에 중요한 영향을 미치는 심리적 지지/저항 영역임을 직관적인 색상 코드로 명확히 표현하는 데 있습니다. 파란색 갭은 지지 역할을, 빨간색 갭은 저항 역할을 하는 영역을 즉각적으로 식별할 수 있어 트레이더가 빠르고 효과적인 의사결정을 내릴 수 있도록 도와줍니다.
갭 영역에 접근할 때마다 색상 코드를 참고하여 가능한 가격 반응을 예측하고, 특히 색상 전환이 일어나는 순간(파란색→빨간색 또는 빨간색→파란색)은 중요한 시장 심리 변화 신호로 해석하여 트레이딩 전략에 통합한다면, 더 높은 확률의 거래 기회를 포착할 수 있을 것입니다.
─────────────────────────────────────
※ 면책 조항: 모든 트레이딩 도구와 마찬가지로, CME Gap Detector는 보조 지표로 사용되어야 하며 단독으로 거래 결정을 내리는 데 사용해서는 안 됩니다. 과거의 갭 반응 패턴이 미래에도 동일하게 작용한다고 보장할 수 없습니다. 항상 적절한 리스크 관리 전략을 사용하세요.

Sweep Swing Screener [TradingFinder]🔵 Introduction
Understanding how liquidity forms and how price reacts around key structural levels is essential for identifying precise, low-risk entry points. The Sweep Swing Screener is a specialized tool developed to continuously monitor market activity and detect liquidity sweeps, reaction zones, and valid confirmation candles across various trading instruments and timeframes.
This tool can be applied both to scan multiple symbols at once and to analyze all timeframes of a specific asset for potential reversal points. It begins by identifying a clear swing point, whether a swing high or a swing low, and then outlines a reaction zone between that level and either the highest or lowest value of the swing candle's open or close.
If the price revisits this zone, performs a liquidity grab, and prints an indecision candle like a doji or a narrow-bodied bar that closes within the zone, this may indicate a rejection of the level and the failure of a breakout attempt. At that moment, depending on the context, the screener may identify a bullish or bearish reversal and generate a corresponding Long or Short signal.
By emphasizing accurate entry timing, alignment with institutional order flow, and avoidance of common traps, this approach highlights market areas where liquidity engineering, reversal probability, and price inefficiency come together. As a result, the Sweep Swing Screener becomes a valuable part of any trader’s toolkit, particularly for those who rely on price action and liquidity logic to drive their decisions. It allows traders to focus on clean, actionable setups without getting lost in noise or misleading breakouts.
🔵 How to Use
The Sweep Swing Screener is designed to track market structure in real time and alert users when conditions for a potential reversal are present. Its methodology combines liquidity behavior with swing analysis and candle confirmation, all within predefined reaction zones.
To better understand this logic, consider a basic market flow where a swing high or low forms, followed by a return to that level. If the price sweeps the previous extreme and forms a confirming candle within the reaction zone, a signal is issued.
🟣 Long Signal
To identify a long setup, the screener looks for a valid swing low, often a level below which sell-side liquidity is likely to be clustered. Once found, it defines a reaction zone from the swing low to the lowest point between the candle’s open and close.
If the price returns to this area and creates a lower wick that extends beneath the swing low, the tool checks whether the price manages to close back inside the range, rejecting the breakdown. This indicates absorption of selling pressure and failure to sustain the move lower.
The screener then waits for a confirmation candle to appear. Typically, this is a doji or other small-bodied candle that closes inside the zone. If these conditions are met, the screener records a Long signal for that asset and, if enabled, sends a notification to alert the user.
🟣 Short Signal
For bearish setups, the screener begins by identifying a valid swing high, which usually marks a level where buy-side liquidity is concentrated. It then creates a reaction zone from the swing high to the highest point between the candle’s open and close.
When price returns to this level, sweeps above the swing high, and then fails to close higher, it may signal the presence of a bull trap and early exhaustion in the upward move.
A confirmation candle, usually a doji or a rejection bar that closes back within the zone, is then required. Once that occurs, the screener marks the asset with a Short signal and optionally sends a real-time alert to the user.
This type of setup helps highlight potential institutional sell zones, offering insight into where price is likely to reverse following a liquidity event.
🔵 Settings
🟣 Logical settings
Swing period : You can set the swing detection period.
Max Swing Back Method : It is in two modes "All" and "Custom". If it is in "All" mode, it will check all swings, and if it is in "Custom" mode, it will check the swings to the extent you determine.
Max Swing Back : You can set the number of swings that will go back for checking.
Maximum Distance Between Swing and Signal : The maximum number of candles allowed between the swing point and the potential signal. The default value is 50, ensuring that only recent and relevant price reactions are considered valid.
🟣 Display Settings
Table Size : Lets you adjust the table’s visual size with options such as: auto, tiny, small, normal, large, huge.
Table Position : Sets the screen location of the table. Choose from 9 possible positions, combining vertical (top, middle, bottom) and horizontal (left, center, right) alignments.
🟣 Symbol Settings
Each of the 10 symbol slots comes with a full set of customizable parameters :
Symbol : Define or select the asset (e.g., XAUUSD, BTCUSD, EURUSD, etc.).
Timeframe : Set your desired timeframe for each symbol (e.g., 15, 60, 240, 1D).
🟣 Alert Settings
Alert : Enables alerts for SSS.
Message Frequency : Determines the frequency of alerts. Options include 'All' (every function call), 'Once Per Bar' (first call within the bar), and 'Once Per Bar Close' (final script execution of the real-time bar). Default is 'Once per Bar'.
Show Alert Time by Time Zone : Configures the time zone for alert messages. Default is 'UTC'.
🔵 Conclusion
The Sweep Swing Screener provides a systematic method for identifying potential reversal zones by combining price structure, liquidity behavior, and candle-based confirmation. In markets that are often noisy and full of failed breakouts, focusing on these three elements helps clarify directional bias and supports more confident decision-making.
With the ability to scan multiple symbols and timeframes efficiently, this tool allows traders to stay focused on high-quality setups without the need to manually sift through dozens of charts. The inclusion of optional alerts further enhances its utility by offering timely updates when criteria are met.
By moving away from reactive strategies and toward structural anticipation, this screener supports traders who align their methods with institutional logic and the mechanics of smart money.
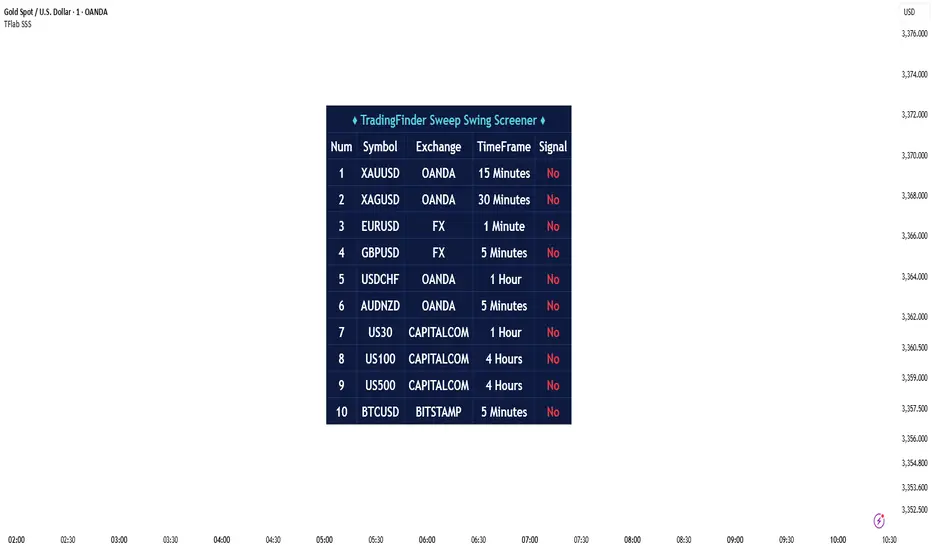
Liquidity mark-out indicator(by Lumiere)This indicator marks out every High that has a bullish candle followed by a bearish one, vice versa for lows.
Once the price reaches the marked-out liquidity, the line is removed automatically.
This indicator only shows the current liquidity of the time frame you are at.
(To get it look like the picture just chance the length to 30-50)
Key Features of the Liquidity Mark-Out Indicator:
🔹 Identifies Liquidity Zones – Marks highs and lows based on candlestick patterns.
🔹 Customizable Settings – Toggle highs/lows visibility 🎚️, adjust line colors 🎨, and set line length (bars) 📏.
🔹 Smart Clean-Up – Automatically removes swept levels (when price breaks through) for a clean chart 🧹.
🔹 Pattern-Based Detection –
Highs: Detects two-candle reversal patterns (🟢 bullish close → 🔴 bearish close).
Lows: Detects two-candle reversal patterns (🔴 bearish close → 🟢 bullish close).
🔹 Dynamic Lines – Projects liquidity levels forward (adjustable length) to track key zones 📈.
Perfect For Traders Looking To:
✅ Spot potential liquidity grabs 🎯
✅ Identify key support/resistance levels 🛑
✅ Clean up their chart from outdated levels 🖥️

PoiBox# PoiBox: Advanced Market Structure and POI Visualization Tool
PoiBox is a comprehensive market structure analysis tool designed to identify high-probability trading zones through advanced internal market structure (IDM) detection and points of interest (POI) calculation.
## How It Works
The indicator uses a multi-step approach to analyze price action:
1. **Market Structure Identification**: The script identifies significant highs and lows within your selected time range to determine the overall market structure direction (up or down).
2. **IDM Pattern Detection**: It then analyzes internal market structure patterns within this range, focusing on significant price movements that create trading opportunities.
3. **POI Calculation**: Using adaptive ATR measurements across multiple timeframes, the indicator calculates precise POI zones where price is likely to react. These zones are calibrated based on the volatility profile of each identified structure.
4. **Timeframe Correlation**: The script automatically determines which timeframe best matches each structure's size, providing valuable context for your trading decisions.
5. **Technical Implementation**: The indicator uses a sophisticated algorithm to analyze price swings, identify pivot points, and calculate market structure connections. It maintains a database of significant highs/lows and uses these to determine trend direction and potential reversal zones.
## Display Modes
PoiBox offers three powerful display options:
- **Main BOS**: Shows only the most significant breakout structure with its associated POI zone
- **Leg**: Displays the largest price leg within the selected range along with percentage-based POI zones
- **All IDMs**: Reveals all detected internal market structures and their POI zones
## Advanced Features
- **QM Mode**: Visualizes important market structure relationships with dashed lines connecting significant highs and lows
- **Trick Display**: Identifies nested market structures (tricks) within larger patterns, perfect for precision entries
- **Customizable POI Labels**: Control which price labels appear to maintain chart clarity
- **Extensive Color Settings**: Fully customizable colors for all visual elements
- **Safety Functions**: Includes built-in buffer management and error prevention algorithms to ensure stable performance across all timeframes and market conditions
## Trading Examples
**Downtrend Example:**
When PoiBox identifies a downtrend structure (Higher High → High → Low → Lower Low), it creates POI zones based on the market structure. As shown in the chart, these zones provide excellent entry opportunities when price returns to test previous structure. In this example, entering at the red POI zone with a stop above the zone and target at the QM level resulted in a 3.45 risk/reward trade.
**How to Read QM Lines:**
The dashed lines connecting High → Low → Higher High → Lower Low reveal the market's true structure. These connections help you anticipate where price might head next. When price breaks below a significant Low and creates a Lower Low, it confirms the downtrend continuation and provides a trading opportunity when price retests the broken structure.
**POI Zone Interpretation:**
- Red zones indicate bearish POI areas (ideal for short entries)
- Green zones indicate bullish POI areas (ideal for long entries)
- Yellow zones highlight the identified market structure
## Practical Application Example
In the GBP/USD example shown in the chart:
1. PoiBox identified a downtrend structure with Higher High → High → Low → Lower Low
2. The yellow box shows the main market structure area
3. The red POI zone appeared when price returned to test previous structure
4. Entry was taken at the POI zone with stop loss above structure
5. Target was placed at the QM level, resulting in a 3.45 risk/reward ratio trade
6. The dashed QM lines showed the overall market flow and direction
This demonstrates how PoiBox automatically identifies optimal entry and exit points based on market structure, without requiring manual analysis of each price swing.
## Mathematical Approach
PoiBox uses several mathematical concepts to determine market structure and calculate POI zones:
1. **Adaptive ATR Integration**: The script analyzes ATR (Average True Range) across multiple timeframes (M1, M5, M15, H1, H4, D1, W1, MN1) to determine the appropriate volatility context for each structure.
2. **Height-to-ATR Ratio**: The indicator calculates the ratio between structure height and the closest matching ATR value to determine the structure's timeframe context.
3. **Dynamic POI Calculation**: POI values are calculated using the formula:
`POI = factor * (atr_trigger + atr_double_trigger)`
where `factor` is derived from the structure's height-to-ATR ratio.
4. **Self-Adjusting Limits**: If the calculated POI value exceeds certain thresholds relative to structure height, the script automatically applies proportional adjustments to maintain optimal zone sizing.
## What Makes PoiBox Unique
While many indicators use common concepts like support/resistance or trend analysis, PoiBox stands apart through its:
1. **Adaptive POI Calculation**: Unlike static indicators, PoiBox automatically calibrates POI zones based on each market structure's volatility profile by analyzing ATR across multiple timeframes.
2. **Smart Timeframe Detection**: The indicator automatically determines the most relevant timeframe for each structure, eliminating guesswork and helping you align your trading with the appropriate market cycles.
3. **QM Visualization System**: Our proprietary QM visualization method reveals hidden market structure relationships that standard indicators cannot detect, giving you an edge in anticipating price movements.
4. **Nested Pattern Recognition**: The "Trick" detection feature identifies high-probability setups where smaller patterns form within larger ones, creating precise entry opportunities missed by conventional tools.
5. **Self-Adjusting Analysis**: PoiBox dynamically adapts to changing market conditions without requiring manual parameter adjustments, saving you time and increasing accuracy.
These innovations combine to create a truly original trading system that transforms complex market structure concepts into clear, actionable signals.
## How To Use
1. Define your analysis area using the time range selectors (X1 and X2)
2. Choose your preferred display mode based on your trading style
3. Enable QM Mode for additional market structure context if needed
4. Use the POI zones as potential entry and exit areas for your trades
5. Reference the automatically detected timeframe indicators to align your trading with the appropriate timeframe
### Settings Explanation
**Display Settings:**
- Display Mode: Choose between Main BOS, Leg, or All IDMs visualization
- QM Mode: Enable to see market structure connections with dashed lines
**Trick Settings:**
- Trick Display: Show the main trick or all nested patterns
- Trick POI: Control which POI zones appear for trick patterns
**Label Settings:**
- Leg POI %: Customize percentage-based POI zones in Leg mode
- POI Labels: Control which price labels appear on your chart
**Time Range:**
- X1 and X2: Define the analysis area for market structure detection
**Colors:**
- TF Color: Color for timeframe labels
- H/L Color: Color for high/low labels
- QM Lines: Color for market structure connection lines
- Trick Color: Color for nested pattern visualization
This indicator is designed for traders who understand market structure concepts and want a powerful tool that automatically identifies high-probability trading zones based on structural price patterns and volatility-adjusted measurements.

COT3 - Flip Strength Index - Invincible3This indicator uses the TradingView COT library to visualize institutional positioning and potential sentiment or trend shifts. It compares the long% vs short% of commercial and non-commercial traders for both Pair A and Pair B, helping traders identify trend strength, market overextension, and early reversal signals.
🔷 COT RSI
The COT RSI normalizes the net positioning difference between non-commercial and commercial traders over (N=13, 26, and 52)-week periods. It ranges from 0 to 100, highlighting when sentiment is at bullish or bearish extremes.
COT RSI (N)= ((NC - C)−min)/(max-min) x100
🟡 COT Index
The COT Index tracks where the current non-commercial net position lies within its 1-year and 3-year historical range. It reflects institutional accumulation or distribution phases.
Strength represents the magnitude of that positioning bias, visualized through normalized RSI-style metrics.
COT Index (N)= (NC net)/(max-min) x100
🔁 Flip Detection
Flip refers to the crossovers between long% and short%, indicating a change in directional bias among trader groups. When long positions exceed shorts (or vice versa), it signals a possible market flip in sentiment or trend.
For example, Pair B commercial flip is calculated as:
Long% = (Long/Open Interest)×100
Short% = (Short/Open Interest)×100
Flip = Long%−Short%
A bullish flip occurs when long% overtakes short%, and vice versa for a bearish flip. These flips often precede price trend changes or confirm sentiment breakouts.
Flip captures how far current positioning deviates from historical norms — highlighting periods of institutional overconfidence or exhaustion, often leading to significant market turns.
This combination offers a multi-layered edge for identifying when smart money is flipping direction, and whether that flip has strong conviction or is likely to fade.
..........................................................................................................................................................
