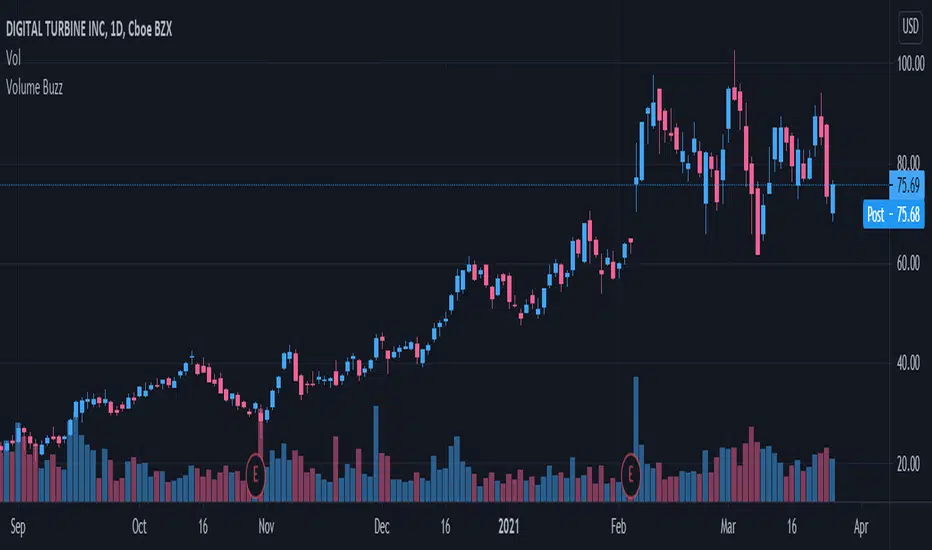
Volume Buzz 2.0Volume Buzz/Volume Run Rate as seen on TC2000 and MarketSmith respectively.
Basically, the volume buzz tells you what percentage over average(100 time period moving average) the volume traded was. You can use this indicator to more readily identify above-average trading volume and accumulation days on charts. The percentage will show up in the top left corner, make sure to click the settings button and uncheck the second box(left of plot) in order to get rid of the chart line.
Pictured above, a chart with the volume on the bottom along with the 50-day moving average applied to volume. As you can see in the top left it will tell you the "volume buzz" of that day, telling you what days were on above-average volume and how above-average those days were.
Cerca negli script per "volume"
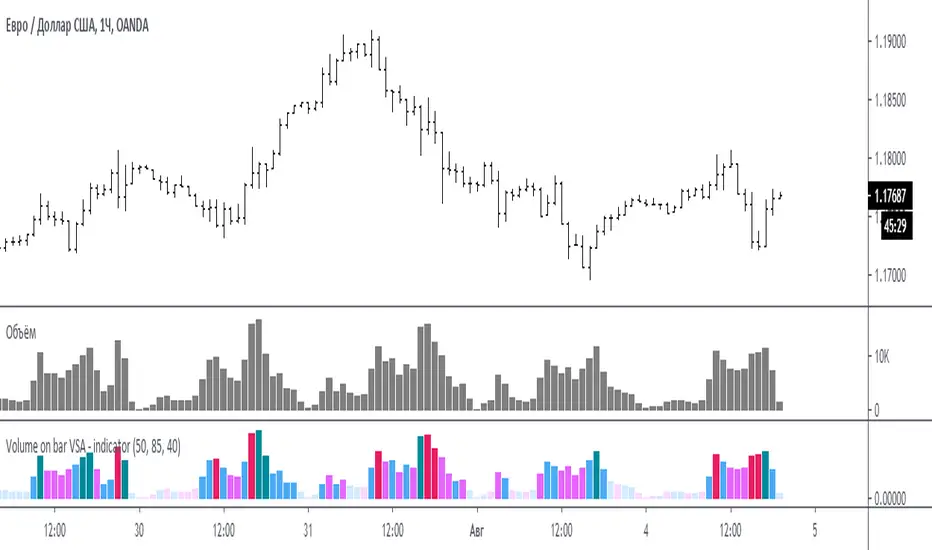
Volume on bar VSA - indicator V2Google translate.
This indicator compares the volume with its average value and tints it depending on whether the tail on the bar is bullish or bearish.
In the settings you can set (sensitivity) for tinting volumes of high and medium
Этот индикатор сравнивает объем со средним его значением и подкрашивает его в зависимости от того какой хвост на баре, бычий или медвежий.
В настройках можно задать (чувствительность) для подкрашивания объемов повышенных и средних
Volume Divergence by MMIt's a simply volume indicator. You should watch for breaks on both volume uptrend and volume downtrend. It uses fibonacci numbers to build smoothed moving average of volume.
Also you can check divergences for trend reversal and momentum loss.

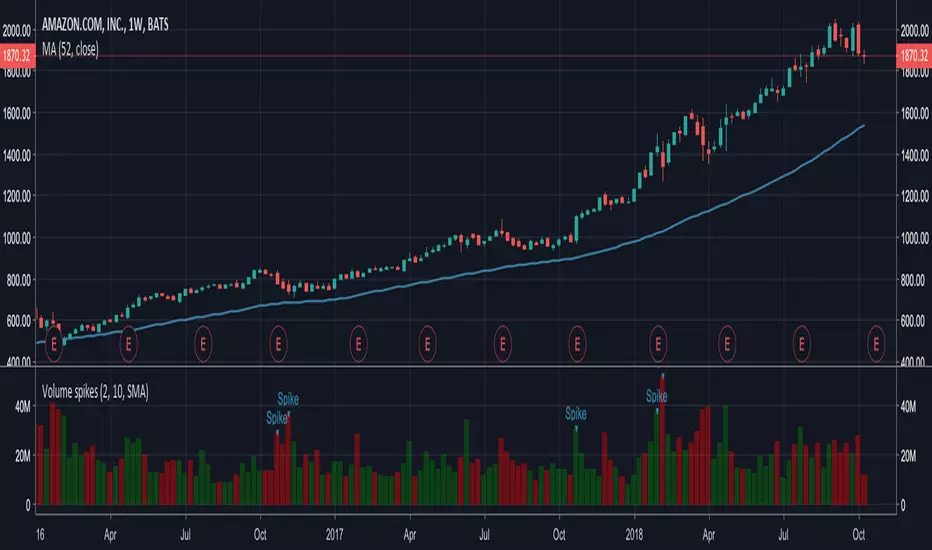
Volume spikesSimple indicator which shows volume spikes.
By default spike is defined as such when volume is 2 times higher than average volume for last 10 volume bars (this can be changed in settings)
Also instead of using average volume (SMA is used in this case) you can use WMA or EMA by changing settings
Volume Price Spread Analysis 2With the same idea of the VPSA i make the VPSA2 to make Heiken Ashi style synthetic graph of the price and the volume effect, its easy to see the volume trends. Each instrument have a more clear time frame to see the volume patterns.
I see very useful like a secondary analysis layer. in the graph show the same RSI with price and VPSA2 like source.
Can use others indicators over the VPSA, only write in CAPITAL letters open, high, low, close or hl2 at inputs section.
Ideas, corrections & comments.
They are always welcome.

Volume Price Spread AnalysisWith the same idea of the VSA i make the VPSA to make synthetic graph of the price and the volume effect, its easy to see the volume trends. Each instrument have a more clear time frame to see the volume patterns.
Can use others indicators over the VPSA, only write in CAPITAL letters open, high, low, close or hl2 at inputs section.

Volume vs Body Alert.Vsa
"This VSA-based indicator identifies potential anomalies in price action by detecting candles that show a larger body size than the previous candle while simultaneously having lower volume. This 'more result with less effort' pattern can signal weakness, manipulation, or potential trend exhaustion. Visual signals and customizable alerts notify traders when these conditions occur."

Volume VA with POC Based Percent DeviationsThis is a slightly different take on my previous version that plotted fibonacci retracement levels based on the POC to value area high/low.
This indicator is also based on the volume value area that plots developing POC, VAH, and VAL as well as historical levels. However, instead of plotting fib levels, this script automatically projects percentage deviation levels from the current POC. This can help identify potential overextensions, target areas, or mean-reversion setups.
Knowing where price is and the change in price relative to areas of interest can help identify true value and market imbalances. Hence the name VALUE AREA :)
The percent deviation levels are dynamically plotted in relation to the developing POC. As POC shifts so do the % levels.
Gradient Value Area Fill: Instead of a static color, the Value Area is filled with a dynamic gradient. The adjustable color and transparency shift is based on the current price's distance from the POC, giving you an intuitive feel for where price is relative to the POC.
Enjoy!
"May the fourth leaf bring you extra luck!" 🍀

Volume PercentileThis Pine Script indicator highlights bars where the current volume exceeds a configurable percentile threshold (e.g., 80th percentile) based on a rolling window of historical volume data.
🔍 Key Features:
Calculates a user-defined volume percentile (e.g., 75th, 80th, 90th) over a rolling window.
Marks candles where current volume is higher than the selected percentile.
Helps detect volume spikes, breakouts, or unusual activity.
Works directly on the main chart window for easier analysis.
🛠️ Inputs:
Window Length: Number of bars used to calculate the percentile (default = 20).
Percentile: The percentile threshold to trigger a high-volume signal (default = 80).
🖥️ Visualization:
Displays a red triangle marker below bars with volume above the selected percentile.

Volume MA * Fibo levelsIn the scrypt above, the SMA of Volume is taken as a basis and the Fibonacci levels are calculated.
This can be useful for analyzing the trend in accordance with changes in volume.
Any feedback is appreciated!
Good luck with your trading!

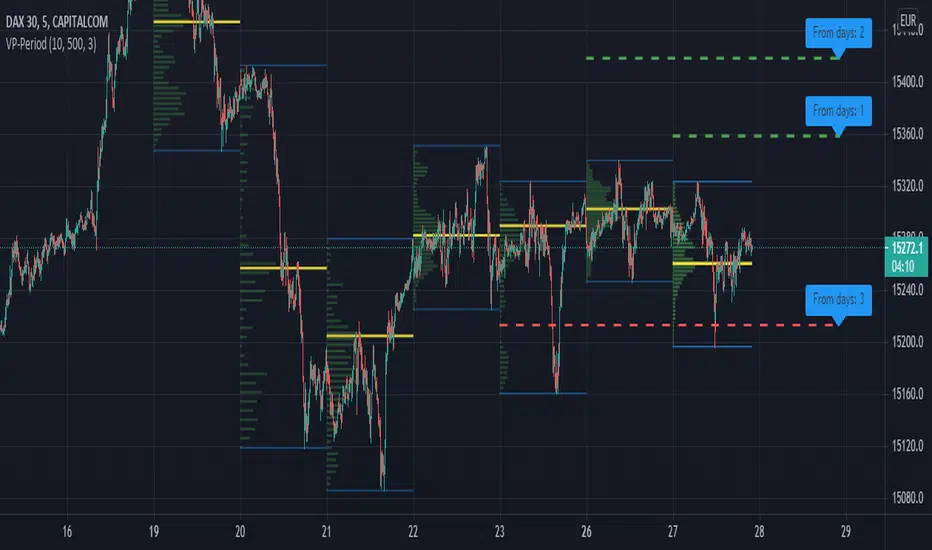
Volume Profile per day with support/resistance linesThis indicator shows the volume profile by daily blocks and draws on the chart the support or resistance lines produced by the previous volume profile block. A support line will be created if in the previous block, the VPOC line was closer to the lowest price line of that block. This support line will be placed below the VPOC line, at a distance equal to the difference between the highest price of that block and the VPOC price. For the case of the resistance line, the logic applied is analogous.
These support and resistance lines are introduced because, according to the Gaussian bell, the VPOC is likely to be located in the middle, and these deviations can be used to trace support and resistance.
In addition, the indicator includes the following features:
- Change the colors of all plotted lines.
- Define the number of daily blocks to be displayed.
- Define the resolution when calculating the volume of each candle.
- Define the number of support/resistance lines to be displayed.
- Highest and lowest price lines, as well as vpoc line, volume histogram and support and resistance lines.
- Display or not, the vpoc line and the volume histogram.
The calculations performed by the script improve if the candles used are of a lower timeframe. This indicator has been tested in several markets, including cryptos, CFDs, Forex and Indices.
VolumeS as stochv1just to show a concept . I use volume S to make it as stoch and add to it MTF function
B=buy
S=sell
D=down
if you do not like the MTF fuction just remove it from code or put the time frame of graph to be exact as MTF one
I did not add alert as it just a concept idea , to make it more complex it easy if you add more indicators to it and then compare the signals
have fun

Volume DMAO [DCAUT]█ Volume DMAO Indicator
📊 OVERVIEW
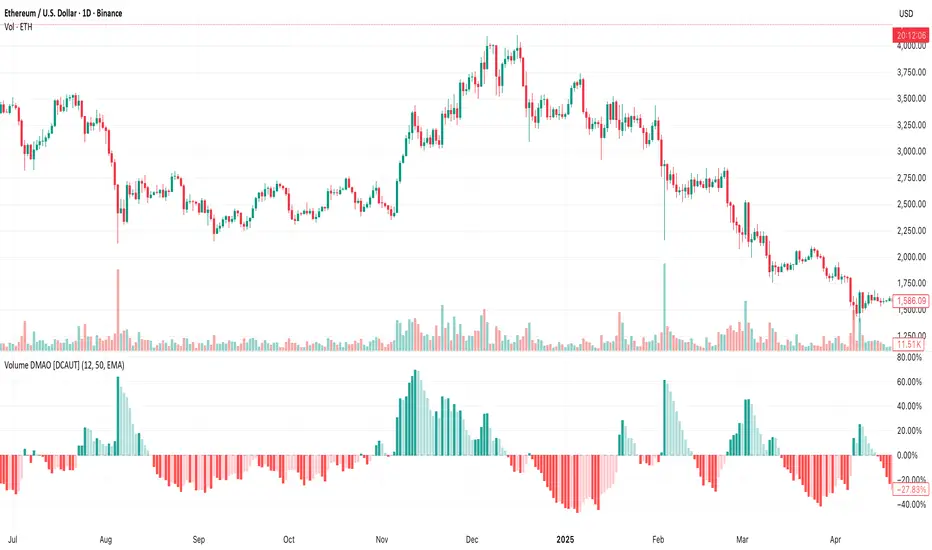
The Volume DMAO (Dual Moving Average Oscillator) applies PPO-style calculation to volume data rather than price. It measures the percentage difference between fast and slow moving averages of volume, providing insights into volume momentum and market participation trends.
🎯 CONCEPTS
Signal Interpretation
Positive Values : Current volume above historical average (expansion phase)
Negative Values : Current volume below historical average (contraction phase)
Rising Trend : Volume momentum accelerating (increasing participation)
Falling Trend : Volume momentum decelerating (decreasing participation)
Primary Applications
Volume Confirmation : Validate price movements with volume momentum analysis
Divergence Detection : Spot potential reversals when volume diverges from price
Trend Strength : Assess volume participation in price trends
Entry/Exit Signals : Time trades based on volume momentum shifts
📋 PARAMETER SETUP
Input Parameters
Fast Length : Period for fast moving average (default: 12)
Slow Length : Period for slow moving average (default: 50)
MA Type : Moving average algorithm (default: EMA)
📊 COLOR CODING
Histogram Colors
Dark Green : Positive and rising (strong volume expansion)
Light Green : Positive and falling (weakening volume expansion)
Light Red : Negative and rising (recovering from volume contraction)
Dark Red : Negative and falling (strong volume contraction)
💡 CORE VALUE
Unlike traditional volume indicators, Volume DMAO provides normalized percentage readings that:
- Enable comparison across different timeframes and instruments
- Reveal volume momentum changes before price movements
- Identify market phases through volume participation analysis
VIM (Volume in Money)Volume in Money + MA (Short Numbers & Coloring)
This indicator visualizes the monetary volume traded in each candle, calculated as:
Money Volume
=
Volume
×
Close Price
Money Volume=Volume×Close Price
🔹 Features:
Plots bars representing the money volume (total traded value).
Coloring options:
• Prev Close → Green if the current close is higher than the previous close, Red if lower.
• Candle Direction → Green if the candle is bullish (close > open), Red if bearish (close < open).
Moving Average (default length: 14) applied on the money volume for trend analysis.
Axis values and labels displayed in a shortened format (K, M, B, T) for readability.
📊 This helps traders quickly identify whether large amounts of money flowed into or out of the asset, making it easier to detect unusual activity compared to regular volume indicators.

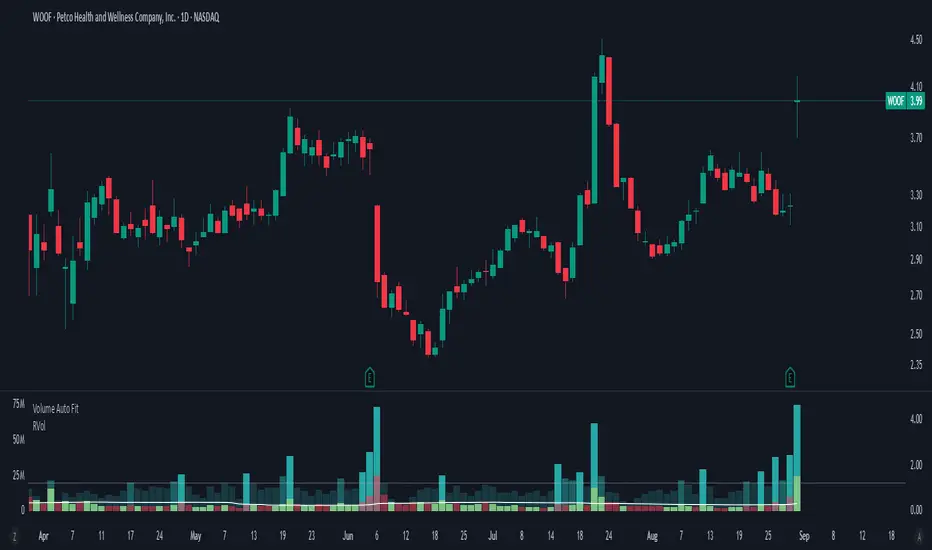
Volume Auto FitThis does nothing more than decreasing the size of (absolute) volume candles a bit, in order to allow showing candles with "Absolute" volume and Relative volume inside of the same panel - to save space.
I want to see both because:
Relative volume indicates higher activity than usual
Absolute volume helps with "Volume Price Analysis"
On the 5m you don't need "Volume Auto fit", but can just use usual "Volume" and it will look fine.
For the 1D I've created this one though, since RVol can be gigantic there sometimes.
Volume-Confirmed Price Momentum# **Volume-Confirmed Price Momentum (VCPM) Indicator**
## **🔍 Overview**
Introducing the **Volume-Confirmed Price Momentum (VCPM)**, a sophisticated dual-metric indicator designed to identify high-probability momentum moves by analyzing the relationship between price action and volume dynamics. This indicator combines correlation analysis with volume strength validation to filter out weak signals and highlight institutional-backed movements.
---
## **⚙️ Core Mechanics**
**Price-Volume Correlation Engine:**
- Calculates real-time correlation between price movements and volume
- Configurable lookback period (default: 8 bars)
- Option to use price changes or absolute values
- Correlation range: -1.0 (perfect negative) to +1.0 (perfect positive)
**Volume Strength Analyzer:**
- Compares current volume against its moving average (default: 128 periods)
- Normalizes volume ratio to 0-1 scale for consistent interpretation
- Identifies when volume significantly exceeds historical norms
---
## **📊 Signal Generation**
### **🟢 Bullish Confirmation Signal**
**Trigger:** Positive correlation > 0.6 + Volume ratio > 0.5
- Price and volume moving in harmony upward
- Above-average volume confirms the move
- Indicates strong institutional buying interest
### **🔴 Bearish Confirmation Signal**
**Trigger:** Negative correlation < -0.6 + Volume ratio > 0.5
- Price declining with increasing volume
- Suggests distribution or institutional selling
- High-confidence bearish momentum
---
## **🎯 Trading Applications**
**Breakout Validation:**
Filter false breakouts by requiring volume confirmation before entering positions.
**Trend Continuation:**
Identify when existing trends have strong volume backing for continuation plays.
**Distribution Detection:**
Spot potential tops when price struggles despite high volume (negative correlation).
**Entry Timing:**
Built-in alert system notifies when both conditions align for optimal entry points.
---
## **🔧 Customization Features**
- **Correlation Period:** Adjust sensitivity (2-500 bars)
- **Volume Averaging:** Modify volume comparison timeframe
- **Alert Thresholds:** Fine-tune correlation and volume ratio triggers
- **Visual Options:** Toggle volume histogram display
- **Price Source:** Choose from OHLC or custom sources
---
## **💡 Why VCPM Works**
Traditional momentum indicators often generate false signals during low-volume periods. VCPM solves this by requiring **dual confirmation**: price momentum must be supported by corresponding volume activity. This approach:
- Reduces whipsaws and false breakouts
- Identifies institutional participation
- Provides higher conviction trade setups
- Works across all timeframes and markets
---
## **📈 Best Use Cases**
✅ **Crypto markets** (high volatility, volume-driven)
✅ **Stock breakouts** (earnings, news events)
✅ **Forex majors** (during high-impact news)
✅ **Futures trading** (momentum confirmation)
---
## **⚠️ Important Notes**
- Works best in liquid markets with consistent volume data
- Combine with support/resistance levels for enhanced accuracy
- Consider market context (trending vs. ranging conditions)
- Not recommended for extremely low-volume periods
---
## **🚀 Getting Started**
1. Add VCPM to your chart as a sub-panel indicator
2. Configure correlation threshold (start with 0.6)
3. Set volume ratio threshold (start with 0.5)
4. Enable alerts for automated signal detection
5. Backtest on your preferred timeframe and instrument
---
**Ready to enhance your momentum trading with volume confirmation? Try VCPM and experience the difference institutional-backed signals can make in your trading results.**
*Available in Pine Script v6 - Compatible with all TradingView accounts*

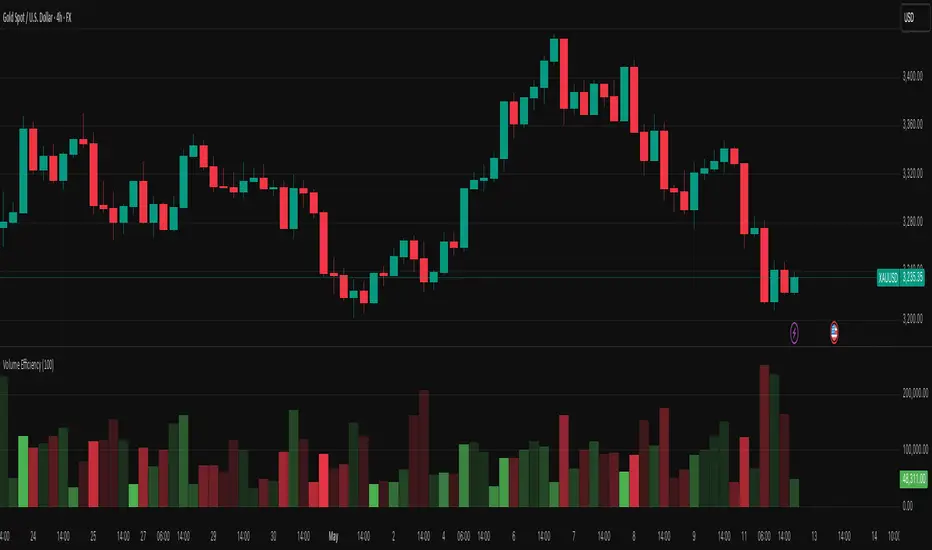
Volume EfficiencyThis indicator displays each candle's volume in an enhanced visual form, combining the amount of volume with the efficiency of the price movement.
Each volume bar changes its color intensity based on:
Higher efficiency (large price movement with low volume) → stronger color.
Lower efficiency (high volume with little price movement) → weaker color.
Additionally:
Green: Bullish candles (close > open).
Red: Bearish candles (close < open).
The color reflects not only the volume but also how "easily" the price moved.
The efficiency calculation is based on the actual body movement of the candle (abs(close - open)) divided by the total volume, dynamically adjusted to the maximum efficiency over the last N candles (configurable).
Interpretation:
Intensely green or red volume bars: clean and efficient movements (low resistance).
Pale bars: market absorption or indecision (high volume but little price movement).
Configurable parameter:
Efficiency period: number of candles used to normalise the maximum efficiency.
Volume Intelligence Suite (VIS) v2📊 Volume Intelligence Suite – Smart Volume, Smart Trading
The Volume Intelligence Suite is a powerful, all-in-one TradingView indicator designed to give traders deeper insight into market activity by visualizing volume behavior with price action context. Whether you're a scalper, day trader, or swing trader, this tool helps uncover hidden momentum, institutional activity, and potential reversals with precision.
🔍 Key Features:
Dynamic Volume Zones – Highlights high and low volume areas to spot accumulation/distribution ranges.
Volume Spikes Detector – Automatically marks abnormal volume bars signaling potential breakout or trap setups.
Smart Delta Highlighting – Compares bullish vs bearish volume in real time to reveal buyer/seller strength shifts.
Session-Based Volume Profiling – Breaks volume into key trading sessions (e.g., London, New York) for clearer context.
Volume Heatmap Overlay – Optional heatmap to show intensity and velocity of volume flow per candle.
Custom Alerts – Built-in alerts for volume surges, divergences, and exhaustion signals.
Optimized for Kill Zone Analysis – Pairs perfectly with ICT-style session strategies and Waqar Asim’s trading methods.
🧠 Why Use Volume Intelligence?
Most traders overlook the story behind each candle. Volume Intelligence Suite helps you "see the why behind the move" — exposing key areas of interest where smart money may be active. Instead of reacting late, this tool puts you in position to anticipate.
Use it to:
Validate breakouts
Detect fakeouts and liquidity grabs
Confirm bias during kill zones
Analyze volume divergence with price swings
⚙️ Fully Customizable:
From volume thresholds to visual styles and session timings, everything is user-adjustable to fit your market, timeframe, and strategy.
✅ Best For:
ICT/Smart Money Concepts (SMC) traders
Breakout & reversal traders
Kill zone session scalpers
Institutional footprint followers

Volume-Price Momentum IndicatorVolume-Price Momentum Indicator (VPMI)
Overview
The Volume-Price Momentum Indicator (VPMI), developed by Kevin Svenson , is a powerful technical analysis tool designed to identify strong bullish and bearish momentum in price movements, driven by volume dynamics. By analyzing price changes and volume surges over a user-defined lookback period, VPMI highlights potential trend shifts and continuation patterns through a smoothed histogram, optional labels, and background highlights. Ideal for traders seeking to capture momentum-driven opportunities, VPMI is suitable for various markets, including stocks, forex, and cryptocurrencies.
How It Works
VPMI calculates the difference between volume-weighted buying and selling pressure based on price changes over a specified lookback period. It amplifies signals during high-volume periods, applies smoothing to reduce noise, and uses momentum checks to detect sustained trends.
Indicator display:
A histogram that oscillates above (bullish) or below (bearish) a zero line, with brighter colors indicating stronger momentum and faded colors for weaker signals.
Optional labels ("Bullish" or "Bearish") to mark significant momentum shifts.
Optional background highlights to visually emphasize strong trend conditions.
Alerts to notify users when strong bullish or bearish momentum is detected.
Key Features
Customizable Settings:
Adjust the lookback period, volume threshold, momentum length, and smoothing to suit your trading style.
Volume Sensitivity:
Emphasizes price movements during high-volume surges, enhancing signal reliability.
Momentum Detection: Uses linear regression and momentum change to confirm sustained trends, reducing false signals.
Visual Clarity:
Offers a clear histogram with color-coded signals, plus optional labels and backgrounds for enhanced chart readability.
Alerts:
Configurable alerts for strong momentum signals, enabling timely trade decisions.
Inputs and Customization
Lookback Period (Default: 9):
Sets the number of bars to analyze price changes. Higher values smooth signals but may lag.
Volume Threshold (Default: 1.4):
Defines the volume level (relative to a 20-period SMA) that qualifies as a surge, amplifying signals.
High Volume Multiplier (Default: 1.5):
Boosts histogram values during high-volume periods for stronger signals.
Histogram Smoothing Length (Default: 4):
Controls the EMA smoothing applied to the histogram, reducing noise.
Momentum Check Length (Default: 4):
Sets the period for momentum trend analysis (recommended to be less than Lookback Period).
Momentum Threshold (Default: 6):
Defines the minimum momentum change required for strong signals.
Show Labels (Default: Off):
Toggle to display "Bullish" or "Bearish" labels on significant momentum shifts.
Show Backgrounds (Default: Off):
Toggle to highlight chart backgrounds during strong momentum periods.
Bullish/Bearish Colors:
Customize colors for bullish (default: green) and bearish (default: red) signals.
Faded Transparency (Default: 40):
Adjusts the transparency of weaker signals for visual distinction.
How to Use
Interpret Signals:
Above Zero (Green):
Indicates bullish momentum. Bright green suggests strong, sustained buying pressure.
Below Zero (Red):
Indicates bearish momentum. Bright red suggests strong, sustained selling pressure.
Faded Colors:
Weaker momentum, potentially signaling consolidation or trend exhaustion.
Enable Visuals:
Turn on "Show Labels" and "Show Backgrounds" in the settings for additional context on strong momentum signals.
Set Alerts:
Use the built-in alert conditions ("Strong Bullish Momentum" or "Strong Bearish Momentum") to receive notifications when significant trends emerge.
Combine with Other Tools:
Pair VPMI with support/resistance levels, trendlines, or other indicators (e.g., RSI, MACD) for confirmation.
Best Practices
Timeframe:
VPMI works on all timeframes, but shorter timeframes (e.g., 5m, 15m) may produce more signals, while longer timeframes (e.g., 1h, 4h, 1D) offer higher reliability.
Market Conditions:
Most effective in trending markets. In choppy or sideways markets, consider increasing the smoothing length or momentum threshold to filter noise.
Risk Management:
Always use VPMI signals in conjunction with a robust trading plan, including stop-losses and position sizing.
Limitations
Lagging Nature:
As a momentum indicator, VPMI may lag in fast-moving markets due to smoothing and lookback calculations.
False Signals:
In low-volume or ranging markets, signals may be less reliable. Adjust the volume threshold or momentum settings to improve accuracy.
Customization Required:
Optimal settings vary by asset and timeframe. Experiment with inputs to align with your trading strategy.
Why Use VPMI?
VPMI offers a unique blend of volume and price momentum analysis, making it a versatile tool for traders seeking to identify high-probability trend opportunities. Its customizable inputs, clear visuals, and alert capabilities empower users to tailor the indicator to their needs, whether for day trading, swing trading, or long-term analysis.
Get Started
Apply VPMI to your chart, tweak the settings to match your trading style, and start exploring momentum-driven opportunities. For questions or feedback, consult TradingView’s community forums or documentation. Happy trading!

Volume and Volatility Ratio Indicator-WODI该指标名为“交易量与波动率比例指标-WODI”,主要基于交易量和价格波动率构造一个复合指数,帮助识别市场内可能存在的异常或转折信号。具体实现如下:
用户自定义参数
用户可以设置交易量均线长度(vol_length)、指数的短期与长期均线长度(index_short_length、index_long_length)、均线敏感度(index_magnification)、阈值放大因子(index_threshold_magnification)以及检测K线形态的区间(lookback_bars)。这些参数为后续计算提供了灵活性,允许用户根据不同市场环境自定义指标的敏感度和响应速度。
交易量均线与百分比计算
首先通过 ta.sma 计算指定长度的交易量简单均线(vol_ma)。
接下来,将当前交易量与均线进行比较,计算出当前交易量占均线的百分比(vol_percent),这反映了短期内交易量的相对活跃程度。
波动率的衡量
使用当前K线的最高价和最低价计算振幅,再除以收盘价乘以100得到波动率(volatility),从而反映市场价格波动的幅度。
构建交易量/波动率指数
将交易量百分比与波动率相乘,形成了“交易量/波动率指数”(volatility_index)。该指数能够同时反映市场的交易活跃度和价格波动性,两者的联合作用帮助捕捉市场的“热度”。
计算指标均线与阈值
对交易量/波动率指数分别计算短期均线(index_short_ma)和长期均线(index_long_ma),并通过乘以一个敏感度参数(index_magnification)进行调整。
同时,依据长期均线计算一个阈值(index_threshold),起到过滤噪音的作用。当指数突破该阈值时,可能预示着市场的重要变化。
K线形态与反转模式检测
通过遍历最近几根K线(由lookback_bars控制),指标会检测是否符合一系列预定条件(涉及交易量、价格振幅、K线形态等),以判断是否存在反转模式。若符合条件,则标记为反转模式,从而为潜在的转折点提供提示。
图表展示
最终在独立窗口中绘制多个元素:
指数短均线与长均线:经过敏感度调整后显示,用于分析指数趋势。
交易量/波动率指数:采用阶梯线风格绘制,直观展示指数变化。
阈值线:作为参考水平,便于判断指数是否突破常规范围。
交易量柱状图:当当前交易量高于均线时,通过不同颜色显示;当检测到反转模式时,颜色会进一步强化,帮助用户迅速识别潜在信号。
English Description
This indicator, titled “Volume and Volatility Ratio Indicator - WODI”, is designed to construct a composite index based on trading volume and price volatility, aiding in the identification of abnormal market conditions or potential reversal signals. Its functionality is broken down as follows:
User-Defined Parameters
The indicator allows users to set parameters such as the moving average length for volume (vol_length), the short and long moving average lengths for the index (index_short_length and index_long_length), a sensitivity multiplier (index_magnification), a threshold magnification factor (index_threshold_magnification), and the number of bars for pattern detection (lookback_bars). These parameters provide flexibility to adjust the sensitivity and responsiveness of the indicator based on different market conditions.
Volume Moving Average and Percentage Calculation
A simple moving average (SMA) of volume is computed over the specified length (vol_ma) using the ta.sma function.
The current volume is then compared to its moving average to calculate the volume percentage (vol_percent), reflecting the relative trading intensity in the short term.
Measuring Volatility
Volatility is calculated based on the current bar’s high and low prices, normalized by the closing price and multiplied by 100, which provides a measure of the market’s price fluctuation magnitude.
Constructing the Volume/Volatility Index
The index (volatility_index) is derived by multiplying the volume percentage by the calculated volatility. This composite metric reflects both market activity and price movement, effectively capturing the overall “heat” of the market.
Calculating the Index Moving Averages and Threshold
Two moving averages for the volatility_index are computed: one short-term (index_short_ma) and one long-term (index_long_ma). These are then adjusted by the sensitivity multiplier (index_magnification).
A threshold level (index_threshold) is calculated based on the long-term moving average multiplied by the threshold magnification factor, serving to filter out market noise. When the index exceeds this threshold, it may signal significant market shifts.
Detection of Reversal Patterns
The indicator iterates through the recent bars (as determined by lookback_bars) to check whether a set of predetermined conditions (involving trends in the volatility_index, volume comparisons, price closes, and K-line patterns) are met. If these conditions are satisfied, it flags a reversal pattern, which may serve as a warning for a potential market turnaround.
Visualization on the Chart
The final display includes several elements plotted in a separate indicator window:
The short-term and long-term moving averages of the index (after sensitivity adjustment) which help visualize the trend of the composite index.
The volatility index itself is drawn using a step-line style for clarity.
A threshold line is plotted to provide a reference level against which index movements can be compared.
A volume histogram is also displayed, where bars are colored differently when the current volume exceeds the moving average; the color is further enhanced if a reversal pattern is detected, making it easy for users to quickly spot potential signals.
Volume Aggregated Spot & FuturesAggregated volume for cryptos using spot and perpetual contracts but only those that are based on normal volume and not on tick volume.
Provides more reliable volume than volume from one provider.
Thanks to HALDRO because it's his code and I simplified it to create this version.
Volume Profile With HVN & LVN detectorVolume Profile Indicator
Based on the works of tradeforopp
Overview
The Volume Profile Indicator is a powerful technical analysis tool that visually represents the distribution of trading volume over price levels within a specified timeframe. It helps traders identify key support and resistance zones, high-volume trading areas, and low-volume rejection zones. The indicator includes customizable settings for Volume Point of Control (VPOC), High Volume Nodes (HVNs), and Low Volume Nodes (LVNs), making it a versatile tool for price action analysis and volume-based decision-making.
Key Features
🔹 Customizable Volume Profile
Adjustable number of rows to define the resolution of the volume profile.
Configurable timeframe aggregation for profile calculation (e.g., Daily, Weekly).
Selectable price resolution timeframe for precise profile construction.
Extendable volume profile for future sessions.
Fully customizable profile color and transparency settings.
🔹 Volume Point of Control (VPOC)
Displays the most traded price level within the selected timeframe.
Option to extend multiple VPOCs across the chart.
Adjustable VPOC line width and color customization.
Option to display VPOC labels when working with higher timeframe profiles.
🔹 High Volume Nodes (HVNs)
Identifies high-volume price levels where significant trading activity has occurred.
Configurable HVN strength to adjust detection sensitivity.
Two display modes:
Lines: Plots HVN levels as horizontal lines.
Areas: Highlights HVN regions with colored boxes.
Separate bullish and bearish HVN color settings.
🔹 Low Volume Nodes (LVNs)
Identifies low-volume price levels, which often act as rejection zones.
Configurable LVN strength to fine-tune detection.
Two display modes:
Lines: Marks LVN levels as horizontal lines.
Areas: Highlights LVN regions with shaded boxes.
Separate bullish and bearish LVN color settings.
🔹 Optimized for Performance
Efficient use of arrays for data storage and retrieval.
Global functions for HVN and LVN detection.
Uses security calls to access lower timeframe price and volume data.
Use Cases
✅ Identify Support & Resistance Levels
The indicator highlights key price levels where significant buying or selling interest exists.
✅ Detect Breakout & Reversal Zones
Low-volume areas (LVNs) often indicate price rejection zones, while high-volume areas (HVNs) suggest strong price acceptance zones.
✅ Improve Trade Entries & Exits
Traders can use the Volume Point of Control (VPOC) and volume clusters to refine entry and exit points.
✅ Enhance Price Action Strategies
By incorporating volume-based analysis, this indicator provides deeper market insights beyond traditional support/resistance and trendlines.
Customization & Settings
📌 Volume Profile Settings:
Rows: Defines the granularity of the volume profile.
Profile Timeframe: Specifies the aggregation period (e.g., Daily, Weekly).
Resolution Timeframe: Determines the price resolution for volume analysis.
Profile Extend %: Controls how much the profile extends into the next session.
📌 Volume Point of Control (VPOC):
Enable/Disable VPOC visualization.
Extend past VPOC levels to the right.
Display VPOC labels for higher timeframe profiles.
Adjustable VPOC line width and color.
📌 High Volume Nodes (HVNs):
Enable/Disable HVN detection.
Define HVN strength (volume threshold).
Choose between Line Mode or Area Mode.
Configure bullish and bearish HVN colors.
📌 Low Volume Nodes (LVNs):
Enable/Disable LVN detection.
Define LVN strength (volume threshold).
Choose between Line Mode or Area Mode.
Configure bullish and bearish LVN colors.

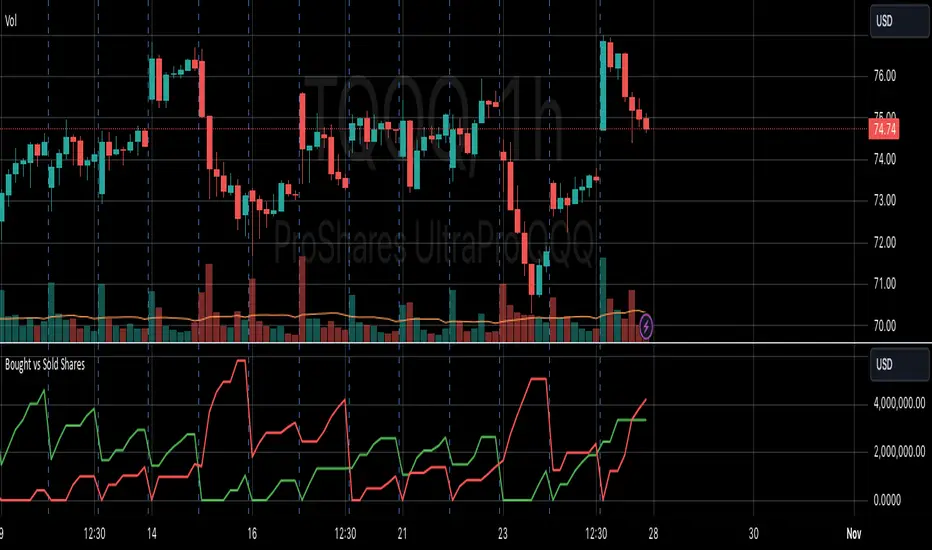
VOLUME DIRECTION INDICATORDesigned for the 1-hour chart, this indicator shows:
Green Line: Volume when price rises, suggesting buying.
Red Line: Volume when price falls, indicating selling.
How to Use:
Watch for Crossover: When the Green Line moves above the Red, it might signal a budding uptrend.
Check Retracement: If the Green Line pulls back but stays above the Red, the uptrend could be strengthening.
Price Check: Look for a small price drop but not a reversal.
Trade Entry:
Enter at the high of the retracement candle.
Or wait for the Green Line to rise again.
For Precision: Draw a line at the retracement peak and switch to a shorter timeframe to find entry patterns above this line.
Remember: Use this with other tools for better trading decisions.
The Volume Direction Indicator provides a visual representation of market activity by assuming volume can be attributed to buying or selling based on price action within each bar. When the price closes higher than it opened, the volume for that period is considered as 'Bought Shares', plotted in green. Conversely, if the price closes lower, the volume is treated as 'Sold Shares', shown in red. This indicator resets daily to give a fresh perspective on trading activity each day.
Key Features:
Buying Pressure: Green line represents the cumulative volume during periods where the price increased.
Selling Pressure: Red line indicates the cumulative volume during price decreases.
Daily Reset: Accumulated values reset at the start of each new trading day, focusing on daily market sentiment.
Note: This indicator simplifies market dynamics by linking volume directly to price changes. It does not account for complex trading scenarios like short selling or market manipulations. Use this indicator as a tool to gauge general market direction and activity, not for precise transaction data.