Volume CalendarDescription:
The indicator displays a calendar with Volume data for up to 6 last months. It is designed to work on any timeframe, but works best on Daily and below. It is also consistent in that it displays the same data even if you go to lower timeframes like 5 minutes (even though the data is used is Daily).
Features:
- displays volume data for last N months (volume, volume change, % of weekly, monthly and yearly volume)
- display total volume for each month
- display monthly sentiment
- find dates with volume spikes
Inputs:
- Number of months -> how many last months of data to display (from 1 to 6)
- Volume Type -> display only Bullish, only Bearish or all volume
- Cell color is based on -> Volume - the brighter the cell the higher volume was on that day; Volume Change - the brighter the cell the higher was the volume change that day; Volume Spike - the brighter the cell the higher was volume spike that day (volume spike is based on volume being above its average over last N candles)
- Cell color timeframe -> Weekly - the cell color is calculated comparing volume of that cell with weekly volume; Monthly - comparing volume with monthly volume
- Use volume for sentiment -> take the volume into account when calculating monthly sentiment (otherwise calculate it based on number of Bullish and Bearish days in the month)
- Spike Average Period -> period of the moving average used for spike calculation
- Spike Threshold -> current volume must be this many times greater than the average for it to be considered a spike
- Table Size -> size of the table
- Theme -> colouring of the table
Cerca negli script per "volume"

Volume Spread Analysis [Ahmed]Greetings everyone,
I'm thrilled to present a Pine Script I've crafted for Volume Spread Analysis (VSA) Indicator. This tool is aimed at empowering you to make smarter trading choices by scrutinizing the volume spread across a specified interval.
The script delivers a comparative volume analysis, permitting you to fix the type and length of the moving average. It subsequently delineates the moving average (MA), MA augmented by 1 standard deviation (SD), and MA increased by 2 SD. You can fully personalize the color coding for these echelons.
Volume Spread Analysis is an analytical technique that scrutinizes candles and the volume per candle to predict price direction. It considers the volume per candle, the spread range, and the closing price.
To effectively leverage VSA, you need to adhere to a few steps:
1. Ensure you use candlesticks for trading. Other chart types like line, bar, and renko charts may not yield optimal results.
2. Confirm that your broker provides reliable volume data.
3. Be mindful of the chart's timeframe. Volume analysis may not be effective on very short timeframes such as a minute chart. I recommend using daily, weekly, or monthly charts.
Another tip is to examine the spread between the price bars and the volume bars to discern the trend.
The script not only makes it easier to integrate these principles into your trading but also brings precision and convenience to your analysis.
Please remember to adhere to Tradinview terms of service when using the script. Happy trading!

Volume Bollinger BandsThis code draws a custom indicator named "Volume Bollinger Bands" on the price chart with the following visual elements:
1. **Basis Line (Blue)**: This line represents the moving average value (ma_value) of the volume data calculated based on the user-selected moving average type (SMA, EMA, or WMA) and length.
2. **Upper Bands (Green)**: The upper bands are calculated by adding a certain multiple of the standard deviation (dev1 to dev11) to the basis line. These bands represent a certain level of volume volatility above the moving average.
3. **Lower Bands (Red)**: The lower bands are calculated by subtracting a certain multiple of the standard deviation (dev1 to dev11) from the basis line. These bands represent a certain level of volume volatility below the moving average.
4. **Volume Line (Yellow)**: This line represents the volume data for the selected timeframe, plotted over the price chart.
The user can customize the following parameters:
- Average Length: The length of the moving average.
- Moving Average Type: The type of moving average to be used (SMA, EMA, or WMA).
- Timeframe: The timeframe used to calculate the volume data.
- Deviation 1 to Deviation 11: Multipliers for calculating the upper and lower bands.
The purpose of this indicator is to visually represent the relationship between volume volatility, moving average, and price movements. Traders can use it to analyze changes in volume trends and potential price breakouts or reversals when the volume moves beyond certain levels of standard deviations from the moving average.

Volume [theEccentricTrader]OVERVIEW
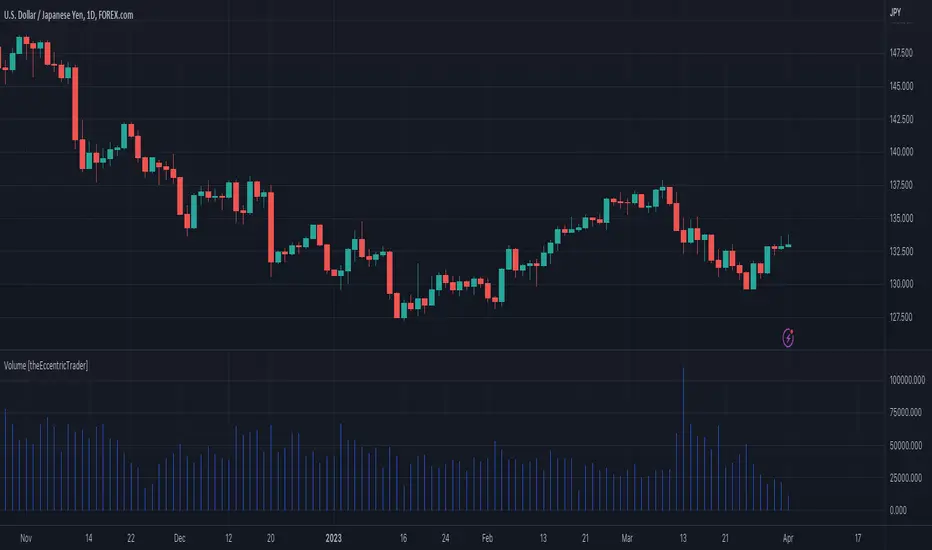
This indicator simply bridges the gap between symbols from brokers that provide volume data and symbols from brokers that do not provide volume data. Users can select any symbol that provides volume data from the settings menu and the volume data will be displayed in histogram form on their current chart. The default volume symbol is CURRENCYCOM:US500.
CONCEPTS
Volume
Volume refers to the total number of shares or contracts that are traded during a given period of time. It is a measure of the amount of activity in the market and can be used to gauge the strength or weakness of a particular trend.
Volume is typically displayed as a histogram on trading charts, with each bar representing the total volume for a particular time period. High volume bars indicate a lot of trading activity, while low volume bars indicate relatively little trading activity.
Traders use volume in a number of ways. For example, they may use it to confirm a trend. If a stock is trending up and the volume is also increasing, this can be seen as a sign that the trend is strong and likely to continue. Conversely, if a stock is trending down and the volume is also increasing, this can be seen as a sign that the trend is weak and may be coming to an end. Volume can similarly be used to identify potential reversals. If a stock is trending up but the volume starts to decrease, this could indicate that the trend is losing momentum and that a reversal may be imminent.
FEATURES
Inputs
• Volume Symbol
Style
Users can change plot color and style from the default Style menu if so required.
NOTES
For 24-hour markets and forex volume I use the broker currency.com. As can be seen in the example above, I am using CURRENCYCOM:USDJPY to pull volume to a FOREXCOM:USDJPY chart, which otherwise would not show volume data as forex.com do not provide it.
Volume/Market ProfileVolume/Market Profile is a 2 in 1 Volume Profile and Market Profile Indicator.
This indicator is my own calculations for compiling a volume profile and market profile.
The profile is progressively calculated live as the chart develops.
I have made use of both Boxes AND Lines to allow me to display a finer granularity profile by displaying up to twice the max amount of lines allowed in tradingview.
I have spent a lot of time to make sure the values are getting appended exactly as intended so that I can assure this profile is operating as precisely as possible within the limitations of the data available.
To make my calculations easier to use in other places, I have made my volume profile a function that can be extracted and used whenever you need values from a volume profile.
Feel free to read through the script if you don't understand how this profile is developed. I have made a commentary of my volume profile function to help you understand what exactly happens to compile the profiles.
As mentioned before, This indicator doubles as a market profile. To view both at the same time you will need to add the indicator on your chart twice.
I have built in comprehensive customizations to allow you to display your profiles however fits your needs.
Timeframe: The aggregation period for profiles, to see a 1 week profile, change the timeframe to 1 week.
Note: You can add custom timeframes by adding a custom timeframe in your chart timeframe dropdown menu. When you add timeframes in this area, they appear as options within indicators with the timeframe input.
Sensitivity: Allows for greater or less granularity changes. The calculation method for granularity automatically changes depending on the range of your chart.
Note: Multiply this value by 100 and that will be the max range (in ticks) of your price before the indicator automatically adjusts to make the profile less granular. (ex. If price ranges $1, and 1 tick is $0.01, granularity will be 0.01 with a sensitivity of 1+)
Value Area %: % of total volume to display as the value zone. (_% of total profile values are contained within the value zone)
Calculate as Market Profile: Uses a 1 Instead of the candle volume, to display a Market Profile. (If selected POC -> TPOC)
Display Size: Sets the # of bars from the profile axis to the profile's max value. If set negative, profile will be displayed left of axis, if positive, profile will be displayed to the right of the axis.
Display Offset: Sets the # of bars in front(or behind) the current chart bar to set the axis of the profile. If negative, the axis will be to the left of the current chart bar, if positive the axis will be right of the current chart bar.
Display Historical POC/VAH/VAL: Choose to display historical poc,vah,val lines.
Colors: I'm not explaining colors.
Enjoy!

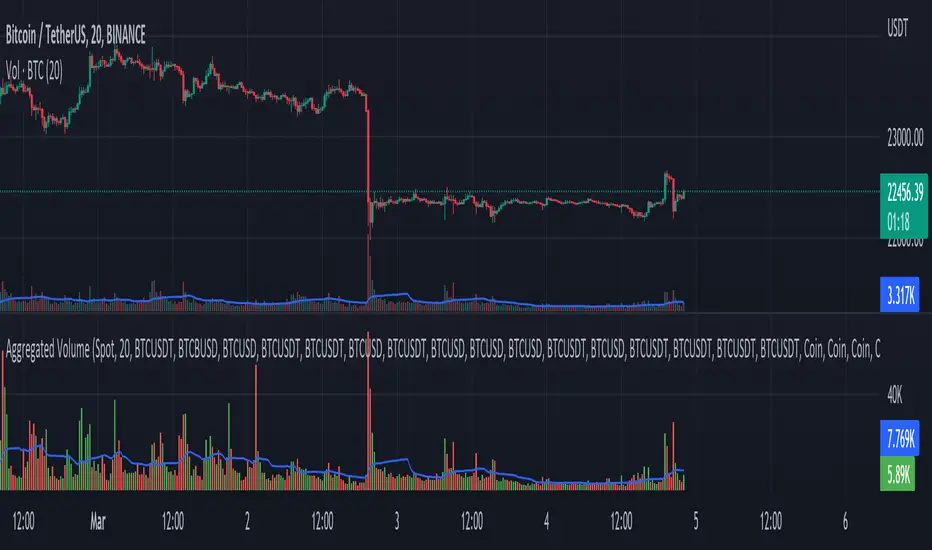
Aggregated Volume - By InFinitoVolume indicator that works like a normal Volume indicator with the following additional features:
- Aggregates Volume across different exchanges and Market Types - *Original Aggregation Code By Crypt0rus*
- Displays data by Market Type and combinations of Market Types (Spot, Futures , Perpetuals, Futures+Perpetuals & All Volume )
- Allows for the user to select the exchanges from which to aggregate Volume (This allows for the aggregation of any other pair i.e ETH, SOL, LUNA)
- Normalizes the Volume reported through TradingView by every exchange in order to homogenize the data (i.e Binance reports Bitcoin Volume in BTC terms BUT FTX reports Bitcoin Volume in USD)
- Allows for manual input of how Volume is reported in a particular Pair/Exchange (i.e If you want to aggregate data from the BTCEUR pair, you can select 'Other' and introduce the Value of EUR in USD terms)
COIN: Select this option if the volume is reported in terms of the asset traded ( BTC , ETH, SOL, etc....)
USD: Select this option if the Volume is reported in terms of the USD amount traded
OTHER: Select this option in case the Volume is reported in another currency (EUR, ETH, etc....)
NOTE: *ALL VOLUME IS AGGREGATED IN TERMS OF THE ASSET TRADED, FOR EXAMPLE IN THIS CASE: BTC . BUT IF YOU'RE AGGREGATING BNB PAIRS, VOLUME WILL BE CALCULATED TO BE DISPLAYED IN BNB TERMS*
Feel free to leave suggestions/questions in the comments or to message them directly to me
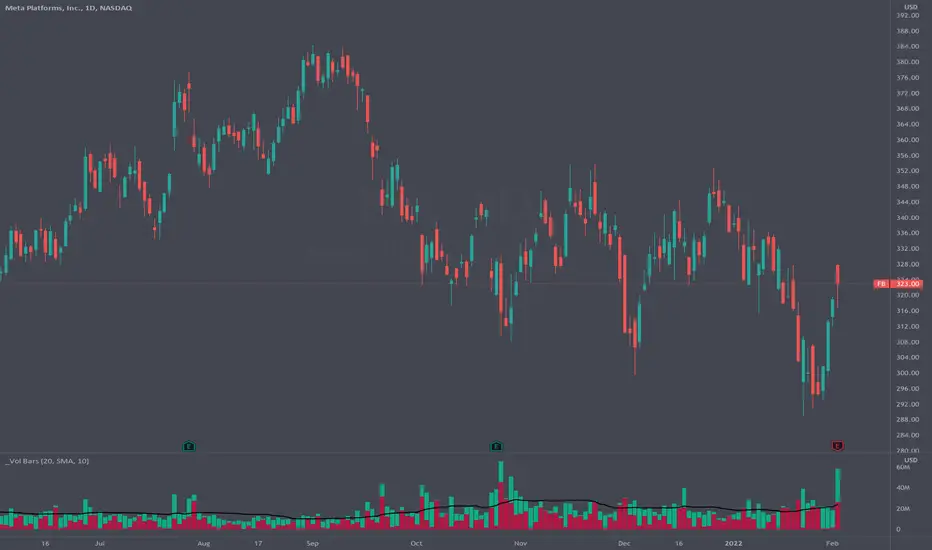
Volume Pressure BarsDescription
This indicator transforms the normal volume bars into buying and selling segments. This allows the user to easily see how much buying and selling pressure is occurring on any given timeframe. The buying and selling pressure values are calculated using the following equations:
buyingPressure = volume * (close - low) / (high - low)
sellingPressure = volume * (high - close) / (high - low)
Moving Average Line
Also included in this indicator is the optional moving average line. This allows the user to easily see if volume is above or below the average line. All aspects of the moving average line can be adjusted. The line can be toggled on & off, the length of the moving average can be adjusted, the mathematical smoothing function can be chosen, and the color & style of the line can be configured.
Scaling
If the volume pressure bars are displayed on the same “pane” as the price candles, then the volume bars can be scaled up or down. In the Input settings check the “Scale Bars” checkbox. Then increase the “Scaling Factor” number to make all of the volume bars smaller (to allow more room on your chart) or decrease the number to make the volume bars bigger.
IMPORTANT NOTE #1: scaling only works when the volume pressure bars are in the same pane as the price candles. If the volume pressures bars are in their own pane, then the “Scale Bars” toggle has no effect.
IMPORTANT NOTE #2: if the volume pressure bars are in the same pane as the price candles then there will be a sizable gap between the bottom of the volume bars and the time axis on the TradingView chart. This IS NOT a bug in this indicators code. The gap IS a bug in the TradingView platform that affects all volume indicators besides the default volume indicator that comes with each blank chart. To remove the gap then move the “_Vol Bars” indicator to its own pane above or below the main pain.
Volume Numbers
In Pine Script there is not a true stacked bar chart plot. What the author has to use are multiple bar charts that are in front and behind each other. This gives the impression that the bars are truly stacked because the selling pressure is always smaller than the total volume on any given bar. There is no issue to visually look at the bars and see their heights but if the user used their cursor to hover on a bar to get the actual volume pressure values it leads to issues. To address this problem the author has created a third invisible bar called “Buy Vol Label” that is the buy pressure volume value. Thus when the user hovers the cursor over a bar the first value (from left to right) is the total volume for the bar, the second value is the sell pressure, the third value is the buy pressure, and the fourth value (if toggled on) is the moving average value.
Volume Status by BobRivera990This indicator is a tool that shows a relative view of the trading volume and classifies the volume into 5 different levels and makes it easy to compare it in different periods.
It is also specifically designed for detecting failed (fake) breakouts.
How it works?
This tool uses something similar to Bollinger Bands , but with more bands.
I used two standard deviations (positive and negative) on either side of a simple moving average ( SMA ) of the trading volume .
I also used twice the standard deviation (negative and positive) on either side of the SMA to create more bands.
The classification is made as follows:
Usage:
This indicator is a tool to compare the volume , relatively and in different periods. It is also a good tool for detecting failed (fake) breakouts.
Fake Breakouts Occurs when a support or resistance is broken but the market does not accept and support these price changes. This lack of support will cause trading volume to decrease during or after the breakout.
So, if the indicator shows Low-Volume or Minor-Volume status at the time of the breakout or right after that, it may be a fake breakout.
The truth is you cannot avoid false breakouts completely as long as you trade breakouts but you can minimize the risk and the loss.
Thank you all for forming this unique community.
Parameters:
" Volume SMA Length " => The length of the simple moving average of the Volume

Volume EffectivenessI have been trying to work with volume as an indicator for quite some time, as it holds qualities as a 'leading indicator'.
However, please note that any indicator which to some extent predict a future trend has its issues as it can be misleading.
But, in some datasets in a selected timeframe the leading properties of volume as an indicator are useful.
So this script is not too complicated. It shows a numeric which resembles the 'effectiveness of volume' in moving price.
For example, if a small volume creates a large price change - the Volume Effectiveness indicator will be high and show a spike
Whereas, if a large volume creates a small price change - the Volume Effectiveness indicator will be low
I used 3 metrics to represent Volume Effectiveness (these are different colors on the bar chart)
One price difference is the absolute(high - low) for each bar
Another is the absolute(open - close)
The 'open-close' is smaller than the 'high-low', so note this when viewing the bar charts
The final metric depends on if the open is greater than the close or vice-versa
But it considers the 'absolute(high-low)' and the difference between the open and the high (or low) and the close and the low (or high)
So the final metric is the largest of the 3 metrics and is generally the most useful of the 3 however, the other 2 are displayed to provide a better understanding of what 'Volume Effectiveness' displays
Note, I use absolute values so they are only positive, i.e. there are no negative values to represent a price drop within a bar
So, why is this indicator useful - its because volume is a leading indicator
A decreasing volume tends to suggest a price change is coming
Also, when the volume within a bar is very small, its Volume Effectiveness tends to go very high
That means a small trade volume creates a relatively large change in price
This is ideal conditions for a big pump (or big dump - although this indicator seems to work better before pumps)
A large spike in the Volume Effectiveness is commonly/sometimes preceding a big pump
So watch this indicator - and if there is a big spike - evaluate other market conditions to consider getting into position
Large spikes in the Volume Effectiveness can precede big price changes and therefore can provide a leading indication before a pump or dump
Timeframe is important - I found on the daily timeframe this indicator did not provide sufficient lead to be useful. Similarly on the <15min timeframe the spikes were not highly correlated with pumps/dumps
However, in medium timeframes (15mins, 1hour, 4hours) this indicator can be useful for predicting sizeable price changes.

Volume Brakeout v1Volume Brakout indicator is used to help determine trend direction strictly based on Negative and Positive volume data.
How to Read:
- Moving Average crossovers are used to help determine a possible trend change or retracement.
- The area cloud on the bottom is calculated by the difference of the moving averages. This could be used to help determine the trending volume strength.
- Bright colored volume bars are large volume spikes calculated by the x factor in the options.
Other changes:
- Volume Depth is going open source with numerous of its indicators. This is only one of many!
- Volume is now displayed without being altered for calculations.

Volume Price ROC Tracker and Shadow CandlesWhen price goes up on negative volume, then market is telling there is doubts in investors mind.
The SPX upside recent month was a on. Lower volume so, the rally in my view will not last. Read my articles on current market.
This very simple scripts shows if price drop or gain was on a upside volume or down side. It is a visual track on the candle reflecting the volume ROC overlapped as a price movement on the actual candle. So don't mistake it with a moving average. Red means volume was down even if price has gone up. Basically if a price goes up on a increase ROC volume then you can trust it. Otherwise it is likely that it won't last.
If you can improve on this idea, it would be great. I think there is not enough volume related scripts that diggs a bit deeper to describe the market behaviour in the future. After all all technical analysis are supposed to tell us about future price not just how it was in the past.

Volume Momentum [LucF]Volume momentum gives much more information than a simple volume MA. It does require interpretation however, since increasing volume momentum can indicate strengthening of both an up or down movement. Volume momentum peaks and bottoms are also interesting as they often lead to shifts in price movement.
In order to help interpretation, I color rising volume momentum using price momentum. Green indicates volume-supported upward price movement and red indicates volume-supported downward price movement.
As to falling volume momentum, in my world view it indicates exhaustion or disinterest which requires prior price activity to be interpreted. In strong and steady price movements it can indicate a mere pause. After high price volatility often signalling a top or bottom, falling volume momentum often leads reversals.
Features
Two optional MAs on the main volume momentum line, with crosses on the short MA.
A higher time frame line (shown by default), with the higher time frame being a user-defined multiple of the current chart’s interval. The default is 8, so that a 15m chart will also show a 2h volume momentum.
Two Markers
Tops/Bottoms (marker 1): these occur on high/low price momentum pivots situated in favorable regions, combined with volume momentum peaks.
Pauses/Reversals (marker 2): these simply identify volume momentum high pivots that often lead to shifts in price movement. They are not directional. You can choose to color bars where these markers occur (shown on chart).
You can show only long or short markers.
Alerts
You can define alerts on any combination of markers you configure. After defining the markers you want the alert to trigger on, make sure you are on the interval you want the alert to be monitoring at, then create the alert, select Volume Momentum, use the default “Configured Markers” alert condition and choose your triggering window (usually “Once Per Bar Close”). Once the alert is created, you can change the indicator's inputs with no effect on the alert.
Use Cases
The higher time frame line is very useful in situating current volume activity in a larger context.
I consider all peaks in volume momentum as potentially significant events.
When looking for an entry, I will often wait for the descending volume momentum to change direction at a shorter interval, using price momentum to confirm that increasing volume is working in my favor.
Volume momentum variations can often inform otherwise insignificant price momentum activity.
Here I use price momentum to color volume momentum; inversely, I also use volume momentum to color my momentum indicator.
Notes
Where the markers on my Volume Columns indicator focus on confirming strength of price movements, this indicators’ markers try to focus on shifts in price movement.
My volume momentum is calculated using a smoother variant of CCI which came to be known as WaveTrend.

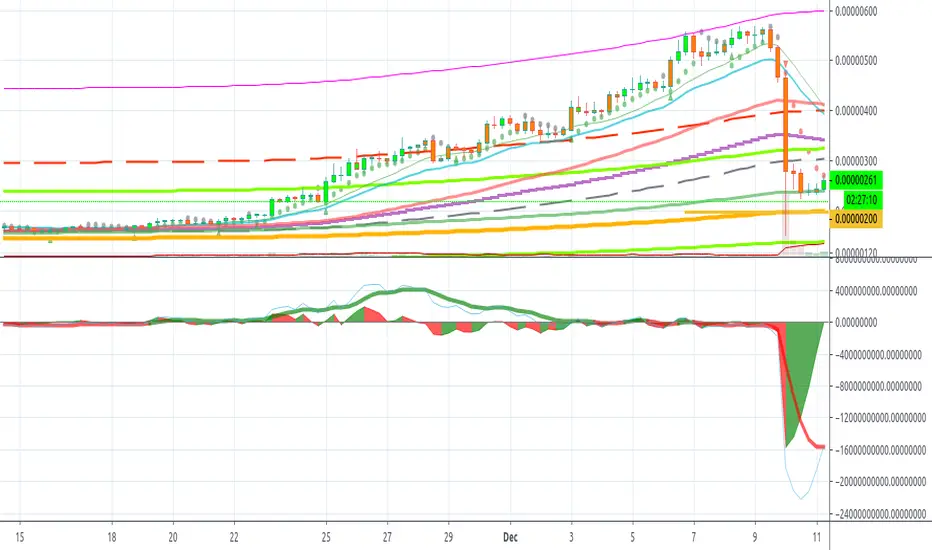
Volume ImpactVolume Impact (The area)
Average Volume (The thick line, xTrigger)
Volume Impact = Volume Chance - Average Volume
It provides very reliable buy sell signals. Buy(green) when increasing, sell(red) when decreasing. Volume Impact might drop before the actual price so it has an early warning potential.
Before trend changes volume average diverges from the prices. It moves reverse to the prices.
Also before trend changes, volume impact peaks diverges from price peaks. So you know a big drop is coming.
Klinger Volume Oscillator inspired this indicator... This data is there but it is more difficult to interpret.
In summary, you can foresee trend changes.
Volume+ by BDthis is a simple volume indicator,
shows volume sizes with color differences on histogram (total volume, neutral volume and effective volume)
bar length = total volume, gray bar= neutral volume, green bar= pozitive volume, red bar= negative volume
variable value; The bar's average will be calculated until the given value. by default is average not calculated
Volume Strength Candles / Colored BarsIs Price Action Higher or Lower on STRONG or WEAK VOLUME from lookback
(Strong or Weak Bulls // Strong or Weak Bears)
Candles / Bars Indicate the Following (default 13 period lookback / Length)
MAROON Bear Candle with STRONG VOLUME more than 150% of the lookback / length (13 default), STRONG Bear Candle Confirmed With Volume
RED Bear Candle while VOLUME is BETWEEN 50% & 150% of the Lookback / Length (13 default), Neutral Bear Volume Neither strong or weak
ORANGE Bear Candle with WEAK VOLUME (Less than 50% of the Length / Lookback)
DARK GREEN Bull Candle with STRONG VOLUME MORE than 150% of lookback
GREEN Bull Candle with Neutral VOLUME BETWEEN 50% & 150% of the lookback / Length
AQUA Bull Candle with WEAK VOLUME less than 50% of the Lookback
Is price confirmed by volume?
Can Change the Lookback / Length from 13
Can Change the Colors and Transparency to easily see based off your chart background colors I recommend ZERO Transparency to easily identify volume strength (i use white background but many use black or other)

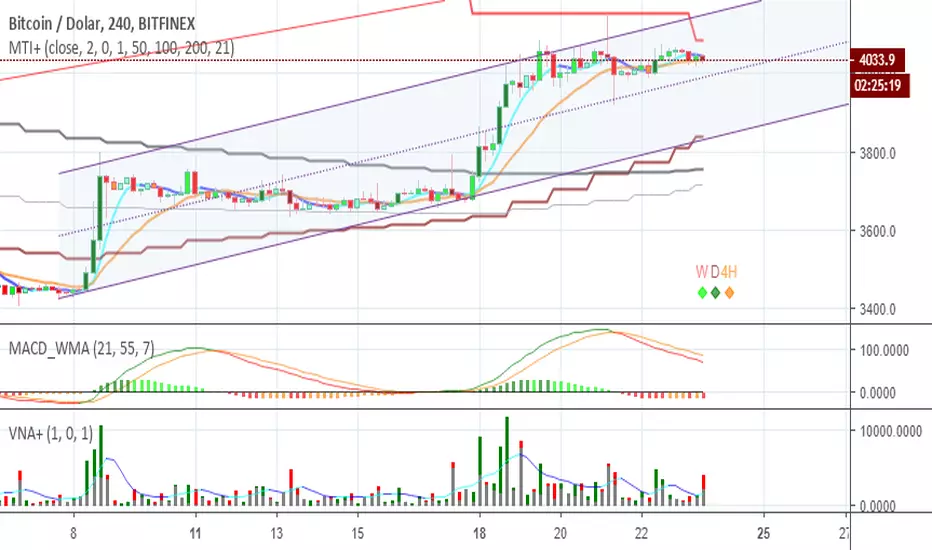
VOLUME WEIGHTED MACD V2 VWMACDV2 BY KIVANÇ fr3762Second version of Buff Dormeier's Volume Weighted MACD indicator....
Here in this version; Exponential Moving Averages used and Weighted by Volume instead of using only vwma ( Volume Weighted Moving Averages).
I personally asked Mr Dormeier, the developer of this indicator, and he confirmed this second version could be used.
I personally think that this one is more effective when comparing with the vwma version...
Volume Weighted MACD
Volume Weighted MACD (VW-MACD) was created by Buff Dormeier and described in his book Investing With Volume Analysis. It represents the convergence and divergence of volume-weighted price trends.
The inclusion of volume allows the VW-MACD to be generally more responsive and reliable than the traditional MACD .
What is MACD (Moving Average Convergence Divergence)?
Moving Average Convergence Divergence was created by Gerald Appel in 1979. Standard MACD plots the difference between a short term exponential average and a long term exponential average. When the difference (the MACD line) is positive and rising, it suggests prices trend is up. When the MACD line is negative, it suggests prices trend is down.
A smooth exponential average of this difference is calculated to form the MACD signal line. When the MACD line is above the MACD signal line, it illustrates that the momentum of MACD is rising. Likewise, when the MACD is below the MACD signal line, the momentum of the MACD falls. This difference between the MACD line and the MACD signal line is frequently plotted as a histogram to highlight the spread between the two lines.
What is the difference between MACD and VW-MACD?
Volume Weighted MACD is substituting the two exponential moving averages to compute the MACD difference with the two corresponding Volume-Weighted Moving Average . Thus, VW-MACD contrasts a volume-weighted short term trend from the volume-weighted longer term trend.
The signal line is left as an exponential moving average because VW-MACD line is already volume weighted.
Developer: Buff Dormeier @BuffDormeierWFA on twitter

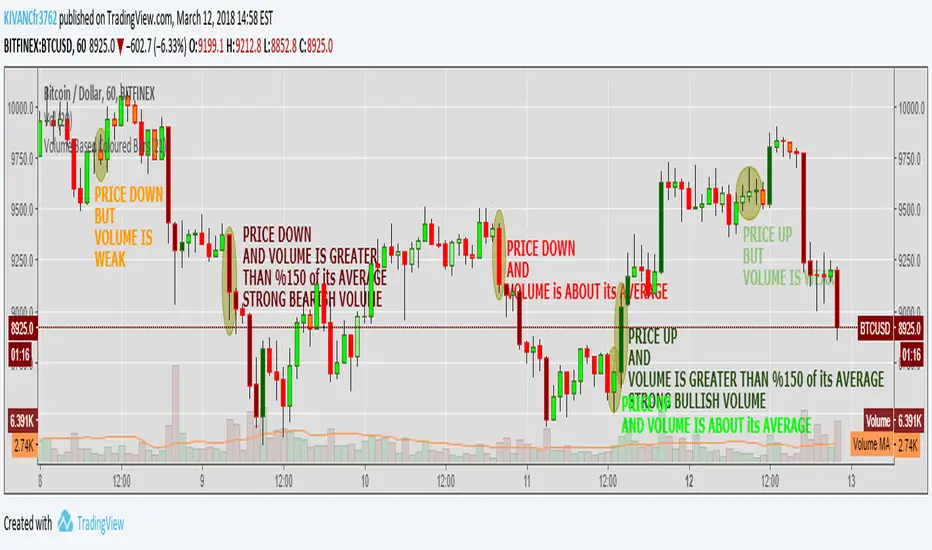
Volume Based Coloured BarsVolume Based Coloured Bars:
Most of the time traders are confused about if the price movements were supported by VOLUME .
This indicator colors the bars into volume weighted signals...
When prices go down bars are red and contraversely when up, bars are green. Additionally we have two more colors for each
situation:
PRICE BARS ARE:
DARK RED when prices go down and VOLUME is bigger than 150% of its (default 21 day) average, that indicates us price action is supported by a strong BEARISH VOLUME
RED when prices go down and VOLUME is BETWEEN 50% AND 150% of its (default 21 day) average, at this situation we can think that volume is neither strong nor weak
ORANGE when prices go down and VOLUME is just less than 50% of its (default 21 day) average, so the volume is weak and doesn't support the price action much
DARK GREEN when prices go UP and VOLUME bigger than 150% of its (default 21 day) average, that indicates us price action is supported by a strong BULLISH VOLUME
GREEN when prices go UP and VOLUME is BETWEEN 50% AND 150% of its (default 21 day) average, at this situation we can think that volume is neither strong nor weak
LIGHT GREEN when prices go UP and VOLUME is just less than 50% of its (default 21 day) average, so the volume is weak and doesn't support the price action much
21 day Simple Moving Average used as default value which can be changed in the settings menu,
21 day is considered as a month for STOCK Markets, it would be more accurate to set the value to 30 for CRYPTO CURRENCIES
Volume (D)EMAA simple yet configurable indicator that shows recent traffic volumes.
The time period is specified as weeks/days/hours/minutes, not as bars.
Set the volume period to non-zero if you want to use a generalized double EMA instead of plain.
The ratio option will show the size of the current volume compared to the volume in the specified time period (expect to see something very non-Gaussian, say goodby to trusting your ATR and stddev, and say hello to fat tails.) With the "together" option, it compares the current volume to the both sides together (buy+sell), otherwise it compares it to just its own.

Volume + RSI & MA Differential"Volume + RSI & MA Differential," integrates volume, RSI, and moving average differentials to generate trading signals. The script calculates a 14-period RSI to identify overbought or oversold conditions, with customizable thresholds for buy and sell signals. It also computes a 20-period SMA of the volume to smooth out trading activity data, helping to identify trends in market participation.
The script incorporates a fast (50-period) and a slow (200-period) SMA to analyze short-term and long-term trends, respectively. The differential between these moving averages, adjusted by the volume SMA, is used to identify potential trend changes or confirmations. Bars are colored yellow when the RSI is below the buy threshold and volume is high, indicating a potential buy signal. Conversely, bars turn red when the RSI is above the sell threshold and the fast MA is below the current close price, suggesting a potential sell signal. Neutral conditions result in grey bars.
Additionally, the script uses color-coding to plot the volume SMA and a line that changes color based on the moving average differential. A black line indicates a broadening MA cloud and a bullish trend, while a grey line suggests a narrowing MA cloud and a potential selloff. A yellow line signals the beginning of a buyback. This visual representation helps traders quickly identify potential trading opportunities and trend changes, making the script a valuable tool for technical analysis.

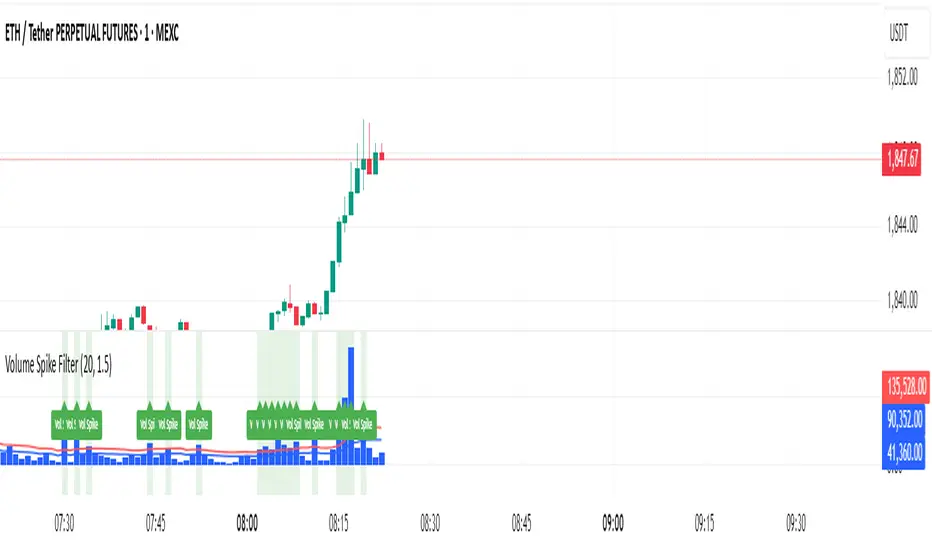
Volume Spike Filter### Volume Spike Detector with Alerts
**Overview:**
This indicator helps traders quickly identify unusual spikes in trading volume by comparing the current volume against a simple moving average (SMA) threshold. It's particularly useful for beginners seeking clear signals of increased market activity.
**Settings:**
* **SMA Length:** Defines the period for calculating the average volume (default = 20).
* **Multiplier:** Determines how much the volume must exceed the SMA to be considered a spike (default = 1.5).
* **Highlight Spikes:** Toggle to visually highlight spikes on the chart (default = enabled).
**Signals:**
* 🟩 **Highlighted Background:** Indicates a volume spike that surpasses the defined threshold.
* 🏷️ **"Vol Spike" Label:** Clearly marks the exact bar of the spike for quick reference.
**Usage:**
Use these clear volume spike alerts to identify potential trading opportunities, confirmations, or shifts in market momentum. Combine this with other technical indicators for enhanced analysis.
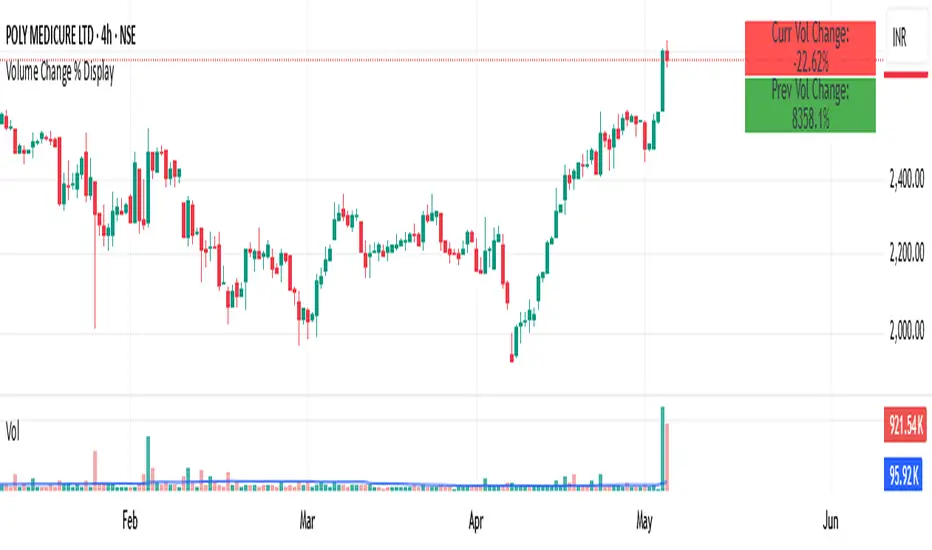
Volume Change % Display1- Current bar's volume change %
2- Previous bar's volume change %
* Each line uses its own color based on volume rising or falling.
* Keeps the layout compact and readable.
Volume Disharmony IndicatorThis indicator is designed to detect imbalanced volume compared to the open/close of the corresponding candle body. The idea is that institutions often trade in higher volume within a smaller price range. Identifying these can give an indication if there is a rally or selloff happening. The code looks at the median of all the prior candles from the point of the last trigger and compares them to the range in body of the candles in order to dynamically find a baseline, by which imbalances can be more accurately detected throughout changing market conditions.

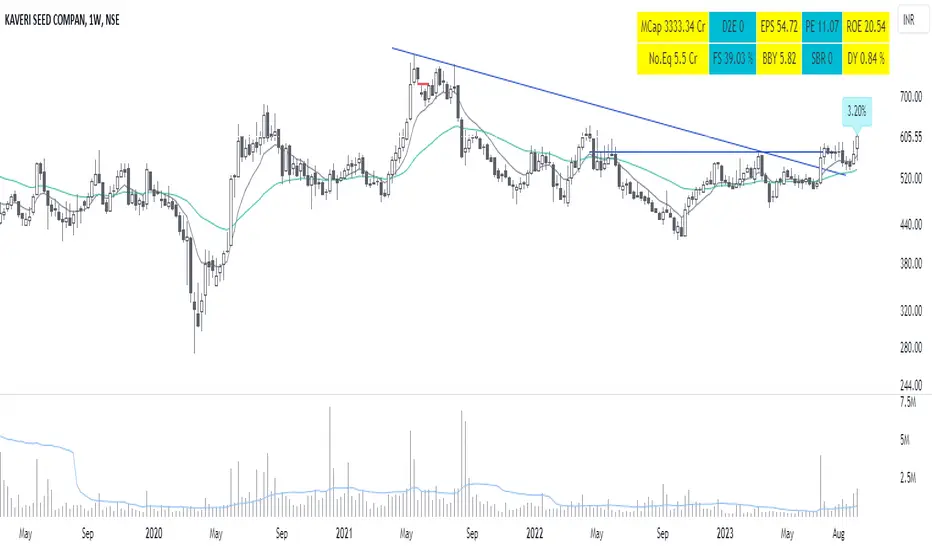
Volume Traded in Total Outstanding Shares with basic fundamentalThis indicator helps to find Volume Traded in Total Outstanding Shares with basic fundamental parameters like MCAP, EPS, PE, D2E and No. Equity shares.