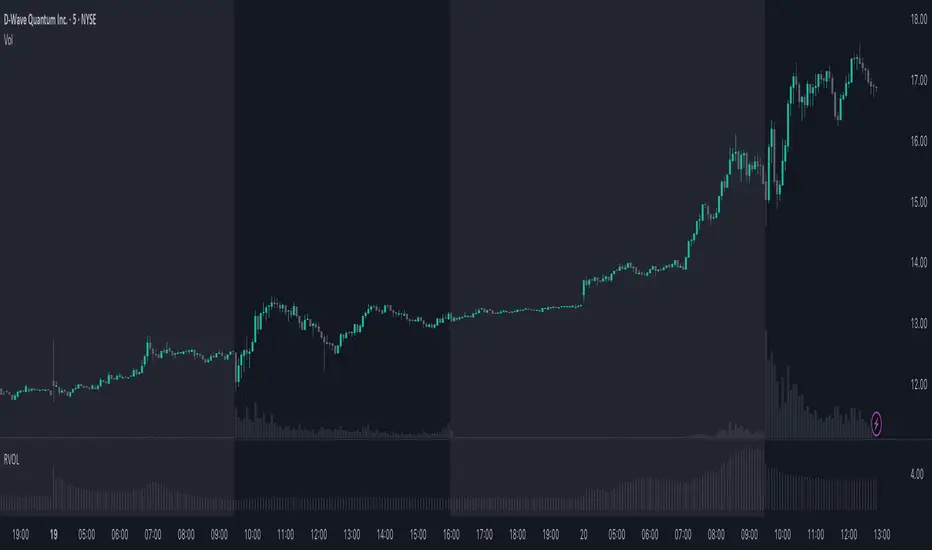
RVOL - Relative Volume IntradayIn the context of intraday trading, RVOL stands for Relative Volume. It is a technical indicator that compares the current volume of a stock to its average volume over a specified period. A RVOL above 1 suggests higher than average trading volume, potentially indicating increased interest and volatility.
The precise definition of real time relative volume is current cumulative volume up to the time of day divided by average cumulative volume up to this time of day. It means for example taking the volume from 09:45 to 10:00 and comparing it to what it does from 09:45 to 10:00 every day.
This indicator supports all timeframes from1 minute to 4 hours.
Cerca negli script per "volume"
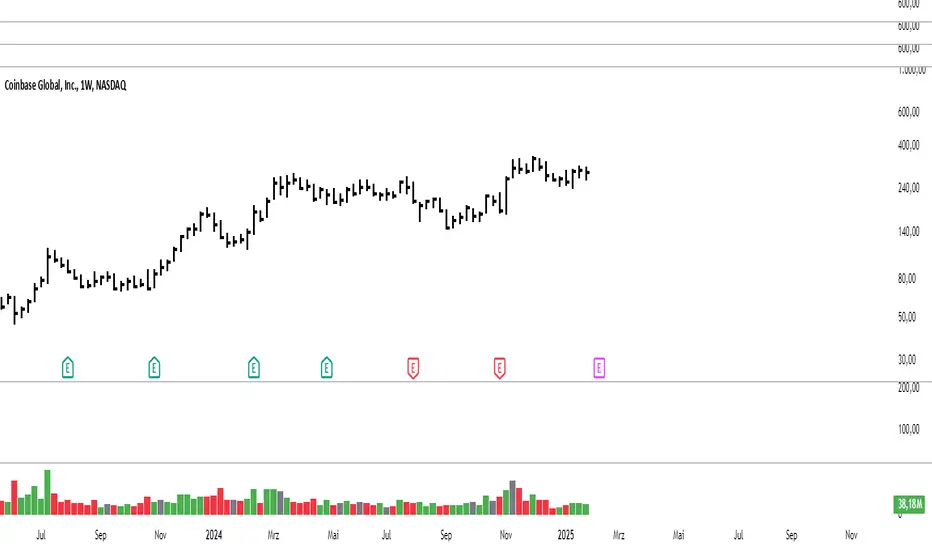
Modified Volume IndicatorThis indicator colors volume bars based on price and range conditions for a given period:
Green Bars:
The close is at least 70% of the way up the daily range (from the low).
The close is also 1% or more above the low.
Red Bars:
The close is at least 70% of the way down the daily range (from the high).
The close is also 1% or more below the high.
Gray Bars:
Volume bars that don’t meet the above conditions are neutral.
Purpose
Green Bars highlight strong upward closes.
Red Bars indicate weak downward closes.
Gray Bars show neutral or inconclusive price movement.
This indicator helps traders identify momentum shifts and trend strength in real-time.
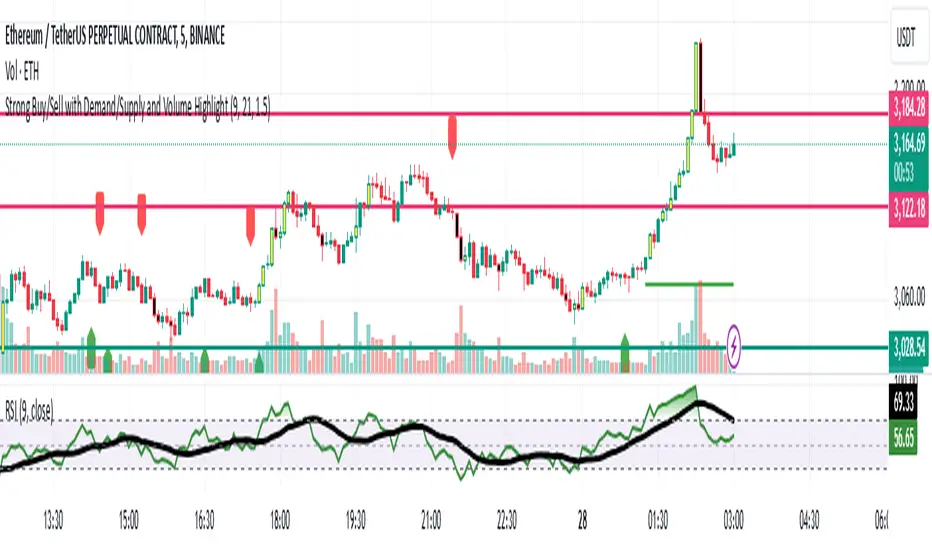
Strong Buy/Sell with Demand/Supply and Volume HighlightStrong Buy/Sell with Demand/Supply and Volume Highlight
This indicator combines key technical elements to provide traders with robust buy and sell signals while highlighting significant market zones and volume trends. It's designed for traders seeking clarity and precision in their decision-making process.
Features:
Dynamic Buy/Sell Signals:
Utilizes the crossover of a fast EMA (default: 9) and a slow EMA (default: 21) to generate reliable buy and sell signals.
Buy signals are marked with green upward labels, while sell signals are marked with red downward labels.
Demand and Supply Zone Detection:
Automatically plots demand (support) and supply (resistance) zones based on recent price movements when buy or sell signals are triggered.
Zones are visually marked with lines for quick identification of key price levels.
Volume Analysis:
Highlights candles with high volume relative to the average 20-period volume (adjustable via the volume multiplier input).
High-volume bullish candles are marked green, and bearish candles are marked red, allowing traders to spot significant market activity instantly.
Inputs:
EMA Periods: Customizable fast and slow EMA settings to adjust signal sensitivity.
Demand/Supply Zones: Option to toggle the visibility of demand and supply levels.
Volume Multiplier: Control the threshold for detecting high-volume candles.
How to Use:
Buy Opportunities: Look for buy signals when the fast EMA crosses above the slow EMA, supported by demand zones and high volume.
Sell Opportunities: Observe sell signals when the fast EMA crosses below the slow EMA, reinforced by supply zones and bearish high-volume candles.
Combine this indicator with your trading strategy to enhance decision-making and improve trade timing.
This indicator is suitable for multiple timeframes and markets, making it a versatile tool for scalpers, day traders, and swing traders.
Rolling Angled Volume Profile [Trendoscope®]🎲 Volume Profile Indicators
🎯Traditional Volume Profile
Volume profile indicators visually represent the distribution of volume across price levels. These indicators typically operate on horizontal price levels, making them effective in identifying supply and demand zones in ranging markets. However, they are less useful in trending markets where price movements follow a slope.
🎯The Need for Angled Volume Profiles
Just as support and resistance levels differ from trendlines, volume profile indicators require an equivalent method to account for volume distribution along a sloped trajectory. This would enable more accurate volume analysis in trending markets.
We identified the need of Angled Volume profile and have already published few indicators that implements the concept.
Angled Volume Profile calculates volume distribution along a slope. Users interact with the indicator by selecting the starting point, after which the volume profile is calculated for the selected trajectory.
Volume Forks is another tool that extends angled volume profile analysis, aligning volume profiles along the trajectory of pitchforks.
🎲 Rolling Volume Profile Indicator
The Rolling Volume Profile offers a new approach to angled volume profile calculations, addressing some limitations of earlier implementations:
🎯 Rolling Calculation
The volume profile is calculated for the last N bars of the instrument
The slope of the profile lines is determined by the closing prices of the starting and ending bars
Profiles are drawn in the direction of price movement between the start and end bars.
🎯 Dynamic Updates
As new bars are added, the calculations are updated, and the profile is redrawn based on the latest data.
This dynamic behavior earns it the name "Rolling Volume Profile."
🎯 Advantages Over Earlier Versions
Unlimited Profile Lines : Unlike previous implementations limited to 500 profile lines, this indicator uses polyline objects, overcoming the restriction.
Live Updates : Previous angled volume profile tools lacked real-time updates when new bars appeared. This limitation is resolved in the Rolling Volume Profile Indicator.
The Rolling Volume Profile provides an efficient and scalable solution for analyzing volume in trending markets.
🎯 Indicator Settings
Simple settings include few customisable options

Abnormal Delta Volume HistogramThis indicator can help traders spot potential turning points or heightened volatility and provides a dynamic measure of unusual market behavior by focusing on shifts in “delta volume.” Delta volume is approximated by assigning all of a bar’s volume to the bullish side if the close is higher than the open and to the bearish side if the close is lower. The result is a net volume measure that can hint at which side—buyers or sellers—has the upper hand. By comparing this delta volume to its historical averages and measuring how far current readings deviate in terms of standard deviations, the indicator can highlight bars that reflect significantly stronger than normal buying or selling pressure.
A histogram visualizes these delta volume values on a bar-by-bar basis, while additional reference lines for the mean and threshold boundaries allow traders to quickly identify abnormal conditions. When the histogram bars extend beyond the threshold lines, and are colored differently to signal abnormality, it can draw the trader’s eye to periods when market participation or sentiment may be shifting rapidly. This can be used as an early warning signal, prompting further investigation into price action, external news, or significant events that may be driving unusual volume patterns.
Important Notice:
Trading financial markets involves significant risk and may not be suitable for all investors. The use of technical indicators like this one does not guarantee profitable results. This indicator should not be used as a standalone analysis tool. It is essential to combine it with other forms of analysis, such as fundamental analysis, risk management strategies, and awareness of current market conditions. Always conduct thorough research or consult with a qualified financial advisor before making trading decisions. Past performance is not indicative of future results.
Disclaimer:
Trading financial instruments involves substantial risk and may not be suitable for all investors. Past performance is not indicative of future results. This indicator is provided for informational and educational purposes only and should not be considered investment advice. Always conduct your own research and consult with a licensed financial professional before making any trading decisions.
Note: The effectiveness of any technical indicator can vary based on market conditions and individual trading styles. It's crucial to test indicators thoroughly using historical data and possibly paper trading before applying them in live trading scenarios.

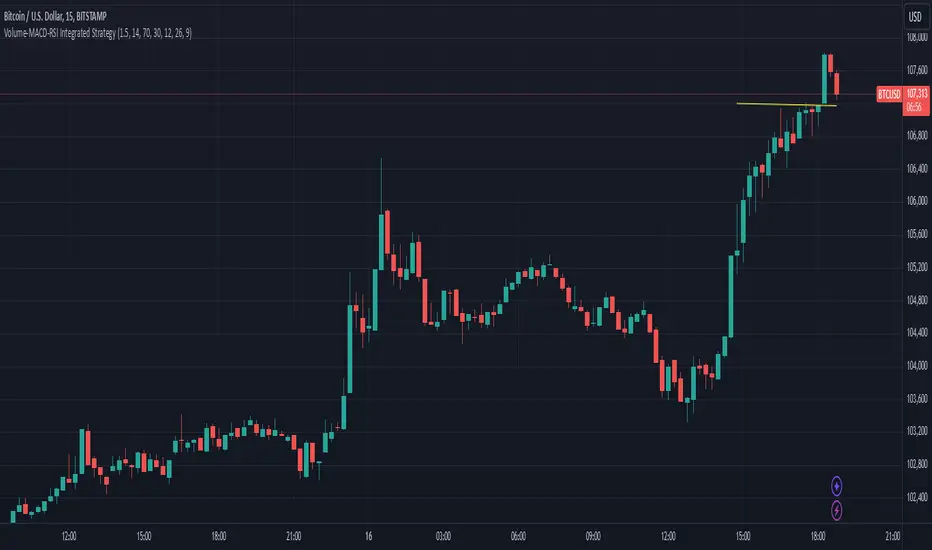
Volume-MACD-RSI Integrated StrategyDescription:
This script integrates three well-known technical analysis tools—Volume, MACD, and RSI—into a single signal meant to help traders identify potential turning points under strong market conditions.
Concept Overview:
Volume Filter: We compare the current bar’s volume to a 20-period volume average and require it to exceed a specified multiplier. This ensures that signals occur only during periods of heightened market participation. The logic is that moves on low volume are less reliable, so we wait for increased activity to confirm potential trend changes.
MACD Momentum Shift:
We incorporate MACD crossovers to determine when momentum is changing direction. MACD is a popular momentum indicator that identifies shifts in trend by comparing short-term and long-term EMAs. A bullish crossover (MACD line crossing above the signal line) may suggest upward momentum is building, while a bearish crossunder can indicate momentum turning downward.
RSI Market Condition Check:
RSI helps us identify overbought or oversold conditions. By requiring that RSI be oversold on buy signals and overbought on sell signals, we attempt to pinpoint entries where price could be at an extreme. The idea is to position entries or exits at junctures where price may be due for a reversal.
How the Script Works Together:
Volume Confirmation: No signals fire unless there’s strong volume. This reduces false positives.
MACD Momentum Check: Once volume confirms market interest, MACD crossover events serve as a trigger to initiate consideration of a trade signal.
RSI Condition: Finally, RSI determines whether the market is at an extreme. This final layer helps ensure we only act on signals that have both momentum shift and a price at an extreme level, potentially increasing the reliability of signals.
Intended Use:
This script can help highlight potential reversal points or trend shifts during active market periods.
Traders can use these signals as a starting point for deeper analysis. For instance, a “BUY” arrow may prompt a trader to investigate the market context, confirm with other methods, or look for patterns that further support a long entry.
The script is best used on markets with reliable volume data, such as stocks or futures, and can be experimented with across different timeframes. Adjusting the RSI thresholds, MACD parameters, and volume multiplier can help tailor it to specific instruments or trading styles.
Chart Setup:
When adding this script to your chart, it should be the only indicator present, so you can clearly see the red “BUY” arrows and green “SELL” arrows at the candle closes where signals occur.
The chart should be kept clean and uncluttered for clarity. No other indicators are necessary since the logic is already integrated into this single script.
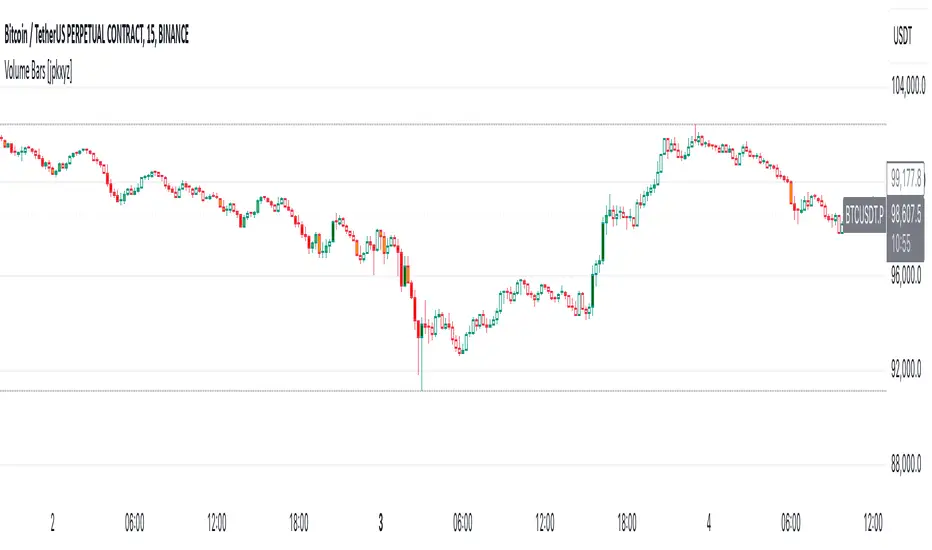
Volume Bars [jpkxyz]
Multi-Timeframe Volume indicator by @jpkxyz
This script is a Multi-Timeframe Volume Z-Score Indicator. It dynamically calculates /the Z-Score of volume over different timeframes to assess how significantly current
volume deviates from its historical average. The Z-Score is computed for each
timeframe independently and is based on a user-defined lookback period. The
script switches between timeframes automatically, adapting to the chart's current
timeframe using `timeframe.multiplier`.
The Z-Score formula used is: (current volume - mean) / standard deviation, where
mean and standard deviation are calculated over the lookback period.
The indicator highlights periods of "significant" and "massive" volume by comparing
the Z-Score to user-specified thresholds (`zScoreThreshold` for significant volume
and `massiveZScoreThreshold` for massive volume). The script flags buy or sell
conditions based on whether the current close is higher or lower than the open.
Visual cues:
- Dark Green for massive buy volume.
- Red for massive sell volume.
- Green for significant buy volume.
- Orange for significant sell volume.
- Gray for normal volume.
The script also provides customizable alert conditions for detecting significant or massive buy/sell volume events, allowing users to set real-time alerts.
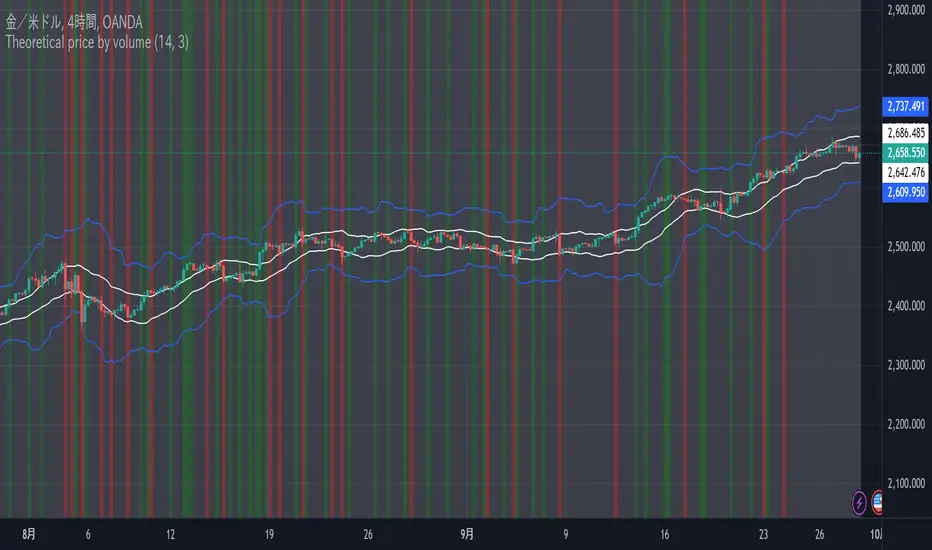
Theoretical price by volumeThis code is used to calculate a theoretical price range based on volume and price change and display it on the chart. Specifically, it calculates the “theoretical price volatility” based on price changes and volume, from which the upper and lower price limits are derived.
The price volatility is calculated by dividing the price change by the volume as the change unit volume.
Based on this volatility, we calculate the theoretical variation relative to the current price (“Theoretical Variance Difference”).
Based on the results, **Theoretical High Price (p_price) and Theoretical Low Price (m_price)** are calculated.
The chart displays the upper and lower bounds of these theoretical prices in color, and also calculates their mean and standard deviation (in the form of a Bollinger band) and plots them.
The background color on the chart indicates whether the price is within the theoretical price range, and at the same time, the mean and standard deviation of the theoretical prices are used to visualize price movements in more detail.
This indicator helps traders understand the impact of volume on price movements and helps them determine if prices are staying within the theoretical range or if there are unusual movements.
Volume Adjusted CandlesTraditional candlestick charts are invaluable for visualizing price movements over time. However, they often lack an explicit representation of trading volume, a key factor that can significantly influence price action. Our Volume Adjusted Candles Indicator fills this gap by incorporating volume directly into the candlesticks, allowing for a more comprehensive analysis.
How Candles are Calculated
Each candlestick in this indicator is adjusted based on the volume of trades that occurred during its timeframe. The process involves segmenting the price range of the trading session into equal parts, known as 'bins'. Each bin represents a segment of the price range, and the volume of trades within each bin influences the final shape and position of the candlestick.
The Formula: The volume adjusted position of each part of the candle (high, low, and close) is calculated using a weighted average formula where each price point is weighted by the volume of trades at that price. This results in a volume-weighted price for each segment of the candle, making it easy to see where the most trading activity occurred and how it impacted price movements.

Cumulative Volume Delta LineThis script is a refined version of TradingView's Cumulative Volume Delta (CVD) indicator. It features a CVD line for lower time frames and automatically switches to a Simple Moving Average (SMA) line on daily time frames and higher. This functionality makes it easier to spot Volume Delta divergences on daily charts while maintaining utility on intraday time frames.
Key Features:
Line Chart and Oscillator Configuration: Unlike TradingView's standard CVD, this script can be configured as a line chart or an oscillator, enhancing flexibility and usability.
Line chart for easier divergence spotting: The line chart format is preferred for spotting divergences, providing a clearer visual representation compared to other formats.
Accurate Calculations: Many older community CVD scripts use approximate calculations that can be inaccurate. This script leverages TradingView's own calculations, which are the most accurate available without tick data feeds.
Intraday and Daily Adaptation: The Traditional CVD script is a per bar volume delta on Daily and higher timeframes and cumulative volume delta for intraday session timeframes which makes it very hard to spot divergences on higher timeframes. This script resolves that by using an SMA on daily time frames and higher.
Auto-Switching Feature: The script intelligently switches between the CVD line and the SMA line based on the active time frame. This feature can be toggled off if you prefer to use the CVD on all time frames or the SMA on all time frames.
Customizable Settings: Building on TradingView's CVD script, this version includes all the same settings in addition to the new auto-switch, SMA length etc.
About Volume Delta and Cumulative Volume Delta:
Volume Delta is the difference between the buying and selling volume within a specified period. It helps traders understand the net buying or selling pressure in the market. A positive volume delta indicates more buying activity, while a negative volume delta indicates more selling activity.
Cumulative Volume Delta (CVD) aggregates the volume delta over time to provide a running total. This cumulative approach helps traders see the overall buying and selling pressure trends, making it easier to identify potential reversals or continuations in the market trend.

1. [Pufferman] - Comprehensive VolumeThis indicator presents a comprehensive approach to volume analysis, incorporating several key metrics to provide traders with a detailed view of market activity. Here's what's included:
1. Cumulative Relative Volume (Intraday): This metric accumulates volume data throughout the day, comparing it to historical session averages up to the current time. It's particularly useful for intraday analysis to determine if the stock is trading high or low volume before the day is over.
2. Real Relative Volume - This feature calculates the relative volume of a stock in comparison to the SPY, offering insight into whether a stock is trading with higher relative volume than the broader market.
3. Configurable Moving Average for Volume: Users can adjust the moving average period for average volume, allowing for flexible adaptation to different trading strategies and time frames. (green line in photo)
4. Above/Below Average Line: This line indicates whether the current volume bar exceeds or falls short of the session's average volume, providing immediate context for volume analysis. (red line in photo).
5. Volume Display in Abbreviations: Actual volume figures are presented in an abbreviated format, using "K" for thousands and "M" for millions, facilitating quick and easy analysis.
6. Color-Coded Relative and Real Relative Volume: Both the Relative Volume (RVOL) and Real Relative Volume (RRVOL) are color-coded to instantly convey volume concentration levels, enhancing visual analysis across multiple charts.
7. Volume Bars with Bullish and Bearish Highlights: Traditional volume bars are color-highlighted according to corresponding candle patterns, aiding in the identification of market sentiment.
Key Points:
The RVOL is a cumulative metric, considering time-of-day volume comparisons for intraday analysis. This approach offers a nuanced understanding of volume patterns specific to the timeframe being viewed.
The RRVOL provides a comparative analysis against the market, offering insights into stock-specific volume activity relative to market trends.
Note: This indicator is designed for intraday analysis and may not function as intended on timeframes above daily due to the cumulative nature of its volume calculations.

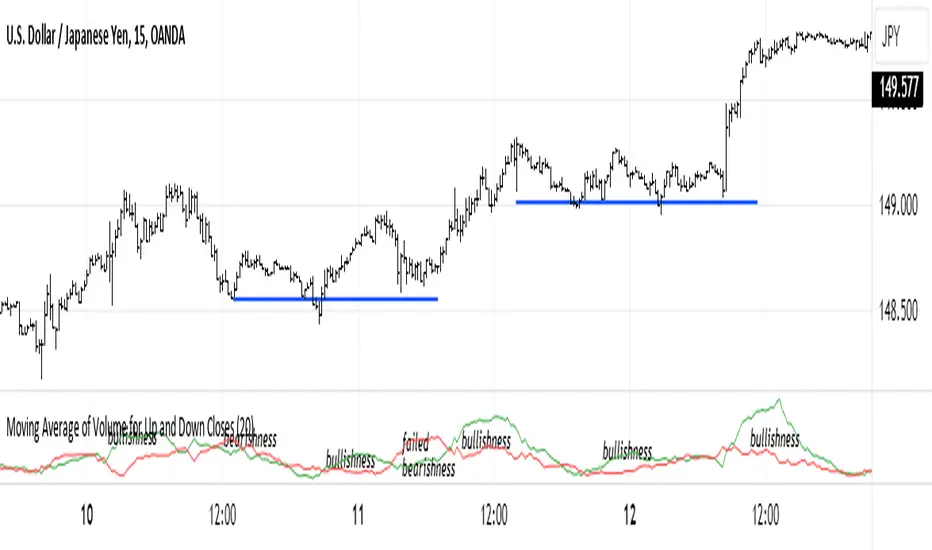
Moving Average of Volume for Up and Down ClosesThis indicator is intended to provide market bias information at a glance. Depending on the number of periods selected it can help identify changes in buying and selling sentiment or overall market bias. The two lines indicate increases and decreases in volumes for the selected number of periods. I recommend using this indicator with a minimum of clear support and resistance lines and a standard volume indicator. It does provided useful information as a stand-alone indicator. I don't use any indicators except volume, so this was meant to be my own personal volume analysis tool, however I feel that it can be very useful for other traders who may not have a deep understanding of volume analysis.
Volume Forks [Trendoscope]🎲 Volume Forks - Advanced Price Analysis with Recursive Auto-Pitchfork and Angled Volume Profile
The Volume Forks Indicator is a comprehensive research tool that combines two innovative techniques, Recursive Auto-Pitchfork and Angled Volume Profile . This indicator provides traders with valuable insights into price dynamics by integrating accurate pitchfork drawing and volume analysis over angled levels. The indicator does following things
Detects Pitchfork formations automatically on the chart over Recursive Zigzag
Instead of drawing forks based on fib levels, volume distribution over ABC of pitchfork is calculated and drawn in the direction of the handle.
🎲 Brief about Pitchfork
Pitchfork is drawn when price forms ABC pattern. Pitchfork draws a series of parallel lines in the direction of trend which can be used for support and resistance.
There are many methods of drawing pitchfork. In all cases, a line joining BC will make the base of pitchfork and fork lines are drawn from different points of the base. All the fork lines will be parallel. But, the handle of the base defines the direction of fork lines. Classification of pitchfork is mainly based on the starting and ending points of the handle.
🎲 Regular Types
Here, end of the handle is always fixed and it will be the mid point of B and C.
🎯 Andrews Pitchfork
Handle starts from A and joins the base at mid of B and C.
Forks are drawn based on fib ratios from the handle
🎯 Schiff Pitchfork
Handle starts from Bar of A and price of middle of AB and joins the base at mid of B and C
Forks are drawn based on fib ratios from the handle
🎯 Modified Schiff Pitchfork
Handle starts from mid of A and B and joins the base at mid of B and C
Forks are drawn based on fib ratios from the handle
🎲 Inside Types
Here, C will act as end of the handle which joins the Base BC .
🎯 Andrews Pitchfork (Inside)
Handle starts from A and joins the base at C
Forks are drawn based on fib ratios from the handle
🎯 Schiff Pitchfork (Inside)
Handle starts from Bar of A and price of (A+B)/2 and joins the base at C
Forks are drawn based on fib ratios from the handle
🎯 Modified Schiff Pitchfork (Inside)
Handle starts from mid of A and B and joins the base at C
Forks are drawn based on fib ratios from the handle
🎲 Brief about Pitchfork
The Angled Volume Profile technique expands on the concept of volume profile by measuring volume distribution levels over angled levels rather than just horizontal levels. By selecting a starting point and angle interactively, traders can assess volume distribution within specific price trends. This feature is particularly useful for analysing volume dynamics in trending markets.
🎲 Settings
Indicator settings include few things which determine the scanning of pitchforks and few which determines drawing of volume profile lines.
Please note that, due to pine limitations of 500 lines, if there are too many formations on the chart, volume profile may not appear correctly. If that happens, please reduce the number of volume forks per formation.

Volume Profile Bar-Magnified Order Blocks [MyTradingCoder]Introducing "Volume Profile Bar-Magnified Order Blocks", an innovative and unique trading indicator designed to provide traders with a comprehensive understanding of market dynamics. This tool takes the concept of identifying order blocks on your chart and elevates it by integrating a detailed volume profile within each order block zone.
Unlike standard order block indicators, Volume Profile Bar-Magnified Order Blocks pulls data from lower timeframe bars and assigns it to various segments of the order block. By providing this volume profile inside the order block, the indicator supplies a deeper, multi-dimensional view of market activity that can enhance your trading decisions.
Crucially, users have the ability to fine-tune the detection of order blocks. This is made possible through a single input setting called "Tuning". This integer value allows you to control the significance and frequency of the order blocks. Higher numbers will produce more significant order blocks, though they will appear less frequently. Lower numbers, on the other hand, will yield less significant order blocks, but they will occur more often. This enables you to adjust the sensitivity of the indicator according to your specific trading strategy and style.
Key Settings:
Number of Segments: Customize the level of detail in your volume profile by selecting the number of segments you want inside each order block.
Tuning: Adjust the sensitivity of order block detection to align with your trading strategy. Higher values produce more significant but less frequent order blocks, while lower values yield less significant but more frequent order blocks.
Color Inputs: Personalize the look of your chart by selecting the colors for various elements of the indicator. This ensures a seamless integration with your current chart aesthetics and improves visual clarity.
Here is a s creenshot that beautifully demonstrates the power of this indicator. You'll see how the price rejects perfectly off the highest volume segment in an order block, showcasing the indicator's potential for pinpointing high-impact price levels.
While Volume Profile Bar-Magnified Order Blocks offers many unique features, it should be used in conjunction with other indicators and forms of analysis for a complete trading strategy. As with all tools, it does not guarantee profitable trades but is intended to give traders more information to base their decisions on. Use it to complement your existing analysis and enhance your understanding of market behavior.
Experience a new level of clarity in your trading with Volume Profile Bar-Magnified Order Blocks - an indicator that goes beyond the surface to help you navigate the markets more effectively.

Cumulative Volume Delta [Aggregated]This Indicator is known as Cumulative Volume Delta (CVD), and it represents the total difference between buying and selling pressure.
This indicator use intrabar analysis to strike a balance between the most straightforward and accurate approaches of computing volume delta.
Intrabar analysis is the most accurate method to determine volume delta on historical bars on our charts when TradingView does not currently have historical tick data available.
What is included in the indicator:
Candle Type CVD
Line Type CVD
Aggregated Data which is derived from different exchanges
● Binance
● Bybit
● OKX
● Delta
● WooNetwork
You can choose between Aggregated Data or Single Data by choice.
Aggregated Data - Gathered Data from multiple exchanges which is summarize and became one.
Single Data - Data on your current chart.
Aggregated Data for CVD is still limited to BTC pair as of the moment. The indicator automatically switches to Single Data Type if the opened chart is not a BTC pair.
Candle Colors are fully customizable just like the Tradingview candle settings.
This indicator is mostly compatible to all Crypto.
NOTE: Most code is derived from my library to keep everything neat and clean.

Buyer to Seller Volume (BSV) Indicator As promised, here is the buyer to seller volume indicator!
About it/How it works:
The indicator tracks buying and selling volume. It does it simplistically but effectively simply by looking at red vs green candles and averaging out the volume of each respective candle.
It uses the SMA of buying/selling and overall volume to track buyers to sellers and also display the average volume traded over a designated period of time.
Legend:
Green lines = buying volume
Red lines = selling volume
Yellow lines = SMA over designated period of time (user input defined, default is 14 candles).
Buyers are shown in green and sellers are shown in red:
How to Use it:
Default, the indicator goes to 1 Day, 14 candle period.
My preference personally is to use to have it go to "chart" but you can view any time period on the chart that you want and designate the time period of volume you want to view independently.
This can be used for:
1. Identify trends: When buying or selling volume is above selling volume and above the SMA, you know that this persuasively supports a bullish trend. Inverse for the opposite (see below):
2. To identify fakeouts and whether there is volume backing a move:
3. To identify potential changes in trends via a cross:
Its also a great reference when you are unsure of a move. This indicator literally just saved me from wrongfully shorting the FOMC bear flag today:
Probably many other uses you can find, but these are the things I like to use it for!
As always, I have posted a tutorial video for your reference:
As always though, if you have any questions, comments or suggestions for the indicator, please share them below!
Safe trades and best of luck to all!

Nasdaq or US Composite Total VolumeBecause no NASDAQ composite index or NYSE composite index provide data volume, this script intends to use the NASDAQ Composite total volume index, index ticker : TVOLQ, or the NYSE Composite total volume index, index ticker : TVOL, as a classical volume indicator on chart.
How tu use : in the input tab choose youe prefered SMA lenght and the volume' index ticker you want to display. TVOLQ for the NASDAQ Composite total volume or TVOL for the NYSE Composite total volume.
On chart, choose to display the indicator in a new pane.

.b BTC-Exchange volumeBINANCE:BTCUSDT
It's tool to check exchange trading status.
You can see "BTC-exchange's realtime trading volume, previous closed volume" at once.
You can switch to see 'Previous close volume' on script's panel.
Timeframe recommended ; 15m, 1H, 4H, D, W, whatever.
Each exchange may have a different volume display unit, so I converted it into roughly BTC units. (using hl2 price)
This indicator aims to recognize the difference in the trading volume of the exchange at once.
It's not for the purpose of check the exact trading volume.
All data come from tradingview.
The comparison target exchanges refer to the ranking of CoinMarketCap.
if you have any questions freely contact to me by message on tradingview, or telegram @sr_bt
but please understand that responses may be quite late.

S2BU2 Volume Oscillator (Improved)Fair Use:
Please do not take my work and sell it under your own name. This was created to benefit everyone - not one person. Feel free however to use it as part of whatever work you wish to sell (of course i would applaud also giving ideas away for free - your choice though ;)
What it is:
The Basis for this Indicator was the original Volume Oscillator. I added Averages for Highs and Lows to make it easier to see relatively over- or undersupplied zones.
I also modified the oscillator to use a fast and a slow moving average à la MACD on itself to get a cleaner and earlier signal for when to expect a big move.
How it works:
A falling MA-line - especially if beneath the Signal-line indicates weakening Strength. Movements made during this time will barely move the needle.
A rising MA-line - especially if above the Signal-line, indicates increasing strength. Movements made during this time will be relatively considerable.
Crossovers above the average High/ below the average Low are especially relevant.
How to use:
Note this is only a recommendation and not advice. Feel free to experiment and adjust the indicator to fit your tradingstyle. This is only my personal setup. Feel free to share your findings.
Best used in combination with another Indicator that gives impulse direction, like for example my Stochastic Momentum Convergence Divergence (). You may also use any other indicator that works for you for this purpose - i am biased towards my own work though :D
What you want to see is a fresh direction-signal followed by a rising MA-line in the Volume Oscillator. For confirmation you can wait until the Volume Oscillator also has a crossover(up only, do not use the crossdown!) between MA- and Signal-line. Best results should be achieved if the MA-line was well below the averageLow-line. Trenddirection may change even while the Volume continuously goes up. Volume is direction agnostic. Always keep an eye on your direction indicator as changes can and will occur. These will be equally as violent and often longer lived than the previous direction you caught - you will lose a lot more than you gain if you do not keep track of that! This Indicator will help you to identify when not to waste your time on a trade, it will not be a magic pill that you can use to set and forget.

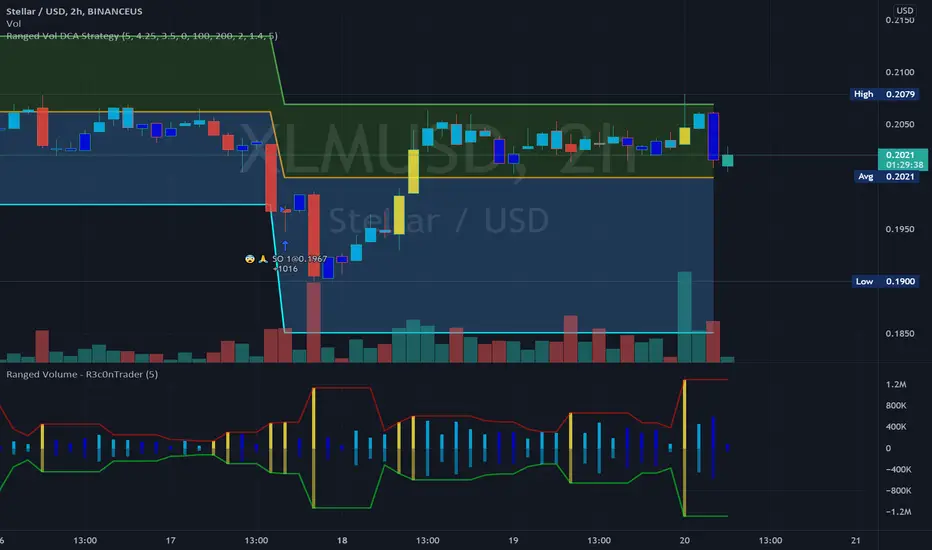
Ranged Volume Study - R3c0nTraderCredits:
Thank you "EvoCrypto" for granting me permission to use "Ranged Volume" to create this version of it.
What is this and What does this do?
This study shows the ranged volume, and it can be used to produce buy signals for a 3Commas bot.
What’s different about this script?
I added code so that negative volume has its own color settings and lower opacity than the positive volume.
I changed the color scheme from Yellow, Red, Green, and Black to Yellow, Red, Light Blue, and Dark Blue.
How to Use
1. On the “Inputs” tab:
a. Set your “Volume Range Length” (number of bars to look back)
b. “Heikin Ashi” – Usually I leave this enabled. Make sure this matches what you have in your strategy!
c. “Show Bar Colors” – Leave disabled. Let the Strategy script color the bars in the price chart.
d. “Show Break-Out” – Leave enabled. Highlights the volume breakout in yellow and breakdowns in red.
e. “Show Range” – Leave enabled
ValiantTrader_RSA VolumeINSTRUCTIONS:
-Add it to your chart then click on 3 dots in the indicator > move to > New pane below
Recommended Timeframes : M5, M15 and M30
When volume decrease and price also decrease, expect a bullish trend .
When volume increase and price decrease, expect a bullish trend .
When volume decrease and price increase, expect a bearish trend .
When volume increase and price also increase, expect a bearish trend .

Current bar predicted volumeDrag this indicator in the same panel with the volume in the object tree, then right click on the scale bar and set "merge all scale into one" for a correct visualization.
This indicator multiply the current traded volume of a candle with the total time of that candle. This offer a prediction of where, in case the volumes would keep trading at a comparable magnitude, the volume bar would close when the candle will close.
The predicted volume is indicated with a blue short line above the current volume bar, and updates in real time.
I find this indicator extremely useful to offer at a glance an idea of an ascending or descending volume pattern, that can serve as confirmation for a reversal or breakout for example.
Very suitable for short time frames, where decisions have to be taken fast.
Enjoy,
Luca.

SonicR PVA VolumesI decided to practice and rewrite some interesting scripts from mt4 to pinescript for myself, all credits are in the source code.
An interesting indicator, I decided to post it like all other alternatives have closed source code, I hope it will be useful for someone!
With this indicator, you can filter small volumes, thereby making less noise so that you notice a possible trend reversal.
For example, rising/extreme factor set to - 1.263, some volume was filtered, now it's more easy to understand, isn't ?
