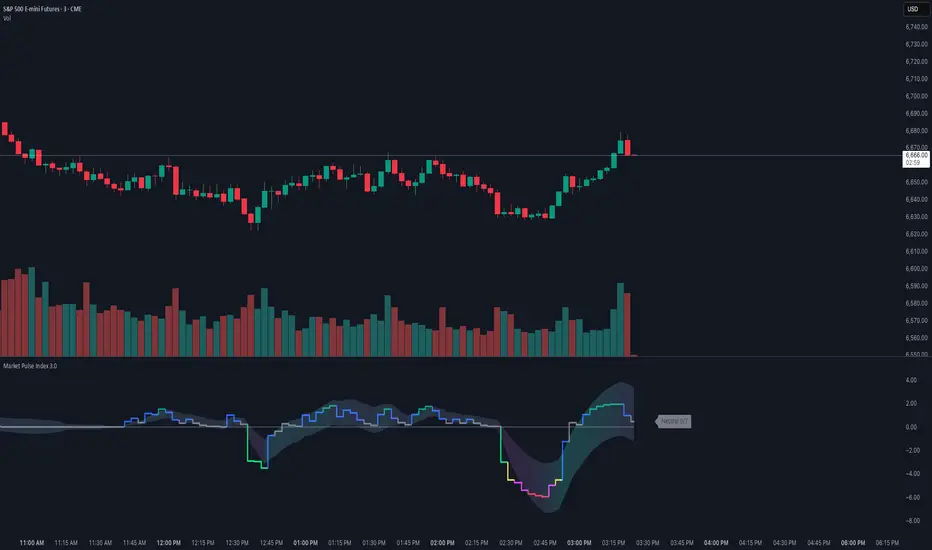
Market Pulse IndexOverview
Market Pulse Index condenses intraday market breadth into a single, color-coded score from -7 to +7 on intraday timeframe charts. It analyzes gap behavior and the markets internals into a single “pulse” line with an optional adaptive envelope that reacts to session volatility.
Designed for U.S. regular hours (09:30–16:00 ET), it actively highlights real-time regime shifts.
Unified Sentiment Score (-7…+7): Fast, visual proxy for broad intraday risk-on/off.
Intraday Session Awareness: Resets logic and envelopes each cash session; plots during 09:30–15:55 ET.
Gap Regime Intelligence
Internals: VOLD, ADD, NYSE TICK Momentum, NASDAQ TICK Momentum, TICK Counter, and UVOL/DVOL.
Filtered vs. Raw Data Modes: Choose smoother Filtered (dynamic moving average) or immediate raw data for maximum responsiveness.
Adaptive Envelope: Session-aware bands with gradient fill that reflects trend acceleration/deceleration.
Configurable Visuals: Pick Bull/Bear colors and envelope transparency; non-overlay pane keeps price clean.
Calculation Timeframe Override: Optionally compute on a fixed TF (e.g., 5m) while viewing any chart TF.
Conclusion
Market Pulse Index bridges multiple intraday breadth streams into one decisive line—ideal for confirming bias, filtering setups, and spotting regime transitions. Use the score and envelope together: strong positive readings with expanding envelope favor risk-on continuation, while deep negatives with persistent breadth weakness warn of risk-off conditions. Pair with your entries, levels, and risk controls for a complete intraday framework.
Sentiment
Market Type ClassifierMARKET TYPE CLASSIFIER
Overview
The Market Type Classifier analyzes overnight session behavior to predict daily market character. It classifies each trading day as either TRENDING (bullish or bearish) or CONTRADICTING based on how price interacts with established overnight ranges during specific time windows.
Core Methodology
Time-Based Session Analysis:
The indicator divides the overnight period into fixed and variable phases for both Asia and London sessions.
Asia Session:
Fixed Phase (18:00-19:30 EST): Establishes the initial range high and low - visualized with a customizable gray box
Variable Phase (19:30-02:30 EST): Tests the fixed range to determine direction and validity
London Session:
Fixed Phase (02:30-03:30 EST): Establishes the initial range high and low - visualized with a customizable gray box
Variable Phase (03:30-07:30 EST): Tests the fixed range to determine direction and validity
Direction Logic:
The FIRST break during the variable phase determines the session direction:
Long: First break is above the fixed range high
Short: First break is below the fixed range low
Validity Logic:
Session validity depends on whether price breaks one or both sides:
True Session: Breaks only one side of the fixed range (directional conviction)
False Session: Breaks both sides of the fixed range (lack of conviction)
Visual Components
Fixed Range Boxes:
Light gray shaded boxes mark the high-to-low ranges established during the fixed periods. These boxes help you visualize:
The exact price levels being tested during variable sessions
Where the critical breakout/breakdown levels are located
The size of the overnight consolidation ranges
Box color is fully customizable in settings and can be toggled on/off.
Classification Table:
A compact table displays:
Asia/London Direction (Long/Short) with color coding
Asia/London Session validity (True/False) with color coding
Final Market Type classification
Trading guidance based on classification
Market Type Classification
The indicator combines Asia and London session characteristics into 16 possible combinations, classified as:
Bullish TRENDING (4 combinations) - Green:
Long True + Long True
Long True + Short False
Short False + Short False
Short False + Long True
Bearish TRENDING (4 combinations) - Red:
Short True + Short True
Short True + Long False
Long False + Long False
Long False + Short True
CONTRADICTING (8 combinations) - Orange:
All remaining combinations indicate conflicting overnight behavior
Interpretation & Usage
TRENDING Markets (Green = Bullish, Red = Bearish):
When both overnight sessions show aligned conviction, the daily high/low is often created during overnight hours. The fixed range boxes will show you where these key levels formed. Expect continuation or reversion strategies to work best.
CONTRADICTING Markets (Orange):
When overnight sessions show conflicting signals, expect the daily high/low to be created during Regular Trading Hours (RTH). Opening Range (OR) breakouts and intraday range expansion strategies tend to perform better.
Color Coding System
Direction & Session Rows:
Green text: Bullish combinations (Long True or Short False)
Red text: Bearish combinations (Short True or Long False)
Gray text: N/A or incomplete sessions
Market Type:
Green "TRENDING": Bullish trending day
Red "TRENDING": Bearish trending day
Orange "CONTRADICTING": Contradicting market conditions
Settings & Customization
Table Display:
Position: 9 placement options
Size: Tiny, Small, Normal, or Large
Fixed Range Boxes:
Toggle boxes on/off
Customize box background color and transparency
Boxes automatically appear only during fixed session periods
Unique Features
First-Break Direction: Unlike typical range breakout indicators, this uses the FIRST break to establish directional bias, not the final direction
Dual Session Analysis: Combines both Asia and London sessions for comprehensive overnight market characterization
Validity Framework: The True/False session concept quantifies overnight conviction levels
Visual Range Display: Fixed range boxes show exactly what levels the indicator is monitoring
Daily Reset: Automatically resets at 18:00 EST for the new trading day
Best Practices
Instrument: Designed for NQ (NASDAQ 100 E-mini futures)
Timeframe: Works best on 15-minute charts or lower
Timing: Check the classification before RTH open (09:30 EST)
Integration: Use as a market filter with your existing trading methodology
Strategy: TRENDING days favor overnight high/low holding; CONTRADICTING days favor intraday breakouts
Development Note
This indicator is the result of extensive backtesting on 15+ years of NQ data. The specific time windows and classification combinations have been optimized through historical analysis revealing that markets split nearly 50/50 between Trending (48.92%) and Contradicting (51.08%) conditions, with distinct performance characteristics for each market type.

Daily Candle by NatantiaIntroduction to the Daily Candle Indicator
The Daily Candle Indicator is a powerful and customizable tool designed for traders to visualize daily price action on any chart timeframe.
This Pine Script (version 5) indicator, built for platforms like TradingView, overlays a single candle representing the day's open, high, low, and close prices, with options to adjust its appearance and session focus.
Key Features:
Customizable Appearance: Users can set the colors for bullish (default green) and bearish (default white) candles, as well as the wick color (default white). The horizontal offset and candle thickness can also be adjusted to fit the chart layout.
Dynamic Updates: The candle updates on the last bar, with wicks drawn to reflect the daily high and low, providing a clear snapshot of the day's price movement.
This is the same version as before, but we had to republish it because the chart contained other indicators, which violated the publication rules. We apologize for the inconvenience.
Have a nice trades!
-Natantia

BS by bigmmBS by bigmm is a powerful tool designed to track and display cumulative trading volumes for bullish (green) and bearish (red) bars over a user-defined period. This indicator provides valuable insights into market sentiment by quantifying buying and selling pressure through volume analysis.
Adjustable lookback period from 20 to 10,000 bars
Default setting of 500 bars for balanced analysis
Real-time calculation updates on each new bar
BUY Volume: Total volume of green bars (close > open)
SELL Volume: Total volume of red bars (close < open)
Interpretation:
Higher BUY Volume: Indicates stronger buying pressure
Higher SELL Volume: Suggests stronger selling pressure
Balanced Volumes: Shows equilibrium between buyers and sellers
Ideal For:
Swing traders analyzing medium-term trends
Position traders evaluating long-term market sentiment
Volume-based trading strategies
Market structure analysis

NHEST Liquidity Ultra Minimal (Short Labels)
NHEST Liquidity Ultra Minimal is a clean, lightweight, and distraction-free liquidity mapping tool designed for traders who want institutional-grade clarity without chart noise.
It highlights only the most important liquidity zones — nothing extra, nothing cluttered — giving you a pure view of where price is most likely to react, reverse, or sweep.
✔ Ultra-Minimal Design
This indicator removes all unnecessary visuals and focuses solely on key liquidity levels derived from price structure. No boxes, no labels, no shading overload — just the critical price zones that matter.
✔ Smart Liquidity Levels
NHEST Liquidity Ultra Minimal automatically detects major liquidity pools such as:
• Buy-side liquidity (BSL) above price
• Sell-side liquidity (SSL) below price
• Primary and secondary liquidity shelves
These levels help traders anticipate where smart money may target next.
✔ Higher-Timeframe Stability
Built to work cleanly across all timeframes, from scalping to swing trading. Liquidity zones update smoothly and remain stable even during high-volatility conditions.
✔ Perfect for Smart Money Concepts (SMC)
This indicator is ideal for traders who follow:
• ICT concepts
• Liquidity hunts
• Market structure
• Breakers & mitigation blocks
• Sweep-into-imbalance setups
✔ No Lag — No Repaints
All levels are calculated in real-time using non-repainting logic.
✔ Clean Visuals for Any Style
Whether you’re using a dark chart or a white chart, NHEST Liquidity Ultra Minimal keeps your workspace clean, organized, and easy to read — perfect for professional analysis, live streaming, and trading education content.
⸻
How to Use
1. Identify zones above price (BSL) as potential liquidity targets for bullish expansions.
2. Identify zones below price (SSL) as downside liquidity targets for bearish expansions.
3. Expect price to gravitate toward the nearest liquidity pool during consolidation.
4. Use the levels to anticipate sweeps, reversals, or continuation moves.
⸻
Best For
• Smart money traders
• Gold (XAUUSD) traders
• Crypto, Forex, Indices
• Scalpers & intraday traders
• Price-action purists
• Traders who want a clean chart
⸻
Disclaimer
This script is for educational purposes only and is not financial advice.
Always use proper risk management.
By NHEST TRADING LLC

ICS🏛️ Institutional Confluence Suite (ICS) Indicator
The Institutional Confluence Suite is a powerful and highly customizable TradingView indicator built to help traders identify key institutional trading concepts across multiple timeframes. It visualizes essential market components like Market Structures (MS), Order Blocks (OB)/Breaker Blocks (BB), Liquidity Zones, and Volume Profile, providing a confluence of institutional price action data.
📈 Key Features & Components
1. Market Structures (MS)
Purpose: Automatically identifies and labels shifts in market trends (Market Structure Shift, MSS) and continuations (Break of Structure, BOS).
Timeframe Detection: You can select detection across Short Term, Intermediate Term, or Long Term swings to match your trading horizon.
Visualization: Plots colored lines (Bullish: Teal, Bearish: Red) to mark the structures and optional text labels (BOS/MSS) for clear identification.
2. Order & Breaker Blocks (OB/BB)
Purpose: Detects and projects potential Supply and Demand zones based on recent price action that led to a swing high or low.
Block Types: Distinguishes between standard Order Blocks and Breaker Blocks (OBs that fail to hold and are traded through, often serving as support/resistance in the opposite direction).
Customization:
Detection Term: Adjusts sensitivity (Short, Intermediate, Long Term).
Display Limit: Sets the maximum number of recent Bullish and Bearish blocks to display.
Price Reference: Option to use the Candle Body (Open/Close) or Candle Wicks (High/Low) to define the block boundaries.
Visualization: Displays blocks as colored boxes (Bullish: Green, Bearish: Red) extending into the future, with a dotted line marking the 50% equilibrium level. Breaker Blocks are indicated by a change in color/line style upon being broken.
3. Buyside & Sellside Liquidity (BSL/SSL)
Purpose: Highlights areas where retail stops/limit orders are likely clustered, often represented by a series of relatively equal highs (Buyside Liquidity) or lows (Sellside Liquidity).
Detection Term: Adjustable sensitivity (Short, Intermediate, Long Term).
Margin: Uses a margin (derived from ATR) to group similar swing points into a single liquidity zone.
Visualization: Plots a line and text label marking the swing point, and a box indicating the clustered liquidity zone.
4. Liquidity Voids (LV) / Fair Value Gaps (FVG)
Purpose: Identifies areas where price moved sharply and inefficiency was created, often referred to as Fair Value Gaps or Imbalances. These are price ranges where minimal trading volume occurred.
Threshold: Uses a multiplier applied to the 200-period ATR to filter for significant gaps.
Mode: Can be set to Present (only show voids near the current price) or Historical (show all detected voids).
Visualization: Fills the price gap with colored boxes (Bullish/Bearish zones), often segmented to represent the price delivery across the gap.
5. Enhanced Liquidity Detection
Purpose: A complementary feature that uses volume and price action to highlight areas of high liquidity turnover, potentially indicating stronger Support and Resistance zones.
Calculation: Utilizes a volume-weighted approach to color-grade liquidity zones based on their significance.
Visualization: Plots shaded boxes (gradient-colored) around swing highs/lows, with text displaying the normalized volume strength.
6. Swing Highs/Lows
Purpose: Directly marks the price points identified as Swing Highs and Swing Lows based on the lookback periods.
Timeframe Detection: Can be enabled for Short Term, Intermediate Term, or Long Term swings.
Visualization: Plots a small colored dot/label (e.g., "⦁") at the swing point.
This indicator is an invaluable tool for traders employing ICT (Inner Circle Trader), Smart Money Concepts (SMC), or general price action strategies, as it automatically aggregates and displays these critical structural and liquidity elements.

Expsoure Guide by Tradewith_GaryDaily Guide for exposure building. Use this Indicator to improve your profitability by avoiding over-trading and picking the best days to initiate new trades. Valid only for swing trading format.

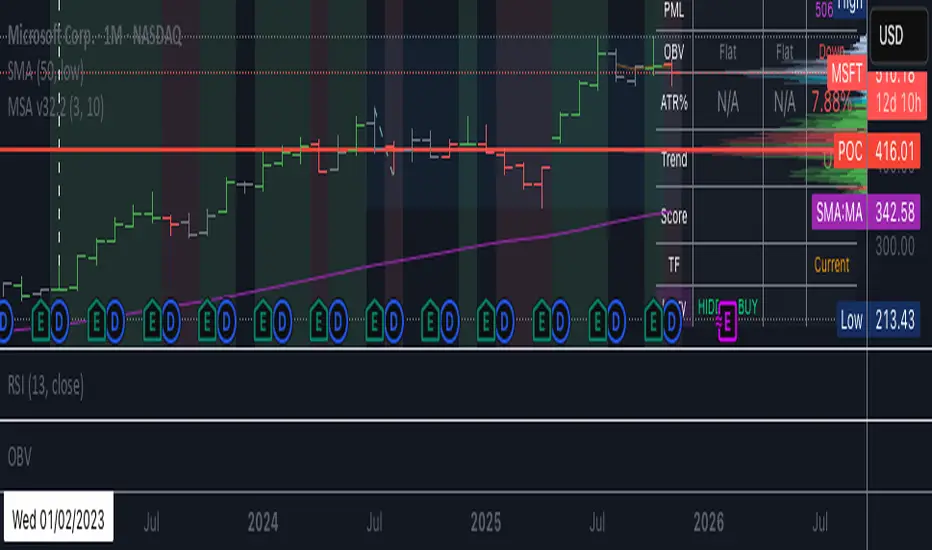
BC_Monthly Strength Armor [xAI] - v32.2 MTF LOCKED + SCORE FIXED🛡️ **Monthly Strength Armor - v32.2**
**Multi-Timeframe Institutional Edge Indicator**
🔥 **Detects smart money moves** using:
- **Monthly Range Position (Score 0–100)**
- **Higher High/Low Trend Structure (Daily/Weekly/Monthly)**
- **OBV Trend Lock (100% consistent)**
- **Larry Williams OHLC Institutional Patterns (Daily)**
📊 **MTF Table (locked values — no flicker)**
| Daily | Weekly | Monthly |
|-------|--------|---------|
| OBV | Trend | Score |
| ATR% | Larry | PMH/PML |
🎯 **Confluence Alerts**
- **3-TF Bullish / Bearish**
- **ULTRA BUY/SELL** (all TFs aligned)
- **Larry Institutional Buying/Selling**
✅ **No repaint | No warnings | Live-ready**
Built for **NVDA, MSFT, URA, QQQ, SPY**
*By @TedPrime x Grok @ xAI*
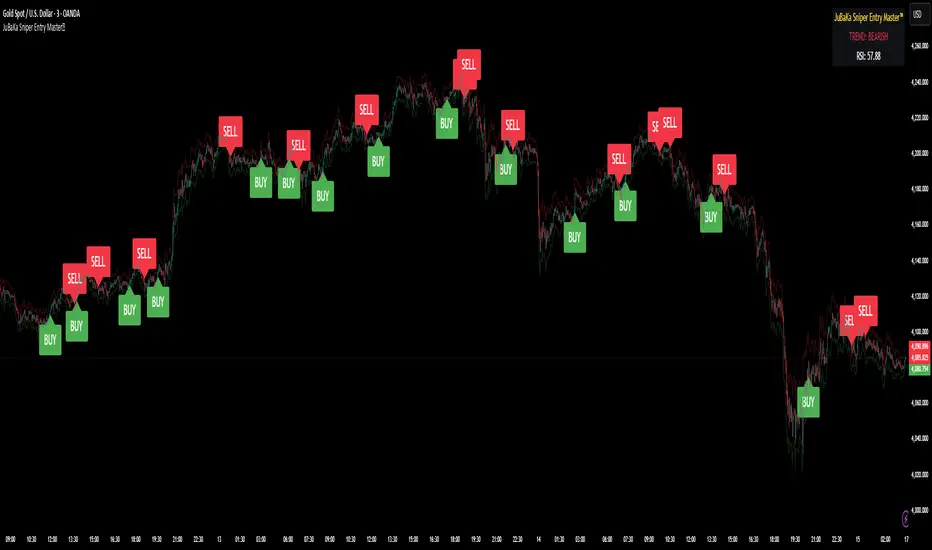
JuBaKa Sniper Entry Master™JuBaKa Sniper Entry Master™ — Premium High-Precision Scalping System
JuBaKa Sniper Entry Master™ is a professional-grade scalping indicator engineered specifically for XAUUSD, NAS100, US30, GER30, and BTC.
It combines trend structure, momentum pressure, RSI confirmation, and non-repainting crossover logic to produce extremely precise sniper entries.
Designed with fixed internal parameters, this invite-only indicator provides a clean, simplified, black-box experience with no inputs — just powerful entries and dynamic stop guidance.
🔥 KEY FEATURES
✓ Sniper Entry Engine
Signals only appear when all conditions align:
• Trend direction
• Momentum pressure
• RSI confirmation
• Non-repainting cross structure
✓ Ultra-Clean Scalping Signals
Perfect for 1m, 3m, 5m, and 15m timeframes.
✓ Fixed Internal Settings (Locked Version)
No inputs to tweak — removes confusion and keeps behavior consistent.
✓ ATR Adaptive Stoploss Line
Automatically adjusts to volatility; perfect for scalpers.
✓ Trend Ribbon
Green = Bullish
Red = Bearish
✓ Alert Ready
BUY and SELL alerts for automation, webhook bots, and mobile trading.
⭐ BEST FOR
✔ Gold (XAUUSD) Scalping
✔ NAS100 / US30 Fast Indices
✔ High-volatility markets
✔ Traders who want early entries
✔ Traders who prefer simple, execution-ready signals
✔ Anyone needing a non-repainting scalping tool
🚀 ACCESS INSTRUCTIONS
This is a premium invite-only indicator.
To gain access:
Complete payment on the official page
Send your TradingView username via Mail
Access will be granted within minutes
The indicator will appear under:
Indicators → Invite-Only Scripts → JuBaKa Sniper Entry Master™
Support (Payments / Access):
Mail: jubaka.com@gmail.com
🏆 JuBaKa Sniper Entry Master™
Precision. Speed. Profitable Entries.
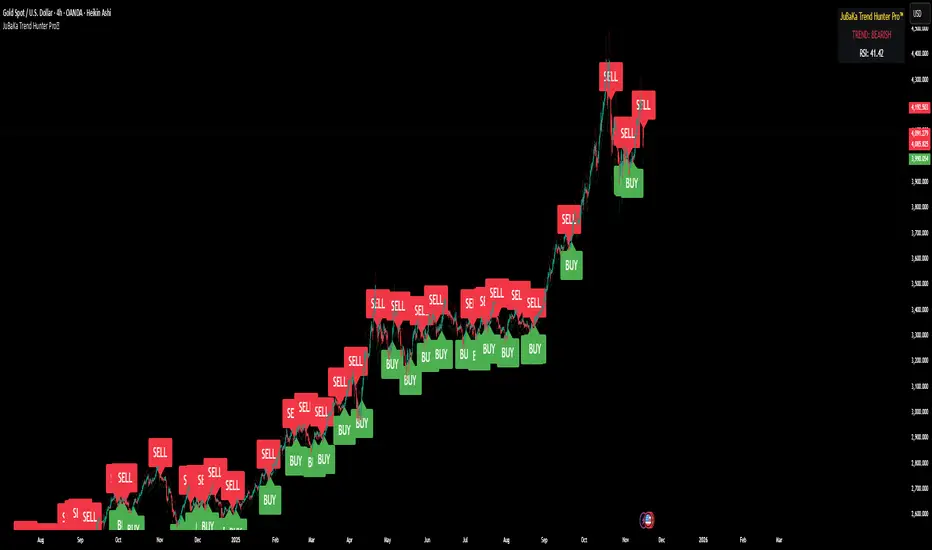
JuBaKa Trend Hunter Pro™ ⭐ JuBaKa Trend Hunter Pro™ — Premium Invite-Only Indicator**
(Fixed Settings • No Inputs • Zero Noise • High Precision Signals)
JuBaKa Trend Hunter Pro™ is a premium, professional-grade trend detection system designed to give traders maximum clarity with minimum noise.
This invite-only indicator combines multi-timeframe trend confirmation, RSI-based pressure logic, ATR volatility adaptation, and advanced crossover analysis to deliver powerful BUY/SELL signals that are simple to follow and non-repainting.
This is a locked, black-box algorithm with fixed internal parameters designed for consistent performance.
No user inputs = no confusion.
Just pure signals and trend clarity.
🔥 KEY FEATURES
✓ Premium Trend Detection Engine
Smart dual-EMA engine with volatility & momentum merging to identify true trend direction.
✓ Higher-Timeframe Confirmation
Automatically checks alignment from a higher timeframe to avoid false breakouts and whipsaws.
✓ Smart Buy/Sell Signals
Signals only appear when: Trend aligns
No repainting.
✓ ATR-Based Dynamic Stop Levels
Adaptive stoploss levels plotted automatically to help traders manage risk during volatility expansions.
✓ Trend Ribbon
Chart candles color-coded for immediate visual direction.
• Green = Bullish
• Red = Bearish
• Neutral = Low-signal zones
✓ Clean Dashboard Panel
Simple 3-line dashboard shows:
• System status
• Bullish/Bearish/Neutral
• Current RSI value
Designed for fast decision-making.
✓ Alert System Ready
BUY/SELL alerts for:
• Popup
• Email
• Webhook
• Mobile notifications
Perfect for automation.
⭐ WHO IS THIS INDICATOR FOR?
This system is ideal for:
✔ XAUUSD traders
✔ Index traders (NAS100, US30, GER30)
✔ Forex & Crypto
✔ Scalpers
✔ Intraday traders
✔ Swing traders
✔ Traders who prefer clean and simple direction
✔ Users who don’t want to adjust any settings
If you want a “plug-and-trade” system that gives you clear signals without tweaking inputs, this is for you.
🚀 HOW TO ACCESS
This is a **premium invite-only script**.
To get access:
1. Make payment on the official page
2. Send your TradingView username
3. You will be added to the access list
4. Indicator appears automatically in:
Indicators → Invite-Only Scripts → JuBaKa Trend Hunter Pro™
Access is usually granted within minutes.
Contact:
(jubaka.com@gmail.com)
❗ NOTE
This indicator is protected.
• No inputs
• No editable parameters
• Invite-only access
• Redistribution not allowed
Updates and improvements are included for all active users.
🏆 JuBaKa Trend Hunter Pro™
Precision Meets Profit.
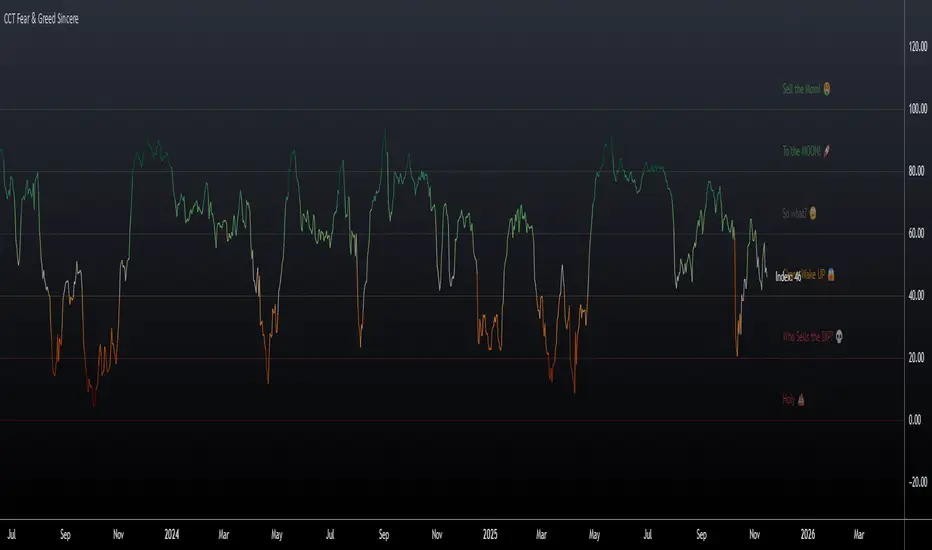
CCT Fear & Greed Sincere📄 CCT Fear & Greed Sincere — Technical Overview
The CCT Fear & Greed Sincere indicator provides a consolidated view of macro-market conditions using exclusively price-derived and market-structure data. The goal is to translate multiple independent risk-appetite components into a unified 0–100 index. This tool does not rely on survey sentiment, alternative datasets, or social indicators; it uses only verifiable, market-observable inputs.
All components are normalized into a comparable scale and combined into a composite metric representing broad risk-seeking or risk-averse behaviour in global markets. While applicable to any instrument on TradingView, the indicator is particularly effective for cryptocurrency markets due to their historical sensitivity to equity volatility, liquidity cycles, and macroeconomic shifts.
📊 Components Included in the Index
Below is an overview of the internal factors used to compute the final score. Each item is independently transformed into a 0–100 range before aggregation.
1. S&P 500 Price Deviation (SPX 125-Day Distance)
Measures how far the S&P 500 is trading above or below its 125-day moving average.
Large positive deviations generally reflect elevated risk-taking, while negative deviations suggest conservative market posture.
2. 52-Week Range Position (NYSE Composite)
Evaluates the NYSE Composite’s distance from its annual high/low range.
A higher relative position indicates greater market confidence, whereas lower values capture prolonged weakness or systemic stress.
3. Advance/Decline Momentum (ADVN vs. DECN)
Applies smoothing to the net difference between advancing and declining issues.
This highlights internal market participation, breadth conditions, and the balance between accumulation and distribution phases.
4. Put/Call Ratio Pressure (PCC)
Uses a smoothed version of the equity put/call ratio.
A higher put/call ratio (inverted here) reflects risk aversion, while lower ratios align with speculative environments.
5. VIX Relative Position (VIX vs. 50-Day Average)
Compares the current VIX value to its 50-day moving average.
VIX above its mean implies elevated volatility and fear; values below suggest calmer conditions and stronger risk appetite.
6. Equity vs. Treasury Performance (SPX vs. US10Y)
Contrasts 20-day returns of equities and U.S. 10-year bonds.
Strong equity performance relative to treasuries is normally associated with risk-on flows, while the opposite reflects defensive positioning.
7. High-Yield Spread (JNK vs. US10Y)
Tracks the yield differential between high-yield bonds and U.S. Treasury rates.
A wider spread captures stress in credit markets; a narrower spread indicates improved confidence.
🧮 Composite Calculation
The indicator computes each component independently, normalizes the values into a 0–100 scale using a consistent methodology, and then calculates the simple average.
This ensures transparency and avoids hidden weighting schemes or model bias.
The final index is plotted as a continuous line with adaptive coloring based on its current level, visually highlighting shifts between fear-dominant and greed-dominant market states.
📈 Suggested Usage
The indicator can be applied to any tradable asset, but it tends to be especially informative for:
Cryptocurrencies, due to their pronounced reaction to global liquidity and risk sentiment.
High-beta stocks, which often mirror broader volatility cycles.
Macro-focused analysis, where risk-on/risk-off transitions impact multiple asset classes simultaneously.
This tool is intended as a contextual framework rather than a standalone signal generator. Market participants may use it to contextualize regime changes, identify extremes, or complement existing technical strategies.
📏 Fear & Greed Levels Included in the Indicator
These levels are plotted with dedicated labels and tooltips to offer additional visual clarity:
Level Interpretation
0 – “Holy 💩” Extreme market stress; structural capitulation environment.
20 – “Who Sells the DIP?” Strong fear signal; frequently aligns with oversold conditions.
40 – “C’mon Wake UP!” Cautious or bearish environment; transitional zone.
60 – “So What?” Neutral risk environment; consolidation or equilibrium.
80 – “To the MOON!” Elevated risk appetite; momentum-driven phases.
100 – “Sell the MOM!” Peak optimism; historically associated with overheated conditions.
These thresholds do not provide direct buy/sell instructions; they are reference bands designed to help illustrate the structural context of market behavior.
📌 Why This Indicator Is Uniquely Updated
Uses 7 fully technical components
Zero survey sentiment
Zero social media data
Zero alternative datasets or search trend metrics
Fully transparent, fully reproducible, and based only on market-derived inputs
Built on Pine Script® v6, aligned with modern TradingView standards
Does not rely on proprietary or black-box scoring systems
This positions the CCT Fear & Greed Sincere as one of the most technically grounded and transparent fear/greed-style indicators available using only TradingView-native data.
Long-term Reversal Signals [OI + CVD + Volume]Open Interest, CVD, Volume Delta 등을 활용해서 장기적 반전 구간을 측정하는 시그널 지표입니다.
It uses Open Interest, CVD, Volume Delta Indicators.
This is an indicator that quantitatively creates conditions and specifies them by comprehensively utilizing the characteristics of each data and combining them with the characteristics of the area where prices are reversed.
Thank you!
BC_Monthly Strength ArmorV0001Monthly Strength Armor – Institutional-Grade Monthly Structure & Real-Time Momentum
A non-repainting, multi-timeframe indicator that delivers clean, professional-grade monthly levels and real-time strength analysis — from 1-minute to monthly charts.
Core Features
PMH / PML Rays
True Previous Month High & Low, drawn once per month from the first trading day, extending infinitely right. Glued to price — survives scroll, zoom, and timeframe changes.
RVOL (Relative Volume)
Current month volume vs. average of prior months.
>1.5 → Orange (high conviction)
<1.0 → Gray (stealth mode)
ATR%
Monthly volatility as % of price.
>3% → Red (explosive)
<1.5% → Gray (consolidation)
Strength Score (0–100)
Combines:
Price position in monthly range (40%)
Trend state (HH/HL or LL/LH) (30%)
RVOL (30%)
→ ≥70 = Bullish Armor | ≤30 = Bearish Armor
Bar Coloring & Background Tint
Instant visual bias: Green (bullish), Red (bearish), Gray (neutral).
Proximity Triangles
▲ near PMH | ▼ near PML → breakout/bounce alerts.
Right-Edge Labels
Clean, stacked display: PMH, PML, RVOL, ATR%, Score — always visible.


DAO - Demand Advanced Oscillator# DAO - Demand Advanced Oscillator
## 📊 Overview
DAO (Demand Advanced Oscillator) is a powerful momentum oscillator that measures buying and selling pressure by analyzing consecutive high-low relationships. It helps identify market extremes, divergences, and potential trend reversals.
**Values range from 0 to 1:**
- **Above 0.70** = Overbought (potential reversal down)
- **Below 0.30** = Oversold (potential reversal up)
- **0.30 - 0.70** = Neutral zone
---
## ✨ Key Features
✅ **Automatic Divergence Detection**
- Bullish divergences (price lower low + DAO higher low)
- Bearish divergences (price higher high + DAO lower high)
- Visual lines connecting divergence points
✅ **Multi-Timeframe Analysis**
- View higher timeframe DAO on current chart
- Perfect for trend alignment strategies
✅ **Signal Line (EMA)**
- Customizable EMA for trend confirmation
- Crossover signals for momentum shifts
✅ **Real-Time Statistics Dashboard**
- Current DAO value
- Market status (Overbought/Oversold/Neutral)
- Trend direction indicator
✅ **Complete Alert System**
- Overbought/Oversold signals
- Bullish/Bearish divergences
- Signal line crosses
- Level crosses
✅ **Fully Customizable**
- Adjustable periods and levels
- Customizable colors and zones
- Toggle features on/off
---
## 📈 Trading Signals
### 1. Divergences (Most Powerful)
**Bullish Divergence:**
- Price makes lower low
- DAO makes higher low
- Signal: Strong reversal up likely
**Bearish Divergence:**
- Price makes higher high
- DAO makes lower high
- Signal: Strong reversal down likely
### 2. Overbought/Oversold
**Overbought (>0.70):**
- Market may be overextended
- Consider taking profits or looking for shorts
- Can remain overbought in strong trends
**Oversold (<0.30):**
- Market may be oversold
- Consider buying opportunities
- Can remain oversold in strong downtrends
### 3. Signal Line Crossovers
**Bullish Cross:**
- DAO crosses above signal line
- Momentum turning positive
**Bearish Cross:**
- DAO crosses below signal line
- Momentum turning negative
### 4. Level Crosses
**Cross Above 0.30:** Exiting oversold zone (potential uptrend)
**Cross Below 0.70:** Exiting overbought zone (potential downtrend)
---
## ⚙️ Default Settings
📊 Oscillator Period: 14
Number of bars for calculation
📈 Signal Line Period: 9
EMA period for signal line
🔴 Overbought Level: 0.70
Upper threshold
🟢 Oversold Level: 0.30
Lower threshold
🎯 Divergence Detection: ON
Auto divergence identification
⏰ Multi-Timeframe: OFF
Higher TF overlay (optional)
All parameters are fully customizable!
---
## 🔔 Alerts
Six pre-configured alerts available:
1. DAO Overbought
2. DAO Oversold
3. DAO Bullish Divergence
4. DAO Bearish Divergence
5. DAO Signal Cross Up
6. DAO Signal Cross Down
**Setup:** Right-click indicator → Add Alert → Choose condition
---
## 💡 How to Use
### Best Practices:
✅ Focus on divergences (strongest signals)
✅ Combine with support/resistance levels
✅ Use multiple timeframes for confirmation
✅ Wait for price action confirmation
✅ Practice proper risk management
### Avoid:
❌ Trading on indicator alone
❌ Fighting strong trends
❌ Ignoring market context
❌ Overtrading
### Recommended Settings by Trading Style:
**Day Trading:** Period 7-10, All alerts ON
**Swing Trading:** Period 14-21, Divergence alerts
**Scalping:** Period 5-7, Signal crosses
**Position Trading:** Period 21-30, Weekly/Daily TF
---
## 🌍 Markets & Timeframes
**Works on all markets:**
- Forex (all pairs)
- Stocks (all exchanges)
- Cryptocurrencies
- Commodities
- Indices
- Futures
**Works on all timeframes:** 1m to Monthly
---
## 📊 How It Works
DAO calculates the ratio of buying pressure to total market pressure:
1. **Calculate Buying Pressure (DemandMax):**
- If current high > previous high: DemandMax = difference
- Otherwise: DemandMax = 0
2. **Calculate Selling Pressure (DemandMin):**
- If previous low > current low: DemandMin = difference
- Otherwise: DemandMin = 0
3. **Apply Smoothing:**
- Calculate SMA of DemandMax over N periods
- Calculate SMA of DemandMin over N periods
4. **Final Formula:**
```
DAO = SMA(DemandMax) / (SMA(DemandMax) + SMA(DemandMin))
```
This produces a normalized value (0-1) representing market demand strength.
---
## 🎯 Trading Strategies
### Strategy 1: Divergence Trading
- Wait for divergence label
- Confirm at support/resistance
- Enter on confirming candle
- Stop loss beyond recent swing
- Target: opposite level or 0.50
### Strategy 2: Overbought/Oversold
- Best for ranging markets
- Wait for extreme readings
- Enter on reversal from extremes
- Target: middle line (0.50)
### Strategy 3: Trend Following
- Identify trend direction first
- Use DAO to time entries in trend direction only
- Enter on pullbacks to oversold (uptrend) or overbought (downtrend)
- Trade with the trend
### Strategy 4: Multi-Timeframe
- Enable MTF feature
- Trade only when both timeframes align
- Higher TF = trend direction
- Lower TF = precise entry
---
## 📂 Category
**Primary:** Oscillators
**Secondary:** Statistics, Volatility, Momentum
---
## 🏷️ Tags
dao, oscillator, momentum, overbought-oversold, divergence, reversal, demand-indicator, price-exhaustion, statistics, volatility, forex, stocks, crypto, multi-timeframe, technical-analysis
---
## ⚠️ Disclaimer
**This indicator is for educational purposes only.** It does not constitute financial advice. Trading involves substantial risk of loss. Always conduct your own research, use proper risk management, and consult with financial professionals before making trading decisions. Past performance does not guarantee future results.
---
## 📄 License
Open source - Free to use for personal trading, modify as needed, and share with attribution.
---
**Version:** 1.0
**Status:** Production Ready ✅
**Pine Script:** v5
**Trademark-Free:** 100% Safe to Publish
---
*Made with 💙 for traders worldwide*

Asset vs Total Market Cap & Relative Strength Purpose
This indicator allows traders to compare a selected asset to the major market benchmarks:
BTC – primary crypto market leader
ETH – secondary crypto market leader
USDT.D – shows market risk-on vs risk-off sentiment
TOTAL – total crypto market capitalization, useful for overall market trends
It also provides relative strength calculations:
Rel. Strength = Asset % change - USDT.D % change
Rel. Strength vs Total = Asset % change - Total % change
This allows you to see if your asset is outperforming or underperforming broader benchmarks.
The table covers multiple timeframes, making it easy to scan both short-term and longer-term trends:
Row Timeframe
0 Current
1 15m
2 1H
3 4H
4 1D
Selected Asset / BTC / ETH:
Green for positive % change
Red for negative % change
Gradient intensity proportional to magnitude (maxAbsChange input)
USDT.D:
Orange if rising (risk-off)
Teal if falling (risk-on)
Total Market Cap / Rel. Strength:
Gradient reflects asset performance relative to total market, independent of USDT.D.
Positives
Compact dashboard: Everything is in one table for quick scanning.
Multi-timeframe comparison: Traders can instantly see short-term vs long-term strength.
Relative performance visualization: Gradients immediately highlight outperformers and underperformers.
Benchmark comparisons: Asset vs BTC, ETH, USDT.D, and Total Market Cap.
Independent Rel. Strength: Highlights whether the asset is outperforming even if the total market moves.
Customizable gradient sensitivity: maxAbsChange and maxRelChange allow tuning how “strong” the colors appear.
Chart plotting: Rel. Strength vs total market is plotted for further visual reference.
How to Use
Green table cells → strong positive movement
Red table cells → negative movement
Rel. Strength > 0 → asset outperforming
Rel. Strength < 0 → asset underperforming
Use table to compare relative performance vs BTC, ETH, and total market for informed trading decisions.

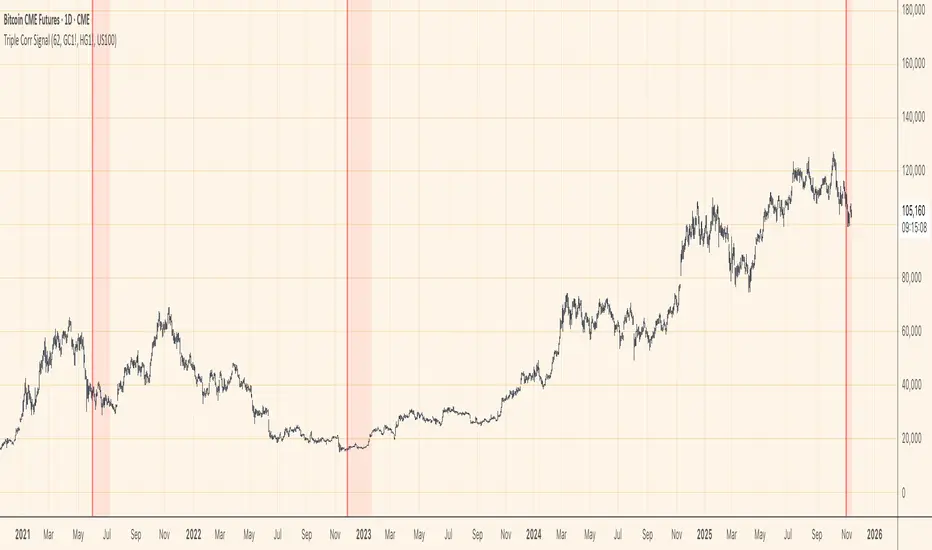
Triple Correlation Signal by COCOSTATriple Correlation Signal by COCOSTA
Concept
Bitcoin experiences violent swings driven by large liquidations and panic selling. During these chaotic market events, Bitcoin often decouples from its usual correlation patterns with traditional assets like gold, copper, and equity indices.
This indicator identifies these critical moments when an asset simultaneously loses correlation with three major reference assets—a phenomenon that typically signals oversold conditions and extreme market dislocations .
How It Works
The Triple Correlation Signal monitors the correlation coefficient between your primary asset and three customizable assets. Simply apply it to any chart—the signals will trigger based on that asset's correlation behavior.
Default Setup: Bitcoin (BTC1!)
Gold (GC1!) - Safe-haven asset correlation
Copper (HG1!) - Industrial/economic growth correlation
NASDAQ-100 (US100) - Technology/equity market correlation
When all three correlations fall below zero simultaneously , the indicator triggers a signal. This rare multi-asset decorrelation event suggests that the asset has decoupled far beyond normal trading ranges—often indicating extreme selling pressure that has pushed prices to unreasonable levels .
Signal Visualization
The indicator displays signals as vertical lines that span the full chart height when all three correlations drop below zero. A semi-transparent red background also highlights periods when the signal condition is active. This neutral visual representation avoids implying a specific directional bias.
Universal Application
This indicator works on any ticker or asset class . Simply change the chart to your desired asset and adjust the three correlation symbols to match different market combinations:
Stocks: Compare against sector indices, VIX, and bond futures
Commodities: Compare against currencies, equity indices, and related commodities
Forex: Compare against central bank proxies, commodity indices, and equity markets
Why Use BTC1! (CME Bitcoin Futures)
For Bitcoin specifically, use BTC1! (CME Bitcoin Futures) rather than spot BTCUSD. Since traditional assets like gold (GC1!) and copper (HG1!) trade on CME with market hours, using BTC1! ensures synchronized trading sessions and accurate correlation measurements . The 24/7 spot market can create timing mismatches that distort correlation readings.
Trading Application
Signal triggers = Potential capitulation events and oversold extremes
Best used with other confirmation indicators (support levels, RSI, volume analysis)
Customizable correlation length (default: 62 bars) and asset symbols to match any strategy
Finding Your Edge
Experiment with different asset combinations for your trading interest. If you discover particularly effective correlation combinations—especially for underexplored assets—feel free to reach out. Your insights help COCOSTA continuously improve market analysis tools.
Key Insight
When massive liquidations force panic selling, assets temporarily break their normal relationships with other markets. The Triple Correlation Signal catches these precise moments—your edge in identifying when any asset has been sold below reasonable value.
Created by COCOSTA | Advanced Market Analysis Tools
Consolidation Value Zones (Recio)Consolidation Value Zones introduces an original algorithm to identify consolidation ranges and locate areas of importance within them. This new method "looks" at the chart and draws zones based on price with the goal of producing actionable zones which appear natural, as if they were found through a human analysis.
> Consider the following...
The chart image above displays Bitcoin, at no specific date, for no specific reason. What I have done here is simply glanced at the chart for about 5 seconds, and circled a few areas which stood out as "obvious" consolidation. It does not take a savant to look at a chart and circle ranging price. However, what we have just done defies many common systems for identifying consolidation. We have located ranges of various zone lengths, as small as roughly 25 bars to as large as roughly 100 bars. Regardless of this, we still determined these zones with our eyes and brain in a few seconds, for some it's practically instant. The issue with us humans doing this, is that we are subjective. We did not really use any concrete rules to determine these areas with our eyes. So the problem becomes "How do we identify these zones in a way which seems natural to us with a repeatable system?" Because of this, my approach is simply a logical attempt to reverse engineer our human intuition.
> Consolidation Value Zones
The name of this indicator is generic. To dissect it, we are identifying consolidation ranges, then using a volume profile to determine the value zone within that range. The specific method used to identify these consolidation zones is something I've personally been referring to as the "skewer" method. Another name that may fit better is "Linear Range Alignment/Overlap".
Ultimately, the goal is to locate a single price level or range that overlaps many adjacent bars.
This should, in theory, return areas of visually obvious consolidation.
> The Skewer Method (Identification Method & Bar Gap Allowances)
One consistent concept across the different identification methods for determining consolidation is time. How long do we chop around before calling it consolidation? This is the "Identification Threshold". Once we have located a consolidation zone "this" wide, we will then consider it as consolidation.
In the chart image above, we are considering a six-bar consolidation formation. The figure on the left shows an example of a perfect raw bar overlap, we can see that the six bars all overlap at one price range. This is a perfect example of what we are looking to identify as consolidation. Unfortunately, if this was all we looked at, we would have a very scarce identification method.
For that reason, we have the example on the right, which shows the additional allowances for the identification of these ranges. At most, the example on the right shows a gapless three-bar overlap. However, if we allow the identification to bridge across the gaps, we are able to draw a zone directly through the center and still be within our parameters. This allowance is the "Bar Gap Allowance" and will determine the leniency of the identification.
Between our identification threshold and bar gap allowance, we can start to piece together how the script is "looking" at our chart.
> Detecting Consolidation (Live Detection)
To aid in transparency and user understanding, the live detection calculation can be seen on the chart as a box, skewering the recent historical bars with a number next to it, indicating the number of bars found as potential consolidation.
As we can see in the chart image above, the script, by default, is looking for a 15-bar consolidation, with a 5-bar gap allowance. In the image, the specific gap count is labeled, we can see the script scan backwards as far as it can before counting five gaps in the data. Once that occurs, the detection stops.
Notice how the zone found is a range, consisting of all price levels which meet the parameters. The lower level of the range only had two gaps, but the upper level reached five.
> Consolidation Range and Value Zones (Volume Profiles)
Once the script has identified the consolidation formation, it calculates a volume profile across the identified consolidation range. From this it calculates and draws the Point of Control (POC) and Value Area in addition to the full consolidation range.
Once we have our zones drawn, and understand what they identify, we can go one step further and apply concepts from volume profile trading.
Range High/Low: Displays the current extent of the identified consolidation.
Value High/Low: Shows the specific area within the consolidation where buyers and sellers found the most value.
POC: The single point, where the most volume was transacted during consolidation.
In a balanced market, we would anticipate price to rotate around POC, oscillating from Value High (VAH) to Value Low (VAL). In contrast, a market in motion moves directionally, building volume at new price levels as value, naturally the POC shifts with it.
> Zone Extensions
Unlike many other scripts, there is no mitigation logic at play here, since crossing a zone simply tells us "buyers and sellers are not currently active here", but it does not guarantee that value cannot return or react from previous areas of value.
Obviously the current zone will always be most relevant, but historical zones can retain relevance depending on the context of the market.
Remember: Each area of consolidation is an area where buyers and sellers were once facing off, resulting in price's consolidation. Amidst this, the value zone was the area of greatest agreement between the participants at that time. When moving outside of a range, we would typically look at historical value areas and price's interaction with them for further context.
Due to the ever changing market, there is no fixed extension lookback that will cover every scenario. By default, the Extension Lookback is "1", meaning the script will extend the most recent zone forward until a new zone is detected.
Note: For clarity, zone extensions are colored differently from core zones.
The following chart image shows a few examples of these unique interactions.
As seen in the chart image, looking to previous areas of value as well as POC can provide context in the form of acceptance or rejection at these levels, providing further insight into the auction for us to respond to.
The zones do contain logic to maintain a clean display. By default, the zones extend conditionally when price returns to the previous consolidation range. If desired, the zones can be extended regardless of price action; this can be toggled with the option "Regardless Extension Mode", as seen below.
> Hollow Candles & Zone Merging
When consolidation is identified, a hollow candle is drawn; these can be used to see exactly when each zone is identified. It is important to understand that consolidation zones stemming from the same origin are merged into one zone. This is a frequent occurrence when the consolidation threshold is passed, but the consolidation continues. For this reason you will often see multiple hollow candles in the later areas of the zones.
Similarly, zones from different origin points that overlap are also merged into one consolidation zone. This ensures that no core zones overlap.
Additionally, every time a zone is merged, a new volume profile for the area is calculated.
> Bar Gap Allowance Type (Technical Explanation)
The specific bar gap allowance value can be altered, but so can the type of allowance being used. While some analyses may benefit from counting the total amount of bar gaps within the consolidation, others may benefit from detecting based on consecutive bar gaps.
The chart image above displays the gap counts for each gap allowance type.
The total bar gap allowance type will count until the gap amount is reached, then terminate detection once the allowed number of gaps has been exceeded.
The consecutive bar gap allowance type resets its count once it finds a valid bar within range, by doing so, it only counts the bars that separate each island of in-range bars.
Both methods have merit.
> Implementation
This identification method has proven effective to identify consolidation across market types. As a result, there cannot be one configuration of settings to fit every application. Adapting the detection type and method for each trader's specific market conditions is highly recommended.
When determining parameters, it is helpful to consider time, as it plays a major role in the identification method.
On a 1D chart, the default threshold of 15 corresponds to 15 days, or about 3 weeks depending on the ticker. To identify periods of one-week consolidation, a threshold of 5 would be suitable. To detect perfect gapless weeks, a bar gap allowance of 0 could be used, as seen in the chart image below.
Additional Example:
In the chart image above, we see a 15-second forex chart over the span of a few hours. The detection parameters are set up to detect 15-minute consolidation with a 2-minute max dead zone (consecutive bar gap).
> Detection Source
By default, the script detects consolidation ranges using the full extent of candle wicks. While this is traditional, detection can also be done using only the candle bodies. These identifications are much more nuanced, detecting only from confirmed candle price action; they do not trigger at the same frequency as wick detection.
Optionally, a "Wick/Body Average" can be chosen as the source for detection; as the name implies, this uses the average value between the candle body and its respective wick.
> Additional Settings
The settings mentioned thus far serve as core parameters for identifying consolidation. The following parameters are simply included for the benefit of the advanced user. It is not recommended to adjust these settings under normal circumstances.
- Value Area Percent: Default = 68.26, while traditionally 70 for volume profiles, 68.26 is accurate to the values of a standard bell-curve distribution. The differences are minimal in application.
- VP Rows: Default = 99, Sets the number of rows to be used when calculating the Volume Profiles (VP); note that higher values will lead to a slower calculation. Max value: 999
> Final Notes
If you have made it this far, thank you for reading.
I hope you find value in this new consolidation identification system and understand the logic behind it.
That's it.
Script a pagamento

Gold vs. Dollar Sentiment Map [SB1]🟡 Gold vs Dollar Sentiment Map
The Gold vs Dollar Sentiment Map reveals the direct inverse relationship between Gold Futures (GC) and the U.S. Dollar Index (DXY) — one of the most reliable global risk-sentiment gauges.
It helps traders instantly identify whether capital is flowing into safety (Gold) or into the Dollar (risk assets) during any session or timeframe.
🔍 Core Logic
Risk-Off (Bearish background = Red): DXY ↓ and Gold ↑ → investors seeking safety, rising fear or falling yields.
Risk-On (Bullish background = Green): DXY ↑ and Gold ↓ → investors rotating into risk assets, stronger USD demand.
Neutral (Gray): Mixed signals – no dominant macro driver.
📊 Dashboard
A compact on-chart table displays real-time trend bias for:
Gold (GC) – Bullish / Bearish / Neutral
U.S. Dollar Index (DXY) – Bullish / Bearish / Neutral
Color shading reflects each asset’s intrabar momentum.
⚙️ Visual Features
Adaptive background colors to show sentiment shifts.
Strong candle markers highlighting momentum bars near range extremes.
Alerts for clear Risk-On / Risk-Off alignment.
🧭 How to Use
Red background (Risk-Off): Gold strength + Dollar weakness → favorable environment for long gold setups.
Green background (Risk-On): Dollar strength + Gold weakness → bias toward short gold or avoid long exposure.
Gray background: Stay patient; look for confirmation or wait for alignment.
💡 Ideal For
Gold and Forex traders monitoring macro rotation.
Sentiment confirmation alongside order-flow, VWAP, or volume-delta tools.
Overlaying on intraday or higher-timeframe charts to frame trade bias.

Contango/Backwardation Monitor
This is an indicator to display the spread difference between two products. I designed it around VX1! and VX2! but any other two products can be chosen. It is a simple subtraction of VX2-VX1. I will go through the options first and what they do followed by what contango/backwardation is in my own words. You will need the data package for VX futures for the default version to work.
INPUTS
-Apply Smoothing: choose to apply smoothing or not.
-Smoothing Method: choose between SMA,EMA,WMA, etc.
-Line Width: Width of line if line is chosen style(can be changed in style section)
-Threshold 1-5: This is the level at which the line will change colors(defaults are for VX)
-Color 1-5: The color the line will change to when crossing threshold.
Towards Backwardation: Background color change when line is slanted down
Towards Contango: Background color change when line is slanted up
Bars to Confirm Trend: This is my method to cut down on background color changes. It is how many bars consecutive going back needed to change color.
STYLE
-All colors and whatnot can be changed here(threshold colors can be changed here or on the input page).
T1 Line-T5 line: These are simple horizontal lines that can be used to denote threshold areas or whatever you want.
Contango/Backwardation-These terms are used mostly with futures to define the calendar spread between two contracts. Contango is when that spread is is getting longer and backwardation is when that spread is closing. In terms of VIX futures, Contango would imply that volatility is stabilizing and the S and P will likely gain. Backwardation, woudl eb the opposite.
The most simple way to read this indicator with default settings- If the line is up, red, and the background is red, then you can assume S and P prices are going down. And if the opposite is true, then prices are likely going up.
Please feel free to ask any questions and I will do my best to answer them.

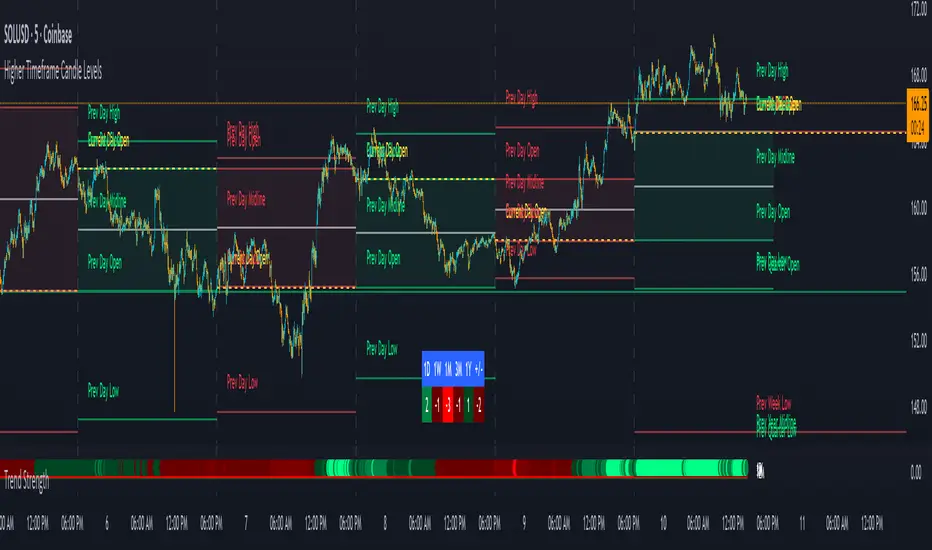
Breakout ScannerThis is a Breakout Scanner that shows you the immediate trend across 4 higher timeframes for up to 10 different tickers. It calculates a score from 1 to 3 for bullish and -1 to -3 for bearish based on where price is currently at compared to the previous higher timeframe’s candle levels.
When price is breaking out of the previous higher timeframe candle’s range, then it will have a score of 3 for bullish breakout or -3 for bearish breakout. When price is above the high or below the low of multiple different higher timeframe candles, you can expect price to continue the breakout and move to a new area of price range.
The brighter red or green the color is, the stronger the trend is on that timeframe. When it shows a bright green or red box on the far right side of a ticker, it is notifying you that the ticker is bullish or bearish on all timeframes and trending strongly, so switch over to that chart and look to trade in the direction of that trend.
The tickers, colors and time frames can be customized to suit your preference and you can also turn off as many tickers or time frames as you’d like if you want less tickers or time frames to show up on the indicator. It also includes alerts for when all timeframes are bullish or all timeframes are bearish for one ticker.
Make sure to keep each timeframe set to a timeframe that is higher than your chart timeframe.
Bullish Scoring & Colors
If the current candle close is above the midline of the higher time frame candle, it is given a score of 1 and a dark green background. If the current candle close is above the higher timeframe candle body, then it is given a score of 2 and a medium green background. If the current candle close is above the high of the higher time frame candle, it is given a score of 3 and a bright green background.
The higher the score the stronger the bullish trend and the brighter green the color will be.
Bearish Scoring & Colors
If the current candle close is below the midline of the higher timeframe candle, it is given a score of -1 and a dark red background. If the current candle close is below the higher timeframe candle body, then it is given a score of -2 and a medium red background. If the current candle close is below the low of the higher timeframe candle, it is given a score of -3 and a bright red background.
The lower the score, the stronger the bearish trend and the brighter red the color will be.
Total Score Display
On the right side of the indicator table, there is a column that displays the total score by adding all the scores together so you can easily tell the overall strength of the trend across all timeframes. Wait for the trend score to be at least 75% of the possible score to trade so you can ensure you are only trading very strong trends and increase your probability of winning your trade. The total score will update according to how many time frames you have enabled in the settings. You can also turn on or off the total score count if you prefer. The default setting is off.
All Timeframe Trends Agree
When all of the timeframes that you have turned on are in the same direction at the same time, a green or red box will appear on the far right side of the scanner. This is a visual cue that lets you know the strongest trending markets without having to read any of the numbers. Make sure to check out the charts for the markets that have a green or red box on the far right side and look for potential trend trading opportunities.
Alerts
You can set alerts for when all time frames for a certain ticker are bullish or bearish. If you have some time frames turned off at the time of creating your alerts, then it will only require all time frames that are on to be all bullish or bearish to generate an alert. Make sure to set your alerts to once per bar close to ensure you don’t get premature alerts that aren’t yet valid.
Best Way To Use The Scanner
For best results, make sure you wait for the trend to show all bullish or all bearish at the same time and then look to trade in the direction of the strong trend. If you can be patient enough to do that, you will increase the probability of winning your trade because you are trading with the direction of the overall higher timeframe trend when the market is trending strongly and making new highs or lows.
When one of the markets in the scanner shows all timeframes trending, go to that chart and see how price action is reacting to the previous higher timeframe candle levels. You can see those levels easily by adding our Higher Timeframe Candle Levels indicator to your chart and using the same timeframes as your Breakout Scanner is using.
If price is holding the higher timeframe candle levels well, then look to place trades in the direction of the trend that the Breakout Scanner is showing.
Other Indicators To Pair This With
Use this in combination with our Higher Timeframe Candle Levels indicator so you can see all of these levels being used to calculate the trend strength scores and watch how price reacts to those levels. You should also use our Trend Strength Indicator to easily read the historical trends of price compared to the higher timeframes and use those trends to guide you on when to trade and which direction to trade.
Trend Strength Indicator, Higher Timeframe Candle Levels and the Breakout Scanner all use the same levels to calculate the trend scores so they are designed to work all together to help you quickly be able to read a chart and find what direction to trade in.

Trend Strength IndicatorThis is a Trend Strength Indicator that shows you the immediate trend and historical trend of price for up to 7 higher timeframes.
It shows the strength of each timeframe by showing a red or green dot based on where price is at compared to the previous higher timeframe candle. The brighter red or green the dot is, the stronger the trend is compared to that higher timeframe candle.
The colors and timeframes can be customized to suit your preference and you can also turn off as many timeframes as you’d like if you want less time frames to show up on the indicator.
It also includes alerts for when all timeframes are bullish or all timeframes are bearish.
Keep these timeframes set to higher time frames than your chart so you can trade in the direction of the overall higher timeframe trend.
Bullish Scoring & Colors
If the current candle close is above the midline of the higher time frame candle, it is given a score of 1 and a dark green dot. If the current candle close is above the higher timeframe candle body, then it is given a score of 2 and a medium green dot. If the current candle close is above the high of the higher time frame candle, it is given a score of 3 and a bright green dot.
The higher the score the stronger the bullish trend and the brighter green the dot will be.
Bearish Scoring & Colors
If the current candle close is below the midline of the higher timeframe candle, it is given a score of -1 and a dark red dot. If the current candle close is below the higher timeframe candle body, then it is given a score of -2 and a medium red dot. If the current candle close is below the low of the higher timeframe candle, it is given a score of -3 and a bright red dot.
The lower the score, the stronger the bearish trend and the brighter red the dot will be.
Trend Scoring Modes
We gave you the option to set the trend scoring mode to either score based on price above or below the midline for quick and easy trend identification, or using the midline, candle body and highs and lows to give you a more detailed view of the trend strength. You can switch between these modes by selecting your preferred mode in the settings panel. The default is Open, High, Low, Close + Midline.
Sending Trend Direction To External Indicators
We coded in the ability to use the trend strength score as a signal that you can use to filter other indicators. This feature is great for notifying signal generating indicators what direction the market is trending in so that the signal generating indicator only gives signals in the direction of the trend.
This feature works by providing a data output of 1, 0 or -1. 1 means the trend is bullish, 0 means the trend is neutral and -1 means the trend is bearish.
This score is calculated by using the score of each timeframe that is turned on and checking if all timeframes are in the same direction or not. So if 3 timeframes are turned on and they are all bullish, the indicator will provide a data output of 1. This tells your external indicators that the trend is bullish.
This data output can be found in the data window and is labeled Trend Direction To Send To External Indicators.
At the bottom of the settings panel, there is a setting called Trend Score Threshold For External Indicators. This setting is the score threshold that all timeframes will need to meet to allow a trend strength signal to go through. So if set to 1, then all timeframes must be scored 1 or higher for bullish or -1 or lower for bearish. If set to 2, then all timeframes must be 2 or higher for bullish or -2 or lower for bearish. If set to 3, then all timeframes must be 3 for bullish or -3 for bearish. If all timeframes have met this threshold, then a bullish or bearish signal can be sent to your external indicator as a trend filter.
Labels
There are labels to the right of each row of dots, telling you which timeframe is which so you can easily identify what timeframe each row is showing the trend for.
Alerts
You can set alerts for when all timeframes are bullish or when all timeframes are bearish. If you have some time frames turned off at the time of creating your alerts, then it will only require all timeframes that are on to be all bullish or bearish to generate an alert. Make sure to set your alerts to once per bar close to ensure you don’t get premature alerts that aren’t yet valid.
Backtesting
This indicator helps you quickly identify and backtest the trend direction, how strong that trend is on multiple timeframes and helps you spot reversals and trend continuations. Make sure you look back at a lot of historical data to see how price moves when trend changes take place and how well price continues in each direction compared to the overall trend. This will help you gain confidence in reading the indicator and using it to your advantage when trading.
Best Way To Use The Indicator
This indicator is designed to help you quickly identify the trend on various different timeframes. The brighter the green dots are, the stronger the bullish trend is. The brighter the red dots are, the stronger the bearish trend is.
Trade in the direction of the trend. If the colors are mixed green and red, then price is likely to chop back and forth, so only trade the extremes of the ranges when that happens.
When most of the lower timeframe dots are the same color, that means it is a strong trend and you should place trades in the direction of the trend to be safe. The lower timeframes will start trending before the higher timeframes, so take notice of the lower timeframe colors starting to agree with each other and then take advantage of the trend that is forming.
You can also spot reversals with this indicator by watching for the lower timeframes to start changing color after a strong trend in one direction. The lower timeframes will start to change color one by one, indicating that the trend is actually changing direction.
For best results, make sure you wait for the trend to show all bullish or all bearish at the same time before you place any trades. If you can be patient enough to do that, you will increase the probability of winning your trade because you are trading with the direction of the overall higher timeframe trend which is typically an easy way to win more trades. Of course wait for pullbacks during the trend so you can keep a tight stop loss after entering your trade.
If you are scalping, you can turn off the higher timeframes and just use the 1 hour through 1 day. This won’t be as reliable as using all timeframes and waiting for them to align, but it is suitable for scalping quick intraday movements.
Other Indicators To Pair This With
Use this in combination with our Higher Timeframe Candle Levels indicator so you can see all of these levels being used to calculate the trend strength scores and watch how price reacts to those levels. You should also use our Breakout Scanner to find other markets with strong trends so you always know which market is trending the strongest and can trade those. Trend Strength Indicator, Higher Timeframe Candle Levels and the Breakout Scanner all use the same levels and calculate the trend scores the same way so they are designed to work all together to help you quickly be able to read a chart and find what direction to trade in.
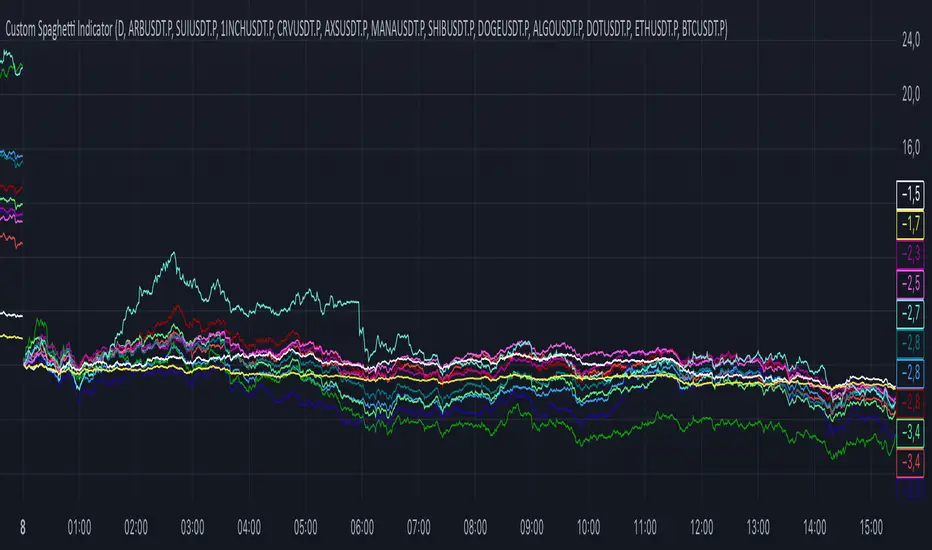
DEMI Spaghetti IndicatorCorrelation Pairs Spread Trader
🎯 Purpose
This indicator is specifically designed for correlation spread trading between highly correlated cryptocurrency pairs. Each color group represents two assets that typically move together, allowing traders to identify spread trading opportunities when the correlation temporarily breaks.
📊 How It Works For Spread Trading
Color-Coded Correlation Groups: Similar colors = correlated pairs
Spread Visualization: The difference between lines shows the spread between correlated assets
Mean Reversion Signals: When correlated pairs diverge significantly, it creates potential mean reversion opportunities
💡 Trading Strategy
Identify Correlated Pairs (same color group)
Monitor Spread Divergence - when percentage changes differ significantly
Enter Spread Trades:
Buy the underperforming asset
Sell the outperforming asset
Wait for Correlation Restoration - profit when spread narrows back to normal
🎨 Correlation Groups:
🔴 Red Group: ARB/SUI - DeFi tokens
🔵 Blue Group: 1INCH/CRV - DEX tokens
🟢 Green Group: AXS/MANA - Gaming/Metaverse
🟣 Purple Group: SHIB/DOGE - Meme coins
🟦 Teal Group: ALGO/DOT - Layer 1 protocols
⚪ Yellow/White: ETH/BTC - Market leaders