Supertrended RSI [AlgoAlpha]🚀📈 Introducing the Supertrended RSI Indicator by AlgoAlpha!
Designed to empower your trading decisions, this innovative Pine Script™ creation marries the precision of the Relative Strength Index (RSI) with the dynamic prowess of the SuperTrend methodology. Whether you’re charting the course of cryptos, riding the waves of stock markets, or navigating the futures landscape, our SuperTrended RSI Indicator is your go-to tool for uncovering unique trend insights and crafting trading strategies. 🌟
Key Features:
🔍 Enhanced RSI Analysis: Combines the traditional RSI with a supertrend calculation for a dynamic look at market trends.
🔄 Multiple Moving Averages: Offers a selection of moving averages including SMA, HMA, EMA, and more for tailored analysis.
🎨 Customizable Visuals: Choose your own color scheme for uptrends and downtrends to match your trading dashboard.
📊 Flexible Input Settings: Tailor the indicator with customizable lengths, factors, and smoothing options.
⚡ Real-Time Alerts: Set alerts for bullish and bearish reversals to stay ahead of market movements.
Quick Guide to Using the Supertrended RSI Indicator
Maximize your trading with the Supertrended RSI by following these streamlined steps! 🚀✨
🛠 Add the Indicator: Search for "Supertrended RSI " in TradingView's Indicators & Strategies. Customize settings like RSI length, MA type, and Supertrend factors to fit your trading style.
🎨 Visual Customization: Adjust uptrend and downtrend colors for clear trend visualization.
📊 Market Analysis: Watch for the Supertrend color change for trend reversals. Use the 70 and 30 lines to spot overbought/oversold conditions.
🔔 Alerts: Enable notifications for reversal conditions to capture trading opportunities without constant chart monitoring.
How It Works:
At the core of this indicator is the combination of the Relative Strength Index (RSI) and the Supertrend framework, it does so by applying the SuperTrend on the RSI. The RSI settings can be adjusted for length and smoothing, with the option to select the data source. The Supertrend calculation takes into account a specified trend factor and the Average True Range (ATR) over a given period to determine trend direction.
Visual elements include plotting the RSI, its moving average, and the Supertrend line, with customizable colors for clarity. Overbought and oversold conditions are highlighted, and trend changes are filled with distinct colors.
🔔 Alerts: Enable alerts for crossover and crossunder events to catch every trading opportunity.
🌈 Whether you're a seasoned trader or just starting, the Supertrended RSI offers a fresh perspective on market trends. 📈
💡 Tip: Experiment with different settings to find the perfect balance for your trading style!
🔗 Explore, customize, and enhance your trading experience with the Supertrended RSI Indicator! Happy trading! 🎉
Signals

Octopus Nest Strategy Hello Fellas,
Hereby, I come up with a popular strategy from YouTube called Octopus Nest Strategy. It is a no repaint, lower timeframe scalping strategy utilizing PSAR, EMA and TTM Squeeze.
The strategy considers these market factors:
PSAR -> Trend
EMA -> Trend
TTM Squeeze -> Momentum and Volatility by incorporating Bollinger Bands and Keltner Channels
Note: As you can see there is a potential improvement by incorporating volume.
What's Different Compared To The Original Strategy?
I added an option which allows users to use the Adaptive PSAR of @loxx, which will hopefully improve results sometimes.
Signals
Enter Long -> source above EMA 100, source crosses above PSAR and TTM Squeeze crosses above 0
Enter Short -> source below EMA 100, source crosses below PSAR and TTM Squeeze crosses below 0
Exit Long and Exit Short are triggered from the risk management. Thus, it will just exit on SL or TP.
Risk Management
"High Low Stop Loss" and "Automatic High Low Take Profit" are used here.
High Low Stop Loss: Utilizes the last high for short and the last low for long to calculate the stop loss level. The last high or low gets multiplied by the user-defined multiplicator and if no recent high or low was found it uses the backup multiplier.
Automatic High Low Take Profit: Utilizes the current stop loss level of "High Low Stop Loss" and gets calculated by the user-defined risk ratio.
Now, follows the bunch of knowledge for the more inexperienced readers.
PSAR: Parabolic Stop And Reverse; Developed by J. Welles Wilders and a classic trend reversal indicator.
The indicator works most effectively in trending markets where large price moves allow traders to capture significant gains. When a security’s price is range-bound, the indicator will constantly be reversing, resulting in multiple low-profit or losing trades.
TTM Squeeze: TTM Squeeze is a volatility and momentum indicator introduced by John Carter of Trade the Markets (now Simpler Trading), which capitalizes on the tendency for price to break out strongly after consolidating in a tight trading range.
The volatility component of the TTM Squeeze indicator measures price compression using Bollinger Bands and Keltner Channels. If the Bollinger Bands are completely enclosed within the Keltner Channels, that indicates a period of very low volatility. This state is known as the squeeze. When the Bollinger Bands expand and move back outside of the Keltner Channel, the squeeze is said to have “fired”: volatility increases and prices are likely to break out of that tight trading range in one direction or the other. The on/off state of the squeeze is shown with small dots on the zero line of the indicator: red dots indicate the squeeze is on, and green dots indicate the squeeze is off.
EMA: Exponential Moving Average; Like a simple moving average, but with exponential weighting of the input data.
Don't forget to check out the settings and keep it up.
Best regards,
simwai
---
Credits to:
@loxx
@Bjorgum
@Greeny

LuxAlgo® - Screener (S&O)The LuxAlgo® - Screener (S&O) is a complete tool allowing users to check returned information from Signals & Overlays™ features for various user selected tickers and timeframes.
Users can customize the returned information by the screener, as well as filtering out displayed tickers based on custom user set rules.
🔶 FEATURES
Users can place the location of the screener everywhere they want, multiple locations are supported, you can even have it on your chart by drag and dropping the screener to your chart, allowing you to analyze them alongside your favorite indicators.
Keeping track of various tickers is crucial to have a deeper understanding of the overall market activity.
Our screener let you quickly access your preferred information in a convenient way thanks to the described features below:
Screening of the main Signals & Overlays™ features on up to 10 user selected tickers and timeframes.
Ticker filtering based on custom user set rules.
Ticker sorting based on ascending/descending user selected data returned by the screener.
The LuxAlgo® - Screener (S&O) returns the following information:
Current price
Current volume
Current price percent change (% CHG)
Current price change (CHG)
Current rating
Most recent signal
Number of Exits since most recent signals
Current Smart Trail status
Current Reversal Zones status
Current Trend Catcher status
Current Trend Tracer status
Current Neo Cloud status
Current Trend Strength value
Current Lux Volatility value
Current Squeeze Index value
Current Volume Sentiment value
🔹 Rating
Users can quickly check the overall sentiment based on the screeners returned information by looking at the Rating column. Tickers can be rated as follows:
▲ Strong Bullish (more than 80% of the returned information is bullish)
△ Bullish (60% to 80% of the returned information is bullish)
― Neutral (40% to 60% of the returned information is bullish)
▽ Bearish (20% to 60% of the returned information is bullish)
▼ Strong Bearish (less than 20% of the returned information is bullish)
This can be a quick way to asses the confluence between all the returned information on the screener for a specific ticker.
🔹 Filtering
Thanks to the integrated filtering capabilities of the LuxAlgo® - Screener (S&O) you will be able to keep track of the information from tickers that return specific information you want to see.
For example do you want to only see the information from up trending tickers? Nothing easier, all you need is to select the up trending related options (▲ Strong Bullish or △ Bullish) in the rating dropdown menu.
However you don't have to stop at 1 filtering condition, create more complex ones that fits your trading style for the tickers you truly want to look at!
🔹 Sorting
As traders we want to quickly spot the tickers with most volume, most volatility, with the strongest uptrend or downtrend.
The LuxAlgo® - Screener (S&O) lets you do that by sorting supported information in an ascending or descending order, letting you access the most relevant information faster.

Adaptive Fisherized Z-scoreHello Fellas,
It's time for a new adaptive fisherized indicator of me, where I apply adaptive length and more on a classic indicator.
Today, I chose the Z-score, also called standard score, as indicator of interest.
Special Features
Advanced Smoothing: JMA, T3, Hann Window and Super Smoother
Adaptive Length Algorithms: In-Phase Quadrature, Homodyne Discriminator, Median and Hilbert Transform
Inverse Fisher Transform (IFT)
Signals: Enter Long, Enter Short, Exit Long and Exit Short
Bar Coloring: Presents the trade state as bar colors
Band Levels: Changes the band levels
Decision Making
When you create such a mod you need to think about which concepts are the best to conclude. I decided to take Inverse Fisher Transform instead of normalization to make a version which fits to a fixed scale to avoid the usual distortion created by normalization.
Moreover, I chose JMA, T3, Hann Window and Super Smoother, because JMA and T3 are the bleeding-edge MA's at the moment with the best balance of lag and responsiveness. Additionally, I chose Hann Window and Super Smoother because of their extraordinary smoothing capabilities and because Ehlers favours them.
Furthermore, I decided to choose the half length of the dominant cycle instead of the full dominant cycle to make the indicator more responsive which is very important for a signal emitter like Z-score. Signal emitters always need to be faster or have the same speed as the filters they are combined with.
Usage
The Z-score is a low timeframe scalper which works best during choppy/ranging phases. The direction you should trade is determined by the last trend change. E.g. when the last trend change was from bearish market to bullish market and you are now in a choppy/ranging phase confirmed by e.g. Chop Zone or KAMA slope you want to do long trades.
Interpretation
The Z-score indicator is a momentum indicator which shows the number of standard deviations by which the value of a raw score (price/source) is above or below the mean value of what is being observed or measured. Easily explained, it is almost the same as Bollinger Bands with another visual representation form.
Signals
B -> Buy -> Z-score crosses above lower band
S -> Short -> Z-score crosses below upper band
BE -> Buy Exit -> Z-score crosses above 0
SE -> Sell Exit -> Z-score crosses below 0
If you were reading till here, thank you already. Now, follows a bunch of knowledge for people who don't know the concepts I talk about.
T3
The T3 moving average, short for "Tim Tillson's Triple Exponential Moving Average," is a technical indicator used in financial markets and technical analysis to smooth out price data over a specific period. It was developed by Tim Tillson, a software project manager at Hewlett-Packard, with expertise in Mathematics and Computer Science.
The T3 moving average is an enhancement of the traditional Exponential Moving Average (EMA) and aims to overcome some of its limitations. The primary goal of the T3 moving average is to provide a smoother representation of price trends while minimizing lag compared to other moving averages like Simple Moving Average (SMA), Weighted Moving Average (WMA), or EMA.
To compute the T3 moving average, it involves a triple smoothing process using exponential moving averages. Here's how it works:
Calculate the first exponential moving average (EMA1) of the price data over a specific period 'n.'
Calculate the second exponential moving average (EMA2) of EMA1 using the same period 'n.'
Calculate the third exponential moving average (EMA3) of EMA2 using the same period 'n.'
The formula for the T3 moving average is as follows:
T3 = 3 * (EMA1) - 3 * (EMA2) + (EMA3)
By applying this triple smoothing process, the T3 moving average is intended to offer reduced noise and improved responsiveness to price trends. It achieves this by incorporating multiple time frames of the exponential moving averages, resulting in a more accurate representation of the underlying price action.
JMA
The Jurik Moving Average (JMA) is a technical indicator used in trading to predict price direction. Developed by Mark Jurik, it’s a type of weighted moving average that gives more weight to recent market data rather than past historical data.
JMA is known for its superior noise elimination. It’s a causal, nonlinear, and adaptive filter, meaning it responds to changes in price action without introducing unnecessary lag. This makes JMA a world-class moving average that tracks and smooths price charts or any market-related time series with surprising agility.
In comparison to other moving averages, such as the Exponential Moving Average (EMA), JMA is known to track fast price movement more accurately. This allows traders to apply their strategies to a more accurate picture of price action.
Inverse Fisher Transform
The Inverse Fisher Transform is a transform used in DSP to alter the Probability Distribution Function (PDF) of a signal or in our case of indicators.
The result of using the Inverse Fisher Transform is that the output has a very high probability of being either +1 or –1. This bipolar probability distribution makes the Inverse Fisher Transform ideal for generating an indicator that provides clear buy and sell signals.
Hann Window
The Hann function (aka Hann Window) is named after the Austrian meteorologist Julius von Hann. It is a window function used to perform Hann smoothing.
Super Smoother
The Super Smoother uses a special mathematical process for the smoothing of data points.
The Super Smoother is a technical analysis indicator designed to be smoother and with less lag than a traditional moving average.
Adaptive Length
Length based on the dominant cycle length measured by a "dominant cycle measurement" algorithm.
Happy Trading!
Best regards,
simwai
---
Credits to
@cheatcountry
@everget
@loxx
@DasanC
@blackcat1402

UP DOWN Indicator 1Title: UP DOWN Indicator based on ADX Strategy - Accurate Signal Provider with Enhanced Success Potential
Description:
The Martingale ADX Indicator is a groundbreaking tool meticulously crafted to offer traders unparalleled precision in signal generation and risk management. Leveraging the power of the Average Directional Index (ADX), this indicator provides 100% non-repaint signals on the current candle, guiding traders to opportune and prepare for trade entry with remarkable accuracy.
With a focus on empowering traders across various financial markets, including Forex and Binary Options, this ADX Strategy-1 Indicator introduces a unique approach to trading dynamics. By seamlessly integrating the renowned Martingale Step-1 risk management strategy, this indicator not only minimizes losses but also enhances the potential for success, even in volatile market conditions.
Key Features:
Non-Repaint Signals: The Martingale ADX Indicator stands as a testament to reliability, offering 100% non-repaint signals. Traders can trust in the consistency and not removing losing Signals which is very important to trust the previous generated signals also, eliminating uncertainties and facilitating confident decision-making.
ADX-Based Precision: Built upon the robust framework of the Average Directional Index (ADX), this indicator delivers precise signals tailored to prevailing market trends and volatility levels. Whether trading in longer timeframes or engaging in Binary Options, traders can rely on the Martingale Step-1 ADX Indicator for superior insights.
Next Candle Trading: Seamlessly integrated into trading strategies, signals from the Martingale ADX Indicator prompt action on the subsequent candle. This real-time approach ensures traders stay ahead of market movements, seizing opportunities as they emerge. Giving Signals Once Candle ahead makes traders to prepare early and decide whether they want to enter the trade on presented Signal or not as per their own experience too. If the trading candle is loss then the very next candle shall be used for taking Martingale Sep-1 to enhance the Accuracy.
Enhanced Success Potential: With Martingale Step-1 risk management, this ADX Indicator offers more than just signal accuracy – it presents the potential for heightened success rates. Through strategic position sizing and leveraging experience and Price Action insights, traders can elevate overall accuracy to levels ranging from 80% to 90%.
Conclusion:
The UP DOWN Strategy-1 Indicator represents a paradigm shift in trading technology, combining precision signal generation with advanced risk management strategies. Whether you're a seasoned trader or just starting your journey, this indicator empowers you to navigate financial markets with confidence and achieve consistent results.
Experience the difference with the Martingale ADX Indicator – where reliability meets profitability, and success becomes attainable with every trade.
Trade wisely, and may your ventures be marked by prosperity and fulfillment.
Pardon for any descriptive language grammatical error and comment about this indicator and to get my other strategy as well. Happy trading !!
Risk Disclaimer:
Trading in financial markets carries inherent risks and should be approached with caution. It is imperative to exercise sound judgment and trade only with funds that you can afford to lose. We strongly advise against using borrowed funds for trading purposes. First practice on demo for own learning then make decision wisely.

SFX Signals & Overlays [YinYangAlgorithms]SFX Signals & Overlays aims to help traders Identify Buy & Sell locations, Reversals, Volatility Zones, Support & Resistance and Overbought & Oversold Zones. All of these may work in harmony with each other by helping to identify when to enter and exit a trade; as well as helping to determine the risk / reward the trade may ensue.
SFX Signals & Overlays’s Buy & Sell signals are momentum based, meaning the Initial ‘Buy’ & ‘Sell’ signal may not be exactly where you want to get in/out. What may occur is the initial signal appears, a few more continuation signals appear afterwards (always in a chain); and once the momentum has ended a ‘Reversal’ signal appears. The reversal is there to help signify that the ‘opportune’ time to buy/sell may have passed and the price may now correct in the opposite direction. This Indicator aims to Buy Low and Sell High; and therefore the Buy signal momentum may occur as the price is either about to fall, currently falling or has started to consolidate. When the Buy signal momentum has ended, this means the momentum is at an impasse, but is favoring Buy momentum and a reversal (correction) may occur.
Buying & Selling at reversal signals may be profitable, however it may be less risky to DCA into your long / short positions during the Buy/Sell momentum signals instead. Let's get into the Tutorial so you can better understand how our SFX Signals & Overlays indicator works.
Tutorial:
Our example above showcases how our SFX Signals & Overlays Indicator looks on the default settings ‘Medium’ for each of our Algorithm Settings:
Trend Sensitivity
Signal Sensitivity
Zone Sensitivity
All of our Algorithm Settings feature 3 different speeds:
Fast
Medium
Slow
These speeds may be applied to each Algorithm Setting individually and affect how quickly they adapt to the current market's momentum. This allows you to tailor this Indicator to fit your trading style by adjusting it to meet your needs accordingly. If you are someone who likes to swing trade on the 1-5 minute timeframe, you may find better confluence with all settings on ‘Fast’. Medium term holders and traders may find better results with all settings on ‘Medium’. Likewise, long term investors may find best results with all settings on ‘Slow’. However, this shouldn’t stop you from finding your own best result by adjusting them individually to meet your own unique trading style.
SFX Signals & Overlays helps you identify shifts in momentum by displaying Momentum Signals. Momentum Signals are shown by either a Green or Red Triangle. Momentum Signals can continue for quite some time until the momentum has ended. We rank the first Momentum Signal from 1/5 to 5/5 for their strength and may help determine the chances of the momentum shift occurring. Once the Momentum Signals have ended we display a Reversal Signal. This Reversal Signal helps signify that the Momentum has ended. When the Momentum ends it means that a reversal may have started. This reversal may mean the price will continue in the direction the signal mentioned; or it may mean the price will consolidate. If the price consolidates then the signal is void as when the consolidation ends the price could go in either direction. If you notice consolidation occurring after a Reversal Signal; wait for more confirmations as it is now too risky.
Our Indicator displays different evaluations for each INITIAL Buy and Sell signal. These evaluations rank the current start of the signal from 1-5; 1 being the lowest and least reliable, 5 being the highest and most reliable. These rankings aren’t indefinite and are simply an evaluation at the time of the initial signal. We may potentially provide evaluations at the reversal later on if requested enough. When a Buy or Sell signal occurs this defines where momentum is occurring in this direction. This momentum is indicated by momentum signals shown through red / green triangles. These triangles indicate that this momentum is present. When these momentum signals end is when the Reversal Signal appears indicating that since this momentum has ended, there may be a decent chance of a reversal occurring. There also adherently may be the potential of consolidation occurring; but generally it means there is either a reversal, or consolidation + then a reversal or a continuation; however it may be apparent that the momentum has ended.
ES:
NQ:
BTC:
If you refer to the 3 examples above, we show how the ES, NQ and BTC look within a 5 minute scalping example. Essentially you’d make your decision on the Buy / Sell signal, the momentum signals, the Reversal Signals, the Trend Colors as well as other oscillators and Due Diligence.
Remember, there’s no such thing as a perfect entry / exit, the more you understand about trading and do your own Due Diligence the better. These Buy and Sell as well as Reversal signals attempt to locate and rank momentum shifts to help you identify where the momentum may be ending and reversing in the opposite direction.
Our zones defined by the Outer (red) and Inner (green) are representations of not only Support and Resistance locations, but likewise Overbought and Oversold locations. These zones help in multiple ways. The hard lines that define each zone's start / end are very useful locations of support / resistance which may indicate where the price will bounce off of. Likewise, when the price is within these zones it represents the price being Overbought or Oversold. Then the price is for instance within the Red Resistance Zone, what generally may happen is the price will correct quickly to get back to the ‘Black Empty Zone’ between the Red and Green zones; OR it may consolidate sideways until it has entered the ‘Black Empty Zone’. This is how the price may redeem itself back to being valued correctly. These zones help you identify and understand, in concatenation with our signals when and how much the price may move.
Our Settings are minimalistic so you don’t need to worry and get overwhelmed about changing values and trying to fiddle to find which values works the best for what. Our Algorithms will take care of all of that for you. Simply select the speeds for your Trend, Signals and Zones and you’re good to start trading! You can likewise customize what information is visible to you and the colors to better customize your experience.
Fast:
Medium:
Slow:
The 3 examples above display what the same portion of the chart looks like when Trend, Signal and Zone Sensitivity is changed from Fast, Medium and Slow.
As you can see, they all look quite different in the results they produce. By default all settings are set to Medium, however they can all be individually changed to suit your trading style and needs.
Our Indicator offers many different alert options which may help you stay informed with how the market is moving and any momentum changes that may occur.
Settings:
1. Algorithm Settings
Trend Sensitivity (Fast, Medium, Slow): Trend Sensitivity refers to how quickly the Trend Bar Colors change. Fast: will change colors very quickly if it senses momentum is changing. Medium: will change almost as quickly as Fast, however, rather than swapping from Bullish to Bearish momentum right away it has an intermediate 'Neutral - Slightly Bullish (Yellow)' and 'Neutral - Slightly Bearish (Orange)'. This way you can better visualize when the momentum is dying in the trend and starting back up by having these trend 'Neutral/Consolidation' areas. Slow: will attempt to only change Trend Bar Colors when the momentum has surely shifted. This may result in a bit of lagging behind.
Signal Sensitivity (Fast, Medium, Slow): Signal Sensitivity refers to how quickly the Buy & Sell Momentum Signals & Reversal Signals appear. These signals are meant to appear when it thinks the price may reverse, but the speeds refer to how much of a reversal they think may happen. Fast: will attempt to locate any and all momentum swings. Medium: will attempt to only locate momentum swings which may drive the price up considerably. Slow: will attempt to locate only the most extreme momentum swings. This may result in some potentially good ones missed however; but the ones it finds may have a higher probability of occuring.
Zone Sensitivity (Fast, Medium, Slow): Zone Sensitivity refers to how quickly the Zones expand based on price movement. These zones may be useful for not only seeing Support & Resistance; but also identifying when it is Overbought & Oversold; as well as visualizing volatility between the Black (Empty area) and the zones. The lines that separate each zone are the Support and Resistance locations; the area within the zones are simply the spacing between these Support and Resistance locations. However, the further the price is to the outer zones does represent Overbought and Oversold. Fast: will expand very quickly. This causes the price to be within the Black (Empty area) more often. This may be useful for finding extremities in price movement which may have a better chance of correcting. Medium: moves fast but not anywhere close to as fast as 'Fast'. Medium will hold its values in an attempt to be as accurate as possible for identifying Support and Resistance locations. Slow: will expand very slowly. This may be useful for identifying Support & Resistance as well as Volatility targets on higher time frames since these zones move much slower.
2. Display Settings:
Show Trend Bar Colors: Trend Bar Color are a way of seeing how the Trend is holding up on a bar by bar basis. This may be useful for seeing momentum starting, ending or simply dying down before any signals actually appear.
Signal Text Display (Both, Buy & Sell, Reversals, None: Signals are a way of seeing potential changes in momentum and when they have actually occurred. Our signals also rank from 1/5 to 5/5 how strong of a chance this momentum change may occur (only at the time of the signal, not at the time of the reversal). These may be useful as potential Entry and Exit locations; as well as when you see the reversal, you know that this momentum change has either begun or a consolidation may be occurring. If a consolidation occurs, the signal is no longer valid as the price can now go either way and it is best to wait for more signals or other technical analysis to determine momentum and movement.
Zone Display (All, Outer + Middle, Inner + Middle, Outer, Middle, Inner, None): Zones are composed of 3 areas above and below. These areas attempt to project Support & Resistance locations as well as display when the Price is Overbought and Oversold. You can specify which zones you wish to view, however all are important.
3. Color Settings:
Buy Color: This is the color of all Buy Signals and Zones.
Sell Color: This is the color of all Sell Signals and Zones.
Buy Reversal Color: This is the color of all Buy Signal Reversals.
Sell Reversal Color: This is the color of all Sell Signal Reversals.
If you have any questions, comments, ideas or concerns please don't hesitate to contact us.
HAPPY TRADING!

Inversion Fair Value Gaps (IFVG) [LuxAlgo]The Inversion Fair Value Gaps (IFVG) indicator is based on the inversion FVG concept by ICT and provides support and resistance zones based on mitigated Fair Value Gaps (FVGs).
🔶 USAGE
Once mitigation of an FVG occurs, we detect the zone as an "Inverted FVG". This would now be looked upon for potential support or resistance.
Mitigation occurs when the price closes above or below the FVG area in the opposite direction of its bias.
Inverted Bullish FVGs Turn into Potential Zones of Resistance.
Inverted Bearish FVGs Turn into Potential Zones of Support.
After the FVG has been mitigated, returning an inversion FVG, a signal is displayed each time the price retests an IFVG zone and breaks below or above (depending on the direction of the FVG).
Keep in mind how IFVGs are calculated and displayed. Once price mitigates an IFVG, all associated graphical elements such as areas, lines, and signals will be deleted.
This indicator is not meant to be just a 'signal indicator'. Backtesting historical signals is incorrect as it does not consider the mitigation of IFVGs, which is a standard method for trading IFVGs & various concepts by ICT.
The signals displayed are meant for real-time analysis of current bars for discretionary analysis. Current confirmed retests of unmitigated IFVGs are still displayed to show which IFVGS have had significant reactions.
🔶 SETTINGS
Show Last: Specifies the number of most recent FVG Inversions to display in Bullish/Bearish pairs, starting at the current and looking back. Max 100 Pairs.
Signal Preference: Allows the user to choose to send signals based on the (Wicks) or (Close) Prices. This can be changed based on user preference.
ATR Multiplier: Filters FVGs based on ATR Width, The script will only detect Inversions that are greater than the ATR * ATR Width.
🔶 ALERTS
This script includes alert options for all signals.
🔹 Bearish Signal
A bearish signal occurs when the price returns to a bearish inversion zone and rejects to the downside.
🔹 Bullish Signal
A bullish signal occurs when the price returns to a bullish inversion zone and bounces out of the top.

VWAP RangeThe VWAP Range indicator is a highly versatile and innovative tool designed with trading signals for trading the supply and demand within consolidation ranges.
What's a VWAP?
A VWAP (Volume Weighted Average Price) represents an equilibrium point in the market, balancing supply and demand over a specified period. Unlike simple moving averages, VWAP gives more weight to periods with higher volume. This is crucial because large volumes indicate significant trading activity, often by institutional traders, whose actions can reflect deeper market insights or create substantial market movements. The VWAP is also often used as a benchmark to evaluate the efficiency of executed trades. If a trader buys below the VWAP and sells above it, they are generally considered to have transacted favourably.
This is how it works:
Multiple VWAP Anchors:
This indicator uses multiple VWAPs anchored to different optional time periods, such as Daily, Weekly, Monthly, as well as to the highest high a lowest low within those periods. This multiplicity allows for a comprehensive view of the market’s average price based on volume and price, tailored to different trading styles and strategies.
Dynamic and Fixed Periods:
Traders can choose between using dynamic ranges, which reset at the start of each selected period, and specifying a date and time for a particular fixed range to trade. This flexibility is crucial for analyzing price movements within specific ranges or market phases.
Fixed ranges allow VWAPs to be calculated and anchored to a significant market event, the beginning of a consolidation phase or after a major news announcement.
Signal Generation:
The indicator generates buy and sell signals based on the relationship of the price to the VWAPs. It also allows for setting a maximum number of signals in one direction to avoid overtrading or pyramiding. Be sure to wait for the candle close before trading on the signals.
Average Buy/Sell Signal Lines:
Lines can be plotted to display the average buy and sell signal prices. The difference between the lines shows the average profit per trade when trading on the signals in that range. It's a good way to see how profitable a range is on average without backtesting the signals. The lines will also often turn into support and resistance areas, similar to value areas in a volume profile.
Customizable Settings:
Traders have control over various settings, such as the VWAP calculation method and bar color. There are also tooltips for every function.
Hidden Feature:
There's a subtle feature in this indicator: if you have 'Indicator values' turned on in TradingView, you'll see a Sell/Buy Ratio displayed only in the status line. This ratio indicates whether there are more sell signals than buy signals in a range, regardless of the Max Signals setting. A red value above 1 suggests that the market is trending upward, indicating you might want to hold your long positions a bit longer. Conversely, a green value below 1 implies a downward trend.

Blockunity Excess Index (BEI)Identify excess zones resulting in market reversals by visualizing price deviations from an average.
The Excess Index (BEI) is designed to identify excess zones resulting in reversals, based on price deviations from a moving average. This moving average is fully customizable (type, period to be taken into account, etc.). This indicator also multiplies the moving average with a configurable coefficient, to give dynamic support and resistance levels. Finally, the BEI also provides reversal signals to alert you to any risk of trend change, on any asset.
The Idea
The goal is to provide the community with a visual and customizable tool for analyzing large price deviations from an average.
How to Use
Very simple to use, this indicator plots colored zones according to the price's deviation from the moving average. Moving average extensions also provide dynamic support and resistance. Finally, signals alert you to potential reversal points.
Elements
The Moving Average
The Moving Average, which defaults to a gray line over 200 periods, serves as a stable reference point. It is accompanied by an Index, whose color varies from yellow to orange to red, offering an overview of market conditions.
Extensions
These dynamic lines can be used to determine effective supports and resistances.
Signals
Green and red triangles serve as clear indicators for buy and sell signals.
Settings
Mainly, the type of moving average is configurable. The default is an SMA.
A Simple Moving Average (SMA) calculates the average of a selected range of prices by the number of periods in that range.
But you can also, for example, switch the mode to EMA.
The Exponential Moving Average (EMA) is a moving average that places a greater weight and significance on the most recent data points:
You also have WMA.
A Weighted Moving Average (WMA) gives more weight on recent data and less on past data:
And finally, the possibility of having a PCMA.
PCMA takes into account the highest and lowest points in the lookback period and divides this by two to obtain an average:
You can change other parameters such as lookback periods, as well as the coefficient used to define extension lines.
You can refer to the tooltips directly in the indicator parameters.
For those who prefer a minimalist display, you can activate a "Bar Color" in the settings (You must also uncheck "Borders" and "Wick" in your Chart Settings), and deactivate all other elements as you wish:
Finally, you can customize all the different colors, as well as the parameters of the table that indicates the Index value and the asset trend.
How it Works
The Index is calculated using the following method:
abs_distance = math.abs(close - base_ma)
bei = (abs_distance - ta.lowest(abs_distance, lookback_norm)) / (ta.highest(abs_distance, lookback_norm) - ta.lowest(abs_distance, lookback_norm)) * 100
Signals are triggered according to the following conditions:
A Long (buy) signal is triggered when the Index falls below 100, when the closing price is lower than 5 periods ago, and when the price is under the moving average.
A Short (sell) signal is triggered when the Index falls below 100, when the closing price is greater than 5 periods ago, and when the price is above the moving average.

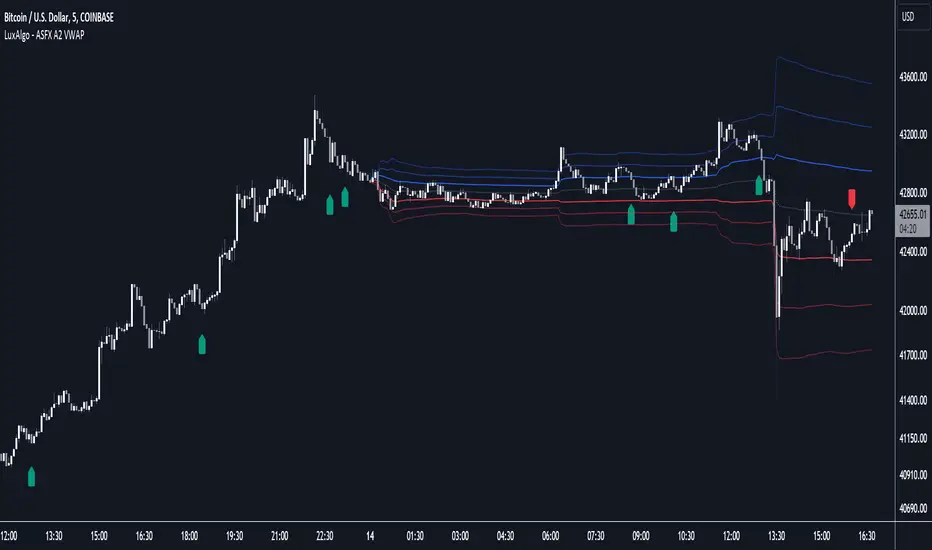
ASFX A2 VWAP [LuxAlgo]The ASFX A2 VWAP is a toolkit based on A2 signals and daily anchored VWAP bands, a methodology proposed by trader & educator Austin Silver (ASFX).
Pre-built alerts are also included.
🔶 USAGE
The A2 strategy involves identifying potential trades using specific signals and confirmation from the 21 EMA (Exponential Moving Average). Below we can see a bullish A2 signal triggering as price is closing below the 21 EMA with less than half of the candles closing price.
Within the settings, we have enabled the stop loss setting to assist us with trade setups generated from A2 signals.
Users can enable multiple layers of StDev multipliers on the AAVWAP to find areas of support & resistance alongside the A2 signals & other features included.
🔶 DETAILS
If 'Filter Based On VWAP' is enabled, bullish signals will only be displayed if located above the anchored VWAP, while bearish signals will only be displayed when located under the VWAP. The image above illustrates this, with transparent signals showing the ones that are supposed to be filtered.
The Stop Loss is based on the most recent A2 signal, and is constructed from the 1.618 Fibonacci retracement using the following points depending on the A2 signal:
Bullish: From candle low to the current daily maximum.
Bearish: From candle high to current daily minimum.
🔶 SETTINGS
🔹 A2
Validation EMA Period : Period of the EMA used to validate triggered A2 signals.
Trigger EMA Period : Period of the EMA used to trigger A2 signals.
Filter Based On VWAP : Filter A2 signals based on their location relative to the VWAP output.
🔹 VWAP
source : Input data for the anchored VWAP calculation
Show Central AVWAP : Display central VWAP on the chart
StDev Multiplier 1 : Display first VWAP bands, using a StDev multiplier of 1 by default.
StDev Multiplier 2 : Display second VWAP bands, using a StDev multiplier of 2 by default.
StDev Multiplier 3 : Display third VWAP bands, using a StDev multiplier of 3 by default.
🔹 Stop Loss
Stop Loss : Display stop loss based on the most recent A2 signal
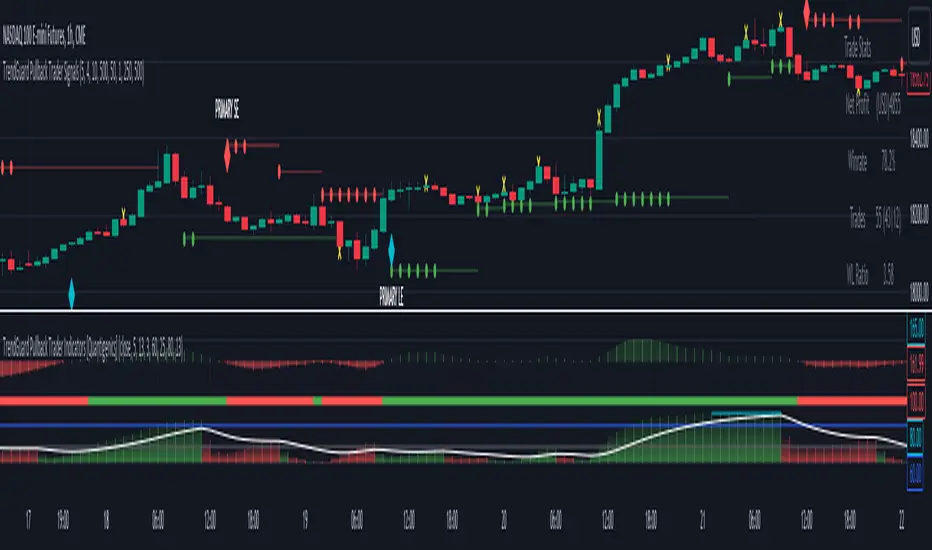
TrendGuard Pullback Trader Signals [Quantigenics]The "TrendGuard Pullback Trader Signals" script, integral to the "TrendGuard Pullback Trader" system, offers a sophisticated suite of trading tools for nearly any market or time frame. Designed to be used alongside the "TrendGuard Pullback Trader Indicators" script, this script is pivotal for identifying Buy/Sell Signals, Profit Target Signals, and Stop Loss Levels.
As with all of our scripts, the "TrendGuard Pullback Trader Signals" script, is designed to work on ANY symbol and time frame. The input parameters can be adjusted to fit your specific trading style.
Methodology and Application:
The script's core methodology lies in identifying primary signals at the onset of a trend and secondary signals during pullbacks or dips. It focuses on pinpointing optimal entry points during market pullbacks, enhancing the "TrendGuard Pullback Trader Indicators" script with well-timed signals for profit targets and stop loss levels.
Technical Composition:
The "TrendGuard Pullback Trader Signals" script combines various technical analysis tools to generate comprehensive trading signals. It calculates stop levels by assessing the highest and lowest bars over a chosen period, defining the market range. Primary signals are derived using a triple exponential moving average (EMA) of logarithmic closing prices, identifying trend changes with stop level plots and directional arrows. For secondary signals, the script uses a sequence of EMAs applied to the average price (HLC3) and an oscillator that measures the extremity of recent price movements, pinpointing potential entry points. The script also incorporates a sideways exit mechanism, comparing short-term and long-term EMAs of the average price to detect significant deviations, suggesting exit opportunities. This layered strategy offers a detailed perspective on market trends, momentum, and possible entry and exit points.
EMA-Based Trend Analysis Algorithm :
Utilizes an advanced algorithm that incorporates exponential moving averages (EMA) with specific length parameters. This algorithm analyzes the slope and direction of EMA lines to identify significant shifts in market trends.
Primary Signal Generation : Logarithmic and Triple EMA Function:
Primary signals are derived from a unique logarithmic function applied to price data, which is then processed through a series of three EMAs with distinct period settings. This combination targets potential trend initiation points by detecting shifts in the logarithmic trend curve.
Dynamic Stop Level Determination :
Employs a methodology involving the calculation of recent high and low price bars, adjusted by a factor that considers market volatility. This factor dynamically alters the sensitivity of the stop levels, aligning them with current market conditions.
Secondary Signal Identification During Pullbacks :
Secondary signals are identified through a complex comparison of the market's relative position to its moving averages. This involves calculating the divergence between price and moving averages, adjusted for the rate of change in the market, to flag strategic entry points during pullbacks.
Composite Market Trend Analysis for Signal Mechanism :
Signal generation integrates a composite of multiple technical indicators, each contributing unique mathematical calculations. This integration enhances the accuracy and reliability of entry and exit signals.
Practical Application in Trading :
> For trade initiation, primary signals are used to identify the start of potential trends, applying a specific mathematical threshold to confirm the trend change. Secondary signals focus on quantifying the pullback depth relative to recent market movements for additional entry opportunities.
> The script's dynamic stop loss adjustment incorporates a calculated moving average of recent highs and lows, providing a responsive and protective mechanism for open positions.
How to Use the Script:
Trade Initiation : Primary signals at trend onset can be used for potential entry points, or to simply establish a trend-bias, to watch for Strategic Entries signals.
Strategic Entries on Pullbacks : Secondary signals provide opportunities for additional entries or scaling into positions during pullbacks within the main trend.
Profit Targets and Exit Strategy : Profit target signals serve as potential exit points. For larger positions, consider partial exits at these targets while adjusting stop loss levels to secure profits, and hold the remaining position for further potential gains.
Dynamic Risk Management : Regularly adjust stop loss levels based on the script's dynamic stop level determination to protect against market reversals and lock in profits.
Integration with TrendGuard Pullback Trader Indicators:
The script is designed and intended to be used in conjunction with the "TrendGuard Pullback Trader Indicators ". This integration ensures a holistic approach to market analysis, combining the strengths of both scripts for a comprehensive understanding of market trends, momentum, and entry points.
Note: The lower indicators are from the 'TrendGuard Pullback Trader Indicators' script, complementing the 'TrendGuard Pullback Trader Signals' script seen here, which generates the 'cloud' and signals on the price chart.
The 'TrendGuard Pullback Traders Indicators” script can be found here :
Input Parameter Settings:
Important Usage Guidance: For seamless integration with its counterpart, the "TrendGuard Pullback Trader Indicators" script, it's crucial to align the input parameter settings across both scripts. When adjusting values from their defaults, ensure that corresponding parameters in both scripts are identically set. This synchronization is key to achieving a cohesive and accurate representation on your charts.
Intra-Bar Order Generation (IntraBar): Determines whether signals are generated within the current bar or only after it closes, enhancing flexibility in signal timing.
Stop Level Strength (StopLvlStr): Sets the strength for calculating stop levels, impacting the sensitivity of the script to market highs and lows for stop placement.
Primary Signal Display (PrimON_OFF): Toggles the visibility of primary signals on the chart, aiding in identifying trend initiation points.
Secondary Signal Display (SecON_OFF): Controls the display of secondary signals for opportunities during pullbacks, allowing traders to capitalize on additional entry points.
Stop Loss Level Display (StopLossLvls): Enables or disables the visualization of stop loss levels, crucial for risk management strategies.
Trend Length (TrendLen): Adjusts the length parameter for the EMA calculations, influencing how the script interprets trend duration and strength.
These parameters allow traders to customize the script’s functionality according to their trading style and preferences, ensuring a tailored approach to signal generation and risk management.
Trade Alerts:
The script includes an advanced alert system designed to notify traders of crucial trading signals. This can Especially be useful when using larger time frames where trade setups can take a longer period of time to develop:
Primary Buy/Sell Alerts: Alerts are triggered at primary signals, indicating potential trend initiation points for entering trades.
Secondary Buy/Sell Alerts: These alerts activate during secondary signals, highlighting opportunities within ongoing trends for strategic entries or exits.
Stop Loss Level Alerts: The script can alert traders when the price reaches or crosses the script-determined stop loss levels, aiding in timely decision-making for risk management.
Sideways Exit Alerts: Alerts for potential exits are generated in sideways market conditions, based on the script’s analysis of average price movements.
To set up these alerts, traders can use TradingView’s alert system to specify the conditions under which they receive notifications, such as when a certain shape (e.g., arrow up for buy, arrow down for sell) appears on the chart. This feature helps traders stay informed and react promptly to the dynamic market conditions.
The "TrendGuard Pullback Trader Signals " script is a meticulously crafted tool, essential for traders aiming to enhance their market analysis and decision-making across diverse trading environments. While the script offers advanced functionalities, it reaches its full potential when used alongside the "TrendGuard Pullback Trader Indicators" script. Traders are advised to familiarize themselves with both scripts for a well-rounded trading strategy.
As always, remember that trading involves risks and past performance is not indicative of future results.
You can see the “Author’s instructions" below to get immediate access to TrendGuard Pullback Trader Signals & the rest of the “Quantigenics Premium Indicator Suite”.
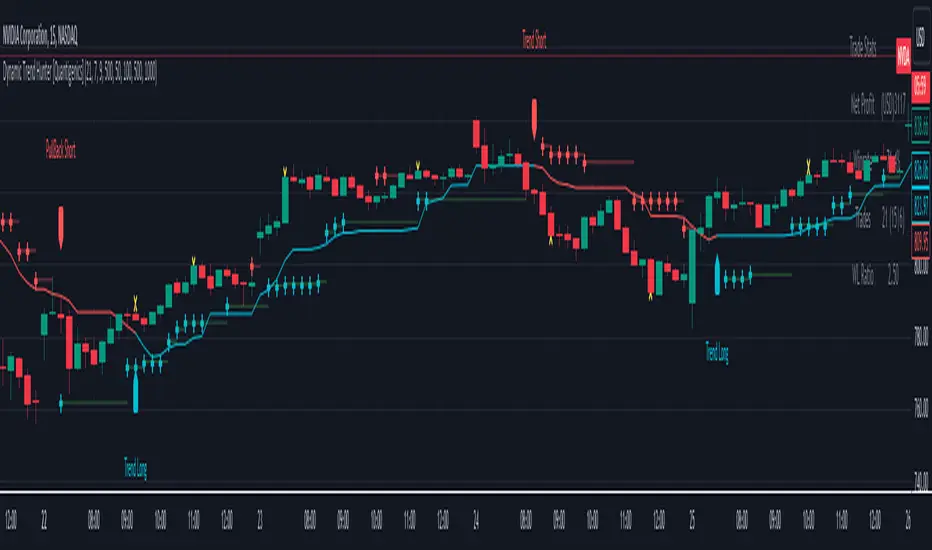
Dynamic Trend Hunter [Quantigenics]The "Dynamic Trend Hunter” script focuses on trend identification, dynamic entry and exit signals, and effective risk management. While a standalone trading script designed for versatile application across all markets, it can also be complemented by other indicators for enhanced analysis.
Core Features:
Dynamic Trend Indicator: Central to the script, this indicator discerns market trend direction using a color-coded system. Blue indicates an uptrend, red a downtrend, and a flat line signifies a sideways market.
Buy and Sell Signals: Provides clear, on-chart buy and sell signals to assist in identifying optimal entry points in alignment with the trend.
Profit Target Exits: A key feature designed to help traders lock in profits at strategic points. This feature uses a sophisticated mechanism (outlined in more detail below) to identify potential exit points, signaling the trader to close a position and secure gains before a potential market reversal.
Dynamic Stop Loss Levels: Essential for risk management, these levels adjust automatically, providing a mechanism for trailing stop losses and safeguarding against adverse market movements.
Technical Composition:
Dynamic Trend Indicator:
Calculation Method: Utilizes a blend of the highest and lowest prices over a specified length, averaged to create a trend line. This line is helpful in identifying the overall market trend.
Color Coding: The trend line changes color based on its relation to price action. A blue line indicates an uptrend when prices are consistently above this average line, while a red line signifies a downtrend when prices stay below it.
Signal-Based Trading:
Trend Entry Signals: Generated when there's a shift in the color of the trend line, indicating a potential change in market direction.
Pullback Entries: Identified when the closing price crosses the previous high (for long entries) or low (for short entries), while also considering the current trend line position.
Dynamic Stop Loss Levels:
Calculation: Stop loss levels are dynamically determined using the highest and lowest closing prices over the 'Length' period. These levels adjust with market movements, providing a trailing stop loss mechanism.
Visualization: Depicted as colored dots on the chart, changing in response to the market's movement relative to the trend line.
Oscillator for Dynamic Exits:
Mechanism: The script employs an oscillator to identify potential exit points, signaled by yellow dots. This oscillator is based on the relative extremity of the current price action compared to recent price movements.
Alerts: Dynamic exits trigger alerts when the oscillator reaches specified threshold levels, signaling potential market reversals or exhaustion points.
Customization and Flexibility:
Length Adjustment: The primary 'Length' input parameter allows traders to modify the sensitivity of the trend line and stop levels, catering to different trading styles and market conditions.
Alert Customization: Traders can set alerts for trend line changes and dynamic exits, ensuring timely responses to market movements.
Input Parameter Settings:
Intra-Bar Order Generation (IntraBar): Enables real-time signal generation within the current bar or after its closure.
Dynamic Exits (DynamicExits): Toggles the visibility of dynamic exit signals for profit-taking.
Dynamic Trend Length: Defines the lookback period for calculating the trend line. This length, which is adjustable and set by default to 21, specifies the number of bars over which the highest and lowest prices are analyzed to determine the trend line.
Dynamic Stop Loss Levels Length: This parameter defines the lookback period for calculating stop loss levels. It sets the number of bars used to determine the highest and lowest values for stop loss positioning. Adjusting this length allows traders to customize the sensitivity and placement of stop loss levels in accordance with their trading strategy and risk tolerance. This feature is crucial for tailoring stop loss settings to different market conditions and volatility levels, ensuring more effective risk management. Note: that initial stop loss levels, and tighter stop losses, can be set behind the Dynamic Trend Line itself.
Show Trend/Pullback Entries: Controls the display of specific entry signals based on trend continuation or market pullbacks.
Alert Settings: Options for setting alerts on trend line changes and dynamic exits, enhancing trade management.
Customizable Colors: Allows personalization of stop level and trend line colors for better chart visualization.
How to Trade with the Dynamic Trend Hunter:
Trend Following: Enter trades in the direction of the trend indicated by the color-coded trend line.
Pullback Entries: Look for pullback entry signals during established trends for additional entry points.
Dynamic Exits: Use yellow dot signals and dynamic stop loss levels for determining exit points or to adjust stop losses.
Risk Management: Employ the dynamic stop loss levels to manage risk effectively and protect against significant losses.
Alerts and Notifications:
Traders can set up alerts for trend line changes and dynamic exits, ensuring they are promptly informed about critical market movements and can react accordingly.
Conclusion:
The "Dynamic Trend Hunter " is a comprehensive and adaptable trading tool, suitable for various market conditions and trading styles. Its ability to provide clear trend indications, along with dynamic entry and exit signals, makes it an invaluable asset for traders aiming to enhance their market analysis and decision-making process. While it is a standalone system, it can be used in conjunction with other indicators to further refine trading strategies.
While we believe this tool may enhances your trading strategy, we encourage thorough familiarization before live trading. Remember, trading involves risk, and past performance is not indicative of future results.
You can see the “Author’s instructions" below to get immediate access to Dynamic Trend Hunter & the rest of the “Quantigenics Premium Indicator Suite”.
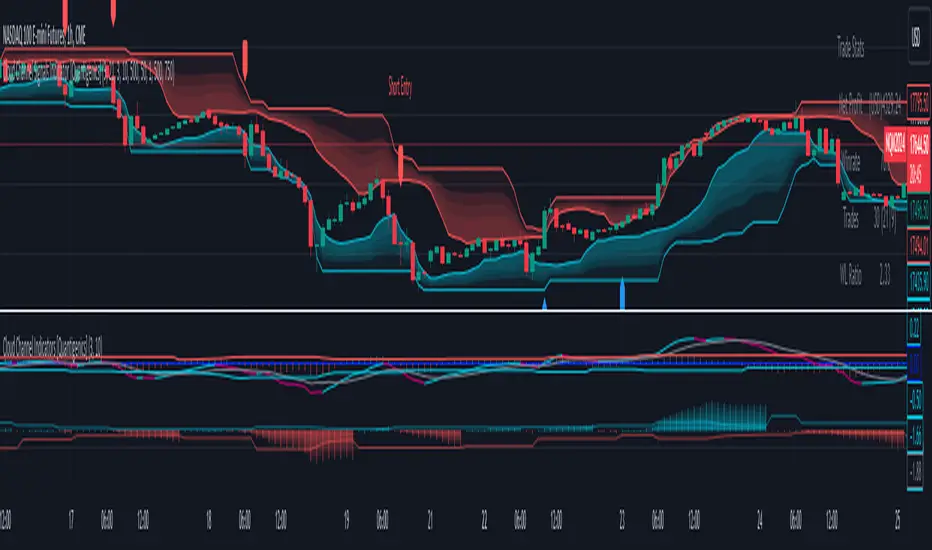
Cloud Channel Signals Indicator [Quantigenics]The Cloud Channel Signals script is a key element of the Cloud Channel Signal System. It primarily focuses on identifying breakout and reversal trades through a sophisticated cloud channel overlay. The script, designed for overlay on the price portion of charts, displays a “cloud-like” channel that signals potential breakout and reversal points around the candles/bars, offering insights into price movements, volatility, and potential support or resistance zones at the outer bands of the channel.
As with all of our scripts, the "Cloud Channel Signals" script, is designed to work on ANY symbol and time frame. The input parameters can be adjusted to fit your specific trading style.
Technical Composition :
Cloud Channel Construction : The Cloud Channel Signals Script is characterized by its innovative Cloud Channel, a proprietary formulation that advances beyond traditional channel calculations. This channel is not a mere adaptation of Bollinger Bands or Donchian Channels; it sets itself apart through a complex blend of calculations. While incorporating elements like standard deviation and high/low price ranges, it notably introduces EMA-based adjustments and integrates intricate mathematical models. This sophisticated algorithmic approach results in a channel that adeptly marks price extremes and dynamically adapts to market volatility and trend shifts. Enhanced by advanced statistical methods, the Cloud Channel offers nuanced insights into market behavior. Its configuration is based on specific range calculations derived from price fluctuations over a defined period, paired with an evolved standard deviation method. This results in a multifaceted analytical tool that surpasses typical channel indicators in depth and sophistication, providing traders with a comprehensive, nuanced view of support and resistance areas.
Signal Generation Mechanism :
> Breakout Signals :
The script identifies breakout signals by assessing price crossover relative to a dynamically constructed channel. This channel is derived from a blend of moving averages and price extremes over a specified period. Oscillator crossovers aid in confirming breakout signals. These crossovers are determined by comparing the oscillator line, calculated as a difference between a transformed moving average and a kernel estimation, with a signal line derived from an exponential moving average of the oscillator.
> Reversal Signals :
Reversal signals are generated through mathematical analysis of price proximity to the channel's edges, which are calculated using a combination of EMA (Exponential Moving Average) values and the highest/lowest price points within a given time frame. The oscillator's role in identifying reversals involves assessing its value relative to its historical range, which is dynamically adjusted based on market conditions.
Oscillator Dynamics :
The oscillator is constructed using a combination of rational quadratic and Gaussian kernel functions applied to close prices. The length parameter of the oscillator controls the window of these calculations, impacting its responsiveness. The dynamic level adjustment in the oscillator is based on a calculated average of its peak and trough values over a specified period, offering adaptive sensitivity.
Channel Gradient Smoothness :
The gradient smoothness of the channel is a function of the variance between the channel's upper and lower bounds. This is visually represented through color intensity changes, reflecting the level of volatility and market momentum.
Trend Bias Assessment :
Trend Bias is calculated using a combination of high/low averages and smoothed price data. This involves taking the average of the highest and lowest prices over a specified length, then applying an exponential moving average to this average for trend direction assessment. This mathematical assessment of trend direction complements the breakout and reversal signals by aligning them with the prevailing market trend.
How to Use the Cloud Channel Signals System :
Usage Considerations:
The script must be configured with precision to ensure it aligns with the trader’s strategy. This involves meticulous setting of channel lengths, oscillator parameters, and trend bias length. For effective application, it’s essential to synchronize the input parameters with the companion "Cloud Channel Indicators" script, ensuring a unified analytical perspective. The option to choose real-time vs. post-bar-closure signal generation offers flexibility in trading styles, catering to both aggressive and conservative trading approaches.
Integration with Cloud Channel Indicators script :
> Use the "Cloud Channel Signals" script alongside the "Cloud Channel Indicators" script for comprehensive market analysis. Ensure identical input parameters across both scripts for consistency.
> Note: The lower indicators are from the 'Cloud Channel Indicators' script, complementing the 'Cloud Channel Signals' script seen here, which generates the 'cloud' and signals on the price chart.
> The 'Cloud Channel Indicators” script can be found here:
Understanding On-Chart Signals :
The script displays entry signals directly on the chart, offering visual cues for both breakout and reversal trading opportunities. Traders can toggle the display of these signals for either breakout or reversal trades, allowing customization based on their trading strategy.
Identifying Entry Points :
> Breakout Trades : Enable 'Show Break Out Trades' to view signals where the price crosses the cloud channel, coupled with oscillator crossovers. A bullish breakout is indicated when the price crosses above the top channel, and a bearish breakout when it crosses below the bottom channel.
> Reversal Trades : Activate 'Show Reversal Trades' to identify potential reversal points. These are highlighted when the price rebounds from the cloud channel's edges, supported by oscillator and trend bias indicators.
Setting Stop Losses Using Outer Bands : Employ the outer bands of the cloud channel as dynamic stop-loss levels. Position stop losses below the lower band for long trades and above the upper band for short trades, adjusting as the bands shift with market conditions.
Executing and Managing Trades : Enter trades based on the script’s breakout or reversal signals, in line with your risk management rules.
Adjust stop-loss levels : Adjust stop-loss levels according to the outer band movements and exit the trade based on reversal signals or profit targets determined by significant support or resistance levels indicated by the cloud channel.
Customizable Alerts for Trading Efficiency :
Set up TradingView alerts to notify you of crucial trading signals like breakout or reversal opportunities, or when the price reaches critical levels defined by the cloud channel.
Adapting Strategy to Market Dynamics:
Input Parameter Settings :
Important Usage Guidance : For seamless integration with its counterpart, the "Cloud Channel Indicators" script, it's crucial to align the input parameter settings across both scripts. When adjusting values from their defaults, ensure that corresponding parameters in both scripts are identically set. This synchronization is key to achieving a cohesive and accurate representation on your charts.
Intra-Bar Order Generation (IntraBar) : Allows traders to choose if signals are generated within the current bar (real-time) or after the bar closes, providing flexibility in signal timing.
Show Break Out/Reversal Trades (BreakOutTrades, ReversalTrades) : Enables traders to toggle the visibility of specific trade types - breakout or reversal trades - on the chart.
Show Text Labels (ShowSignalLabels) : Option to display text labels for signals, enhancing the clarity and readability of the chart.
Inner/Outer Channel Length (InnerChannelLength, OutterChannelLength) : Sets the calculation periods for the inner and outer channels, affecting the sensitivity and responsiveness of the cloud channel.
Oscillator Length (OscillatorLength) : Determines the length for the precision oscillator calculation, impacting its sensitivity to market movements.
Top/Bottom Level (TopLevel, BottomLevel) : Establishes the upper and lower bounds for the oscillator, used to identify overbought and oversold conditions.
Use Dynamic Level (Dynamic_Level_OnOff) : Provides an option to use dynamic levels in the oscillator, for a more adaptive and responsive analysis.
Trend Bias Length (TrendBiasLength) : Adjusts the period for the Trend Bias calculation, crucial for understanding the overall market trend.
Top/Bottom Channel Color (TopChannelColor, BottomChannelColor) : Customization options for the color of the top and bottom channels.
Smoothness of The Gradient (Smoothness) : Controls the smoothness level of the channel's gradient, allowing for visual customization.
Alert Setting Guidance :
The script includes a versatile alert system for notifying traders of critical trading signals:
Breakout and Reversal Trade Alerts : These alerts are activated for breakout and reversal signals based on the script’s analysis, which can be crucial for timely entries and exits.
Custom Alert Conditions : Traders can set up alerts in TradingView’s system to get notified under specific conditions, like when a new signal (arrow up/down) appears on the chart, tailoring the alerts to their trading strategies.
The "Cloud Channel Signals " script offers a valuable tool for traders looking to capitalize on breakout and reversal opportunities. Its advanced channel and oscillator settings, combined with customizable alert options, make it a valuable addition to any trader's arsenal. Users are encouraged to explore these settings to fully leverage the script's capabilities, keeping in mind that trading involves risks and past performance does not guarantee future results. For optimal results, this script is designed to be used in conjunction with the "Cloud Channel Indicators .
You can see the “Author’s instructions" below to get immediate access to Cloud Channel Signals Indicators & the rest of the “Quantigenics Premium Indicator Suite”.
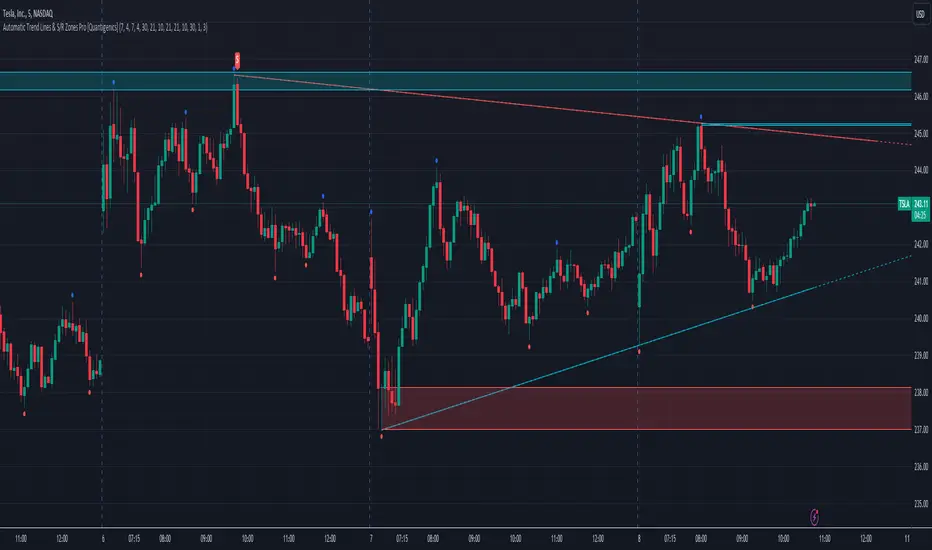
Automatic Trend Lines & S/R Zones Pro [Quantigenics]The “Automatic Trend Lines & S/R Zones Pro ” script is an innovative tool that integrates automated support and resistance zone identification with trend line generation. This script is an invaluable asset in technical analysis, adeptly identifying critical price reversal or breakout areas and drawing trend lines to gauge market direction and momentum. It generates trading signals based on support/resistance and trend line dynamics, making it a versatile standalone or complementary tool suitable for any market or time frame.
The "Automatic Trend Lines & S/R Zones Pro " script performs advanced financial chart analysis by algorithmically identifying support/resistance zones and generating trend lines It analyzes historical data, applying calculations like the highest and lowest price points over specified periods (defined by 'PeakOverBar' and 'LowOverBar' settings) to determine potential support and resistance zones. Trend lines are drawn by connecting significant price peaks and troughs, calculated based on user-defined strength parameters. The script also produces trading signals by analyzing price interactions with these zones and trend lines, using algorithms to detect breakouts or rejections, thus aiding traders in informed decision-making.
Technical Composition: a
Support and Resistance Zone Detection : Mechanism: Utilizes historical price data to identify key levels indicative of intense trading activity, revealing potential price stalling or reversals. These levels are marked based on past market actions and supply-demand dynamics.
Visualization: Zones are highlighted with colored boxes, enabling traders to easily spot shifts in market sentiment.
Automatic Trend Line Generation : Methodology: Connects significant price highs and lows over a designated period, customizable through inputs like PeakOverBar and LowOverBar.
Utility : These trend lines act as crucial indicators of uptrend support and downtrend resistance, aiding in the recognition of potential breakout or reversal zones and trend directions.
Customization and Flexibility : Adjustable Parameters: Includes customization options for peak/trough identification periods, trend line visibility, and extent of support/resistance zones.
Enhanced User Experience : Designed to be intuitive and adaptable, catering to diverse trading styles and strategies.
Usage in Trading :
Entry and Exit Points: The trade signals plotted at the support/resistance zones can be used for identifying both entry and exit points, in anticipation of price stalling and potentially reversing, and breakout signals plotted as price breaks trendlines can be used for breakout trading strategies, as well as stop loss areas.
Signal Alerts: Real-time alerts for significant interactions with trend lines or S/R zones, vital for both entry and exit strategies.
Integration with Other Systems: While effective as a standalone tool, it can also be used alongside other indicators for a more robust trading method.
Input Parameter Settings :
Intra-Bar Signal Generation (IntraBar) : Allows toggling between immediate signal generation within the current bar or after bar closure.
Peak and Low Over Bar (PeakOverBar, LowOverBar) : Sets the bar count for identifying market peaks and lows, adjustable for analyzing different market trends.
Strongest Peaks and Lows Period (StrongestFromPeaks, StrongestFromLows) : Determines the period for identifying significant market peaks and lows.
Show S/R Zones (ShowSRZones) : Enables the display of Support/Resistance zones for better market insight.
Trend Line Type (TrendLineType) : Offers options for trend line styles, like "One Line" or "Triple Lines."
Extend Trend Lines (ExtendTrendLines) : Configures the extension length of trend lines, useful for predicting future trends.
Peak and Low Trend Line Settings (ShowPeakTrendLine, ShowLowTrendLine, etc.) : Manage the display and characteristics of specific trend lines.
Signal Settings (ShowLabels, ShowBreakSignals, ShowPopUPSignals, etc.) : Customizes the appearance and frequency of signals and alerts.
Alert Settings (ShowTrendBreakSignals, ShowTrendPopSignals, etc.) : Configures alerts for significant market events like trend line breaks or rejections.
The "Automatic Trend Lines & S/R Zones Pro" script stands out as an essential tool for traders, offering comprehensive support/resistance and trend line analysis in a single package. Its automatic features, combined with customizable options, make it a key element in elevating market analysis and informed trading decision-making.
As always, remember that trading involves risks and past performance is not indicative of future results.
You can see the “Author’s instructions below to get immediate access to Automatic Trend Lines & S/R Zones Pro & the rest of the “Quantigenics Premium Indicator Suite”.
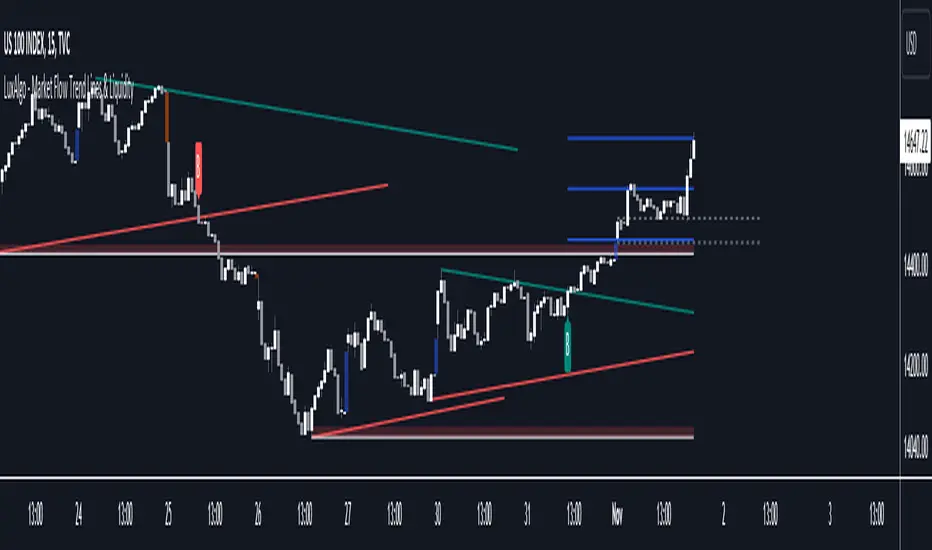
Market Flow Trend Lines & Liquidity [LuxAlgo]The Market Flow Trend Lines & Liquidity indicator is a script that aims to automate key insights such as trend lines, liquidity zones, opening ranges, & gaps on the chart. The aim of this script is to provide a functional breakout trader toolkit with various familiar tools as well as unique capabilities to further improve the user experience.
🔶 USAGE
There are various methods for using the features within this script, even with the included take profit levels users can pre-define.
The dotted lines represent an Opening Range with levels we can use as support & resistance. This opening range can be traded within the levels; however, it can also be used to tell the sentiment of price to see how it reacts to it.
In the image below, we can see after price was holding above the Opening Range whilst printing bullish trendline breakout signals, it made its way to the TP level we enabled from within the indicator to calculate a potential level for taking profits in a breakout trade.
The Market Flow Trend Lines & Liquidity indicator's key feature reside within its multi-timeframe capabilities for the main trendlines, as well as its key zones for potential entries.
In the image above we can see multiple areas where multi-timeframe (1H) trendlines on the 30m chart acted as support & resistance, alongside the Liquidity Zones & Opening Range as optimal points of interest for a breakout trader.
🔶 SETTINGS
🔹 Trendlines
Trendlines Lookback: Determines the frequency of detected tops/bottoms used to construct trendlines.
Slope: Trendlines slope, with higher values returning steeper trendlines.
Timeframe: Trendline timeframe.
🔹 Liquidity Zones
Liquidity Lookback: Determines the frequency of detected tops/bottoms used to construct liquidity zones.
🔹 Take Profits
Take profit settings. Up to 3 ATR based take profits can be enabled, with a numerical setting controlling the ATR multiplier.
🔹 Opening Range
From Time: 15min opening range starting time.
Extend: Extension length of Opening Range lines (in bars).
🔹 Gap Imbalance
Gap Up: Display upward gaps.
Gap Down: Display downward gaps.
🔹 EMA
Show EMA: Displays an EMA on the chart.
EMA Length: Length of the displayed EMA.
🔶 RELATED SCRIPTS
Liquidity Swings
Trendlines with Breaks
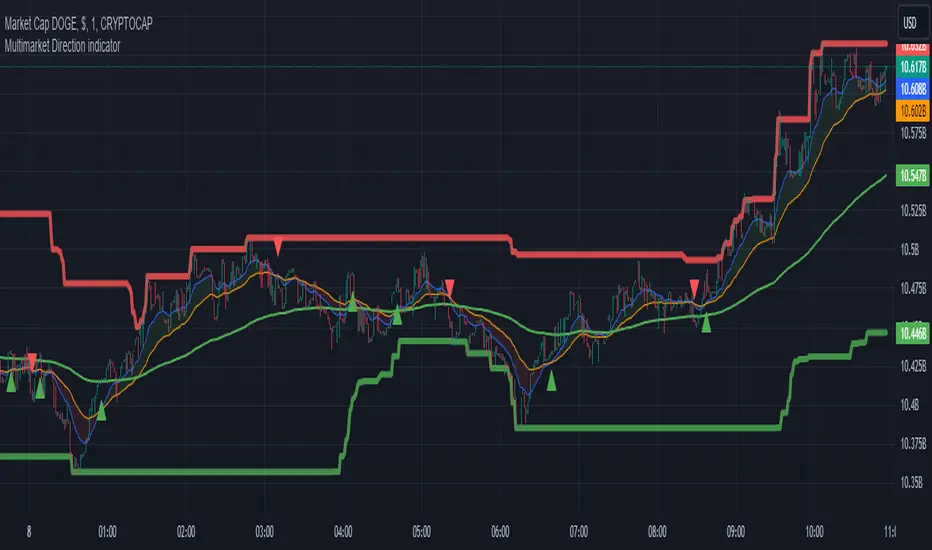
Multimarket Direction indicatorTrendline trading with resistant and support made by me.
Im bad coder and just jump into the tradingview pine script 1 days before so please don't hates me
- I don't know why my script is ded before lol
Signals to trade up
1. The big candles up cross the ema200 (last 5 candles for confirmation)
2. Wait for showing the up triangle.
3. Lookup the resistant/support line. If near the resistant please consider to wait if it break then join the trade
4. Only out trade when it has a down triagle or the candles has big down candles at the resistant/support line.
That it...
Martingale + Grid DCA Strategy [YinYangAlgorithms]This Strategy focuses on strategically Martingaling when the price has dropped X% from your current Dollar Cost Average (DCA). When it does Martingale, it will create a Purchase Grid around this location to likewise attempt to get you a better DCA. Likewise following the Martingale strategy, it will sell when your Profit has hit your target of X%.
Martingale may be an effective way to lower your DCA. This is due to the fact that if your initial purchase; or in our case, initial Grid, all went through and the price kept going down afterwards, that you may purchase more to help lower your DCA even more. By doing so, you may bring your DCA down and effectively may make it easier and quicker to reach your target profit %.
Grid trading may be an effective way of reducing risk and lowering your DCA as you are spreading your purchases out over multiple different locations. Likewise we offer the ability to ‘Stack Grids’. What this means, is that if a single bar was to go through 20 grids, the purchase amount would be 20x what each grid is valued at. This may help get you a lower DCA as rather than creating 20 purchase orders at each grid location, we create a single purchase order at the lowest grid location, but for 20x the amount.
By combining both Martingale and Grid DCA techniques we attempt to lower your DCA strategically until you have reached your target profit %.
Before we start, we just want to make it known that first off, this Strategy features 8% Commission Fees, you may change this in the Settings to better reflect the Commission Fees of your exchange. On a similar note, due to Commission Fees being one of the number one profit killers in fast swing trade strategies, this strategy doesn’t focus on low trades, but the ideology of it may result in low amounts of trades. Please keep in mind this is not a bad thing. Since it has the ability to ‘Stack Grid Purchases’ it may purchase more for less and result in more profit, less commission fees, and likewise less # of trades.
Tutorial:
In this example above, we have it set so we Martingale twice, and we use 100 grids between the upper and lower level of each martingale; for a total of 200 Grids. This strategy will take total capital (initial capital + net profit) and divide it by the amount of grids. This will result in the $ amount purchased per grid. For instance, say you started with $10,000 and you’ve made $2000 from this Strategy so far, your total capital is $12,000. If you likewise are implementing 200 grids within your Strategy, this will result in $12,000 / 200 = $60 per grid. However, please note, that the further down the grid / martingale is, the more volume it is able to purchase for $60.
The white line within the Strategy represents your DCA. As the Strategy makes purchases, this will continue to get lower as will your Target Profit price (Blue Line). When the Close goes above your Target Profit price, the Strategy will close all open positions and claim the profit. This profit is then reinvested back into the Strategy, which may exponentially help the Strategy become more profitable the longer it runs for.
In the example above, we’ve zoomed in on the first example. In this we want to focus on how the Strategy got back into the trades shortly after it sold. Currently within the Settings we have it set so our entry is when the Lowest with a length of 3 is less than the previous Lowest with a length of 3. This is 100% customizable and there are multiple different entry options you can choose from and customize such as:
EMA 7 Crossover EMA 21
EMA 7 Crossunder EMA 21
RSI 14 Crossover RSI MA 14
RSI 14 Crossunder RSI MA 14
MFI 14 Crossover MFI MA 14
MFI 14 Crossunder MFI MA 14
Lowest of X Length < Previous Lowest of X Length
Highest of X Length > Previous Highest of X Length
All of these entry options may be tailored to be checked for on a different Time Frame than the one you are currently using the Strategy on. For instance, you may be running the Strategy on the 15 minute Time Frame yet decide you want the RSI to cross over the RSI MA on the 1 Day to be a valid entry location.
Please keep in mind, this Strategy focuses on DCA, this means you may not want the initial purchase to be the best location. You may want to buy when others think it is a good time to sell. This is because there may be strong bearish momentum which drives the price down drastically and potentially getting you a good DCA before it corrects back up.
We will continue to add more Entry options as time goes on, and if you have any in mind please don’t hesitate to let us know.
Now, back to the example above, if we refer to the Yellow circle, you may see that the Lowest of a length of 3 was less than its previous lowest, this triggered the martingales to create their grids. Only a few bars later, the price went into the first grid and went a little lower than its midpoint (Yellow line). This caused about 60% of the first grid to be purchased. Shortly after the price went even lower into this grid and caused the entire first martingale grid to be purchased. However, if you notice, the white line (your DCA) is lower than the midpoint of the first grid. This is due to the fact that we have ‘Stack Grid Purchases’ enabled. This allows the Strategy to purchase more when a single bar crosses through multiple grid locations; and effectively may lower your average more than if it simply executed a purchase order at each grid.
Still looking at the same location within our next example, if we simply increase the Martingale amount from 2 to 3 we can see something strange happens. What happened is our Target Profit price was reached, then our entry condition was met, which caused all of the martingale grids to be formed; however, the price continued to increase afterwards. This may not be a good thing, sure the price could correct back down to these grid locations, but what if it didn’t and it just kept increasing? This would result in this Strategy being stuck and unable to make any trades. For this reason we have implemented a Failsafe in the Settings called ‘Reset Grids if no purchase happens after X bars’.
We have enabled our Failsafe ‘Reset Grids if no purchase happens after X bars’ in this example above. By default it is set to 100 bars, but you can change this to whatever works best for you. If you set it to 0, this Failsafe will be disabled and act like the example prior where it is possible to be stuck with no trades executing.
This Failsafe may be an important way to ensure the Strategy is able to make purchases, however it may also mean the Grids increase in price when it is used, and if a massive correction were to occur afterwards, you may lose out on potential profit.
This Strategy was designed with WebHooks in mind. WebHooks allow you to send signals from the Strategy to your exchange. Simply set up a Custom TradingView Bot within the OKX exchange or 3Commas platform (which has your exchange API), enter the data required from the bot into the settings here, select your bot type in ‘Webhook Alert Type’, and then set up the alert. After that you’re good to go and this Strategy will fully automate all of its trades within your exchange for you. You need to format the Alert a certain way for it to work, which we will go over in the next example.
Add an alert for this Strategy and simply modify the alert message so all it says is:
{{strategy.order.alert_message}}
Likewise change from the Alert ‘Settings’ to Alert ‘Notifications’ at the top of the alert popup. Within the Notifications we will enable ‘Webhook URL’ and then we will pass the URL we are sending the Webhook to. In this example we’ve put OKX exchange Webhook URL, however if you are using 3Commas you’ll need to change this to theirs.
OKX Webhook URL:
www.okx.com
3Commas Webhook URL:
app.3commas.io
Make sure you click ‘Create’ to actually create this alert. After that you’re all set! There are many Tutorials videos you can watch if you are still a little confused as to how Webhook trading works.
Due to the nature of this Strategy and how it is designed to work, it has the ability to never sell unless there it will make profit. However, because of this it also may be stuck waiting in trades for quite a long period of time (usually a few months); especially when your Target Profit % is 15% like in the example above. However, this example above may be a good indication that it may maintain profitability for a long period of time; considering this ‘Deep Backtest’ is from 2017-8-17.
We will conclude the tutorial here. Hopefully you understand how this Strategy has the potential to make calculated and strategic DCA Grid purchases for you and then based on a traditional Martingale fashion, bulk sell at the desired Target Profit Percent.
Settings:
Purchase Settings:
Only Purchase if its lower than DCA: Generally speaking, we want to lower our Average, and therefore it makes sense to only buy when the close is lower than our current DCA and a Purchase Condition is met.
Purchase Condition: When creating the initial buy location you must remember, you want to Buy when others are Fearful and Sell when others are Greedy. Therefore, many of the Buy conditions involve times many would likewise Sell. This is one of the bonuses to using a Strategy like this as it will attempt to get you a good entry location at times people are selling.
Lower / Upper Change Length: This Lower / Upper Length is only used if the Purchase Condition is set to 'Lower Changed' or 'Upper Changed'. This is when the Lowest or Highest of this length changes. Lowest would become lower or Highest would become higher.
Purchase Resolution: Purchase Resolution is the Time Frame that the Purchase Condition is calculated on. For instance, you may only want to start a new Purchase Order when the RSI Crosses RSI MA on the 1 Day, but yet you run this Strategy on the 15 minutes.
Sell Settings:
Trailing Take Profit: Trailing Take Profit is where once your Target Profit Percent has been hit, this will trail up to attempt to claim even more profit.
Target Profit Percent: What is your Target Profit Percent? The Strategy will close all positions when the close price is greater than your DCA * this Target Profit Percent.
Grid Settings:
Stack Grid Purchases: If a close goes through multiple Buy Grids in one bar, should we amplify its purchase amount based on how many grids it went through?
Reset Grids if no purchase happens after X Bars: Set this to 0 if you never want to reset. This is very useful in case the price is very bullish and continues to increase after our Target Profit location is hit. What may happen is, Target Profit location is hit, then the Entry condition is met but the price just keeps increasing afterwards. We may not want to be sitting waiting for the price to drop, which may never happen. This is more of a failsafe if anything. You may set it very large, like 500+ if you only want to use it in extreme situations.
Grid % Less than Initial Purchase Price: How big should our Buy Grid be? For instance if we bought at 0.25 and this value is set to 20%, that means our Buy Grid spans from 0.2 - 0.25.
Grid Amounts: How many Grids should we create within our Buy location?
Martingale Settings:
Amount of Times 'Planned' to Martingale: The more Grids + the More Martingales = the less $ spent per grid, however the less risk. Remember it may be better to be right and take your time than risk too much and be stuck too long.
Martingale Percent: When the current price is this percent less than our DCA, lets create another Buy Grid so we can lower our average more. This will make our profit location less.
Webhook Alerts:
Webhook Alert Type: How should we format this Alert? 3Commas and OKX take their alerts differently, so please select the proper one or your webhooks won't work.
3Commas Webhook Alerts:
3Commas Bot ID: The 3Commas Bot ID is needed so we know which BOT ID we are sending this webhook too.
3Commas Email Token: The 3Commas Email Token is needed for your webhooks to work properly as it is linked to your account.
OKX Webhook Alerts:
OKX Signal Token: This Signal Token is attached to your OKX bot and will be used to access it within OKX.
If you have any questions, comments, ideas or concerns please don't hesitate to contact us.
HAPPY TRADING!

Confluence Buy-Sell Indicator with Fibonacci The script is a "Confluence Indicator with Fibonacci" designed to work on the TradingView platform. This indicator combines multiple technical analysis strategies to generate buy and sell signals based on user-defined confluence criteria. Here's a breakdown of its features:
Confluence Criteria: Users can enable or disable various strategies like MACD, RSI, Bollinger Bands, Divergence, Fibonacci, and Moving Average. The number of strategies that need to align for a signal to be generated can be set by the user.
Strategies Included:
MACD Strategy: Uses the Moving Average Convergence Divergence method to identify buy/sell opportunities.
RSI Strategy: Utilizes the Relative Strength Index to detect overbought or oversold conditions.
Bollinger Bands Strategy: Incorporates Bollinger Bands to identify volatility and potential buy/sell signals.
Divergence Strategy: A basic implementation that detects bullish and bearish divergences using the RSI.
Fibonacci Strategy: Uses Fibonacci retracement levels to determine potential support and resistance levels.
Moving Average Strategy: Employs a crossover system between the 50-period and 200-period simple moving averages.
Additional Features:
Support & Resistance: Identifies major support and resistance levels from the last 50 bars.
Pivot Points: Calculates pivot points to determine potential turning points.
Stop Loss Levels: Automatically calculates and plots stop-loss levels for buy and sell signals.
NYC Midnight Level: Option to display the New York City midnight price level.
Visualization: Plots buy and sell signals on the chart with green and red markers respectively.
Adequate Category:
"Technical Analysis Indicators & Overlays" or "Strategy & Scripting Tools".

Velocity and Acceleration SignalsThe "Velocity and Acceleration Signals" indicator is a versatile tool designed to provide traders with valuable insights into price momentum and acceleration. By harnessing the power of mathematics and visualization, this indicator helps traders make informed decisions in the fast-paced world of financial markets.
Crunching the Numbers: How It Works
At its core, the indicator relies on two key concepts: velocity and acceleration. Here's how it operates:
-- Velocity Calculation : The indicator takes a step back in time, considering a user-defined historical period (typically around 14 bars). It calculates the velocity of price movements during this period. Velocity represents the speed at which an asset's price is changing and is derived by examining how much the price has moved between bars. Specifically, it computes the rate of change in price over time.
-- Acceleration Calculation : Building upon velocity, the indicator goes one step further and calculates acceleration. Acceleration signifies how quickly the velocity is changing. It quantifies whether the price is speeding up or slowing down in its ascent or descent.
-- Smoothing with EMA : To enhance clarity and reduce noise, the indicator smooths the velocity using an Exponential Moving Average (EMA) with a user-defined length. This smoothed velocity provides a more comprehensive view of the price momentum trend.
Visualizing Market Dynamics
The indicator doesn't just crunch numbers; it also paints a vivid picture of market sentiment:
-- Coloration : The indicator employs a color scheme to visualize market conditions. It uses lime for positive acceleration and fuchsia for negative acceleration. The color green represents positive smoothed velocity, while red denotes negative smoothed velocity. A gray hue signals a neutral or transitional phase.
-- Plotting Velocity and Acceleration : The indicator provides visual representations of both smoothed velocity and acceleration. Smoothed velocity is depicted as columns, with green or red coloring indicating the direction. Acceleration is displayed as a histogram, with lime or fuchsia bars showcasing bullish or bearish momentum. A gray zero line offers a reference point for changes in momentum direction.
-- Strong Up and Strong Down Conditions : For traders seeking distinctive signals, the indicator identifies "Strong Up" and "Strong Down" conditions. A "Strong Up" occurs when smoothed velocity crosses above a user-defined threshold, coupled with positive acceleration. Conversely, a "Strong Down" emerges when smoothed velocity crosses below another threshold, accompanied by negative acceleration. These conditions are marked with prominent triangular shapes.
Unlocking Trading Potential
Now, let's explore how traders can leverage the indicator:
-- Trend Confirmation : Traders can use this indicator to validate the prevailing market trend. A robust smoothed velocity, combined with acceleration in the same direction, can confirm the current trend.
-- Contrarian Signals : Extreme conditions signaled by a strong crossover or crossunder of the smoothed velocity threshold, along with appropriate acceleration, can hint at potential trend reversals.
-- Divergence Analysis : Savvy traders can employ this indicator to identify divergences between price movements and momentum. If the price exhibits higher highs while the indicator shows lower highs (or vice versa), it may signify a weakening or strengthening trend.
Navigating Limitations
As with any trading tool, it's essential to acknowledge the indicator's limitations:
-- Lookback Period : The indicator's effectiveness may vary based on the chosen historical period. Longer periods smooth out fluctuations but may lag in capturing recent changes in sentiment.
-- Threshold Sensitivity : Interpreting threshold crossovers or crossunders can be subjective. Traders should carefully fine-tune these threshold values based on their trading strategy and market conditions.
-- Context Matters : The indicator focuses solely on velocity and acceleration signals and does not incorporate other critical factors such as trading volume, market news, or fundamental analysis. Therefore, traders should use it in conjunction with additional indicators and analysis techniques.
While the primary focus is on trend and momentum analysis, this indicator indirectly provides information about volatility as well. Rapid changes in velocity and acceleration can indicate increasing volatility in the market, which may be of interest to traders looking for opportunities during volatile conditions.
However, this indicator doesn't directly measure volume. To incorporate volume analysis into your trading strategy, you may want to combine this indicator with volume-based indicators or consider other tools specifically designed for volume analysis.
In conclusion, this indicator is a valuable ally for traders looking to decode market dynamics and make data-driven trading decisions. While it offers powerful insights, it's crucial to recognize its limitations and deploy it as part of a comprehensive trading strategy.
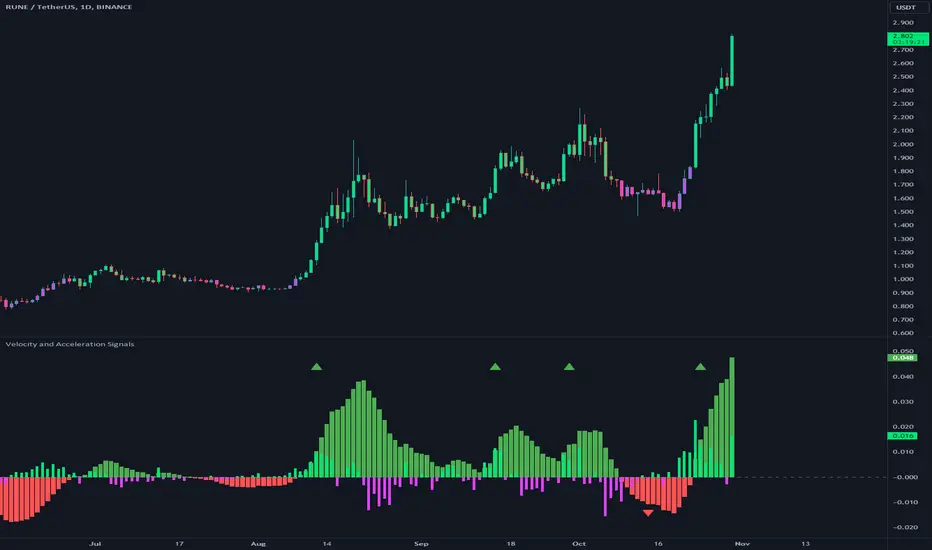
Breakout/Breakdown Indicator (30 Min Range) by InvestYourAsset👉The indicator provided here is a technical analysis indicator for TradingView users that identifies potential breakout and breakdown opportunities on the initial 30-minute range in every trading session.
👉The indicator high and low of the initial 30-minute period and plotting them as horizontal lines on the chart. The high is marked in green line and the low is marked in red line.
📈The indicator then generates buy and sell signals based on whether the current close price crosses above or below the previous 30-minute high and low, respectively.
📢The indicator also has two inputs:
👉 sessionStartHour : The hour at which the trading session begins. The default value is 9, However users can change the time according to their own trading style.
👉 sessionStartMinute : The minute at which the trading session begins. The default value is 0.
These inputs can be used to adjust the indicator to the specific trading session that you are interested in.
✅How to use the Indicator:
👉To use the 30 Minute Breakout/Breakdown Indicator, simply add it to your chart and configure the inputs to your liking. Once the indicator is added to the chart, it will plot the 30-minute high and low as horizontal lines, as well as generate buy and sell signals based on the current close price.
✅Here is a step-by-step guide:
📈Open TradingView and select the chart that you want to add the indicator to.
📈Click on the "Indicators" tab and search for "30 Minute Breakout/Breakdown Indicator by InvestYourAsset".
📈Click on the indicator to add it to your chart.
📈Configure the inputs to your liking. The default values are typically fine, but you can experiment with different values to see what works best for you.
📈Once you are satisfied with the settings, click on the "Apply" button.
📈The indicator will now be displayed on your chart. You will see two horizontal lines representing the previous 30-minute high and low, as well as triangles representing buy and sell signals.
✅How to interpret the signals:
📈Buy signal : A buy signal is generated when the current close price crosses above the previous 30-minute high. This suggests that the price is likely to continue moving higher in the short term.
📈Sell signal : A sell signal is generated when the current close price crosses below the previous 30-minute low. This suggests that the price is likely to continue moving lower in the short term.
👉Traders should remember that the present indicator is just one tool that can be used to identify potential trading opportunities. It is important to use other technical analysis tools and risk management techniques to confirm your trading signals before entering any trades.
✅Things to consider while using the indicator:
📈Look for buy signals in an uptrend and sell signals in a downtrend. This will increase the likelihood of your trades being successful.
📈Place your stop losses below the previous 30-minute low for buy signals and above the previous 30-minute high for sell signals. This will help to limit your losses if the trade goes against you.
📈Consider taking profits at key resistance and support levels. This will help you to lock in your profits and avoid giving them back to the market.
Follow us for timely updates regarding indicators that we may publish in future and give it a like if you appreciate the indicator.

Trend Lines [LuxAlgo]Our new "Trend Lines" indicator detects and highlights relevant trendlines on the user chart while keeping it free of as much clutter as possible.
The indicator is thought for real-time usage and includes several filters as well as the ability to estimate trendline angles.
🔶 USAGE
Trendlines can act as support/resistance, with a higher number of tests indicating a more significant support/resistance role.
A broken TrendLine can be indicative of a potential trend reversal. The script highlights breaks with a label.
Users can additionally filter trendlines, only showing trendlines whose angles fall within a user set range:
This allows for the removal of potential clutter from the chart but also helps keep steeper or more horizontal trendlines.
🔶 DETAILS
When a swing (pivot point) is found, a Trendline is drawn when certain conditions are fulfilled.
An essential condition is that a Bearish Trendline (red) always occurs on a lower high, while a Bullish Trendline (blue) occurs on a higher low.
Our implementation will first show an initial dotted-styled TrendLine on confirmation, after which a solid-styled secondary TrendLine will develop. The latter will be used for the real-time detection of breaks at that line:
Furthermore, the script allows you to add more conditions:
🔹 Length (Swings)
A swing develops when a high/low is the highest/lowest against x highs/lows on the left AND right of that bar. x can be set by "Length" in settings.
The following images clarify this. The script confirms a swing where the yellow flag is shown; the high (here visualized with a purple label) is the highest point against x bars left and right of that point.
At that moment, this swing is checked against the previous swing. If all conditions are fulfilled, an initial TrendLine is drawn on confirmation.
After that point, a secondary thicker solid line is seen which keeps progressing bar after bar, until:
• a new TrendLine is formed
• the TrendLine is broken
🔹 Breaks between Swings
Once there is confirmation that a TrendLine can be drawn, the script allows you to filter for breakthroughs on that line. This can be set with "Check breaks between"
Disabled : the initial TrendLine is allowed to be pierced:
Check breaks between point A - point B : no breaks are allowed between both Swing points:
Point A - Current bar : no breaks are allowed between the first Swing point and the point of confirmation ('current' bar):
🔹 TrendLine breaks
As mentioned, the secondary TrendLine (solid line) progresses bar after bar until a new TrendLine is formed or the TrendLine is broken. When a TrendLine is broken, the TrendLine stops progressing, but if there isn't a new TrendLine and price return back, the TrendLine will re-appear, potentially giving several signals when the TrendLine is broken again.
Minimal bars allow you to regulate the amount of signals when the TrendLine is broken.
-> The secondary TrendLine must be uninterrupted for at least x bars before a potential break can be considered.
The following example shows 1 signal against 3 by adjusting this setting from 2 to 5:
🔹 Angles
Angles should normally be calculated when the units of the X and Y axis are the same. However, on our charts, the unit of the X-axis is bar_index (bars), and on the Y-axis the unit is price (¥, €, £, $,...).
It is not easy to normalize and create reasonably valid angles. Often certain angle calculations can differ through price changes or volatility.
Our calculate_slope() function tries to make corresponding angles through all bars.
We do this by calculating the difference between the highest/lowest price values in a certain bar range. The bar range is our X-axis, and the price difference is our Y-axis.
Zooming in/out will not change the amount of bars or the price. Since it does change our view on the chart, and thereby how we see the angles, we have included a setting where you can personalize the ratio between X and Y-axis (Angles -> Ratio X-Y axis).
Settings: Angles - Ratio X-Y axis:
🔶 SETTINGS
🔹 Swings
Length: Lookback period for the detection of swing points.
🔹 Trendline validation
Check breaks between :
Disabled : the initial TrendLine is allowed to be pierced
Check breaks between point A - point B : no breaks are allowed between both Swing points
Point A - Current bar : no breaks are allowed between the first Swing point and the point of confirmation ('current' bar)
Source (breaks) : Source which invalidates TrendLine, default: close
🔹 TrendLine breaks
Minimal bars : The secondary TrendLine must be uninterrupted for at least x bars before a potential break can be considered.
🔹 Angles
Show : Toggle labels.
Ratio X-Y axis : Every user has his preferences regarding zoom, chart layout,...
If the shown angles are not according to your expectations, you can adjust this number.
Only TrendLine between : Only allow TrendLines between the minimum and maximum degrees. Set only the minimal and maximum values above 0.

Machine Learning: Donchian DCA Grid Strategy [YinYangAlgorithms]This strategy uses a Machine Learning approach on the Donchian Channels with a DCA and Grid purchase/sell Strategy. Not only that, but it uses a custom Bollinger calculation to determine its Basis which is used as a mild sell location. This strategy is a pure DCA strategy in the sense that no shorts are used and theoretically it can be used in webhooks on most exchanges as it’s only using Spot Orders. The idea behind this strategy is we utilize both the Highest Highs and Lowest Lows within a Machine Learning standpoint to create Buy and Sell zones. We then fraction these zones off into pieces to create Grids. This allows us to ‘micro’ purchase as it enters these zones and likewise ‘micro’ sell as it goes up into the upper (sell) zones.
You have the option to set how many grids are used, by default we use 100 with max 1000. These grids can be ‘stacked’ together if a single bar is to go through multiple at the same time. For instance, if a bar goes through 30 grids in one bar, it will have a buy/sell power of 30x. Stacking Grid Buy and (sometimes) Sells is a very crucial part of this strategy that allows it to purchase multitudes during crashes and capitalize on sales during massive pumps.
With the grids, you’ll notice there is a middle line within the upper and lower part that makes the grid. As a Purchase Type within our Settings this is identified as ‘Middle of Zone Purchase Amount In USDT’. The middle of the grid may act as the strongest grid location (aside from maybe the bottom). Therefore there is a specific purchase amount for this Grid location.
This DCA Strategy also features two other purchase methods. Most importantly is its ‘Purchase More’ type. Essentially it will attempt to purchase when the Highest High or Lowest Low moves outside of the Outer band. For instance, the Lowest Low becomes Lower or the Higher High becomes Higher. When this happens may be a good time to buy as it is featuring a new High or Low over an extended period.
The last but not least Purchase type within this Strategy is what we call a ‘Strong Buy’. The reason for this is its verified by the following:
The outer bounds have been pushed (what causes a ‘Purchase More’)
The Price has crossed over the EMA 21
It has been verified through MACD, RSI or MACD Historical (Delta) using Regular and Hidden Divergence (Note, only 1 of these verifications is required and it can be any).
By default we don’t have Purchase Amount for ‘Strong Buy’ set, but that doesn’t mean it can’t be viable, it simply means we have only seen a few pairs where it actually proved more profitable allocating money there rather than just increasing the purchase amount for ‘Purchase More’ or ‘Grids’.
Now that you understand where we BUY, we should discuss when we SELL.
This Strategy features 3 crucial sell locations, and we will discuss each individually as they are very important.
1. ‘Sell Some At’: Here there are 4 different options, by default its set to ‘Both’ but you can change it around if you want. Your options are:
‘Both’ - You will sell some at both locations. The amount sold is the % used at ‘Sell Some %’.
‘Basis Line’ - You will sell some when the price crosses over the Basis Line. The amount sold is the % used at ‘Sell Some %’.
‘Percent’ - You will sell some when the Close is >= X% between the Lower Inner and Upper Inner Zone.
‘None’ - This simply means don’t ever Sell Some.
2. Sell Grids. Sell Grids are exactly like purchase grids and feature the same amount of grids. You also have the ability to ‘Stack Grid Sells’, which basically means if a bar moves multiple grids, it will stack the amount % wise you will sell, rather than just selling the default amount. Sell Grids use a DCA logic but for selling, which we deem may help adjust risk/reward ratio for selling, especially if there is slow but consistent bullish movement. It causes these grids to constantly push up and therefore when the close is greater than them, accrue more profit.
3. Take Profit. Take profit occurs when the close first goes above the Take Profit location (Teal Line) and then Closes below it. When Take Profit occurs, ALL POSITIONS WILL BE SOLD. What may happen is the price enters the Sell Grid, doesn’t go all the way to the top ‘Exiting it’ and then crashes back down and closes below the Take Profit. Take Profit is a strong location which generally represents a strong profit location, and that a strong momentum has changed which may cause the price to revert back to the buy grid zone.
Keep in mind, if you have (by default) ‘Only Sell If Profit’ toggled, all sell locations will only create sell orders when it is profitable to do so. Just cause it may be a good time to sell, doesn’t mean based on your DCA it is. In our opinion, only selling when it is profitable to do so is a key part of the DCA purchase strategy.
You likewise have the ability to ‘Only Buy If Lower than DCA’, which is likewise by default. These two help keep the Yin and Yang by balancing each other out where you’re only purchasing and selling when it makes logical sense too, even if that involves ignoring a signal and waiting for a better opportunity.
Tutorial:
Like most of our Strategies, we try to capitalize on lower Time Frames, generally the 15 minutes so we may find optimal entry and exit locations while still maintaining a strong correlation to trend patterns.
First off, let’s discuss examples of how this Strategy works prior to applying Machine Learning (enabled by default).
In this example above we have disabled the showing of ‘Potential Buy and Sell Signals’ so as to declutter the example. In here you can see where actual trades had gone through for both buying and selling and get an idea of how the strategy works. We also have disabled Machine Learning for this example so you can see the hard lines created by the Donchian Channel. You can also see how the Basis line ‘white line’ may act as a good location to ‘Sell Some’ and that it moves quite irregularly compared to the Donchian Channel. This is due to the fact that it is based on two custom Bollinger Bands to create the basis line.
Here we zoomed out even further and moved back a bit to where there were dense clusters of buy and sell orders. Sometimes when the price is rather volatile you’ll see it ‘Ping Pong’ back and forth between the buy and sell zones quite quickly. This may be very good for your trades and profit as a whole, especially if ‘Only Buy If Lower Than DCA’ and ‘Only Sell If Profit’ are both enabled; as these toggles will ensure you are:
Always lowering your Average when buying
Always making profit when selling
By default 8% commission is added to the Strategy as well, to simulate the cost effects of if these trades were taking place on an actual exchange.
In this example we also turned on the visuals for our ‘Purchase More’ (orange line) and ‘Take Profit’ (teal line) locations. These are crucial locations. The Purchase More makes purchases when the bottom of the grid has been moved (may dictate strong price movement has occurred and may be potential for correction). Our Take Profit may help secure profit when a momentum change is happening and all of the Sell Grids weren’t able to be used.
In the example above we’ve enabled Buy and Sell Signals so that you can see where the Take Profit and Purchase More signals have occurred. The white circle demonstrates that not all of the Position Size was sold within the Sell Grids, and therefore it was ALL CLOSED when the price closed below the Take Profit Line (Teal).
Then, when the bottom of the Donchian Channel was pushed further down due to the close (within the yellow circle), a Purchase More Signal was triggered.
When the close keeps pushing the bottom of the Buy Grid lower, it can cause multiple Purchase More Signals to occur. This is normal and also a crucial part of this strategy to help lower your DCA. Please note, the Purchase More won’t trigger a Buy if the Close is greater than the DCA and you have ‘Only Purchase If Lower Than DCA’ activated.
By turning on Machine Learning (default settings) the Buy and Sell Grid Zones are smoothed out more. It may cause it to look quite a bit different. Machine Learning although it looks much worse, may help increase the profit this Strategy can produce. Previous results DO NOT mean future results, but in this example, prior to turning on Machine Learning it had produced 37% Profit in ~5 months and with Machine Learning activated it is now up to 57% Profit in ~5 months.
Machine Learning causes the Strategy to focus less on Grids and more on Purchase More when it comes to getting its entries. However, if you likewise attempt to focus on Purchase More within non Machine Learning, the locations are different and therefore the results may not be as profitable.
PLEASE NOTE:
By default this strategy uses 1,000,000 as its initial capital. The amount it purchases in its Settings is relevant to this Initial capital. Considering this is a DCA Strategy, we only want to ‘Micro’ Buy and ‘Micro’ Sell whenever conditions are met.
Therefore, if you increase the Initial Capital, you’ll likewise want to increase the Purchase Amounts within the Settings and Vice Versa. For instance, if you wish to set the Initial Capital to 10,000, you should likewise can the amounts in the Settings to 1% of what they are to account for this.
We may change the Purchase Amounts to be based on %’s in a later update if it is requested.
We will conclude this Tutorial here, hopefully you can see how a DCA Grid Purchase Model applied to Machine Learning Donchian Channels may be useful for making strategic purchases in low and high zones.
Settings:
Display Data:
Show Potential Buy Locations: These locations are where 'Potentially' orders can be placed. Placement of orders is dependant on if you have 'Only Buy If Lower Than DCA' toggled and the Price is lower than DCA. It also is effected by if you actually have any money left to purchase with; you can't buy if you have no money left!
Show Potential Sell Locations: These locations are where 'Potentially' orders will be sold. If 'Only Sell If Profit' is toggled, the sell will only happen if you'll make profit from it!
Show Grid Locations: Displaying won't affect your trades but it can be useful to see where trades will be placed, as well as which have gone through and which are left to be purchased. Max 100 Grids, but visuals will only be shown if its 20 or less.
Purchase Settings:
Only Buy if its lower than DCA: Generally speaking, we want to lower our Average, and therefore it makes sense to only buy when the close is lower than our current DCA and a Purchase Condition is met.
Compound Purchases: Compounding Purchases means reinvesting profit back into your trades right away. It drastically increases profits, but it also increases risk too. It will adjust your Purchase Amounts for the Purchase Type you have set at the same % rate of strategy initial_capital to the amounts you have set.
Adjust Purchase Amount Ratio to Maintain Risk level: By adjusting purchase levels we generally help maintain a safe risk level. Basically we generally want to reserve X amount of % for each purchase type being used and relocate money when there is too much in one type. This helps balance out purchase amounts and ensure the types selected have a correct ratio to ensure they can place the right amount of orders.
Stack Grid Buys: Stacking Buy Grids is when the Close crosses multiple Buy Grids within the same bar. Should we still only purchase the value of 1 Buy Grid OR stack the grid buys based on how many buy grids it went through.
Purchase Type: Where do you want to make Purchases? We recommend lowering your risk by combining All purchase types, but you may also customize your trading strategy however you wish.
Strong Buy Purchase Amount In USDT: How much do you want to purchase when the 'Strong Buy' signal appears? This signal only occurs after it has at least entered the Buy Zone and there have been other verifications saying it's now a good time to buy. Our Strong Buy Signal is a very strong indicator that a large price movement towards the Sell Zone will likely occur. It almost always results in it leaving the Buy Zone and usually will go to at least the White Basis line where you can 'Sell Some'.
Buy More Purchase Amount In USDT: How much should you purchase when the 'Purchase More' signal appears? This 'Purchase More' signal occurs when the lowest level of the Buy Zone moves lower. This is a great time to buy as you're buying the dip and generally there is a correction that will allow you to 'Sell Some' for some profit.
Amount of Grid Buy and Sells: How many Grid Purchases do you want to make? We recommend having it at the max of 10, as it will essentially get you a better Average Purchase Price, but you may adjust it to whatever you wish. This amount also only matters if your Purchase Type above incorporates Grid Purchases. Max 100 Grids, but visuals will only be shown if it's 20 or less.
Each Grid Purchase Amount In USDT: How much should you purchase after closing under a grid location? Keep in mind, if you have 10 grids and it goes through each, it will be this amount * 10. Grid purchasing is a great way to get a good entry, lower risk and also lower your average.
Middle Of Zone Purchase Amount In USDT: The Middle Of Zone is the strongest grid location within the Buy Zone. This is why we have a unique Purchase Amount for this Grid specifically. Please note you need to have 'Middle of Zone is a Grid' enabled for this Purchase Amount to be used.
Sell:
Only Sell if its Profit: There is a chance that during a dump, all your grid buys when through, and a few Purchase More Signals have appeared. You likely got a good entry. A Strong Buy may also appear before it starts to pump to the Sell Zone. The issue that may occur is your Average Purchase Price is greater than the 'Sell Some' price and/or the Grids in the Sell Zone and/or the Strong Sell Signal. When this happens, you can either take a loss and sell it, or you can hold on to it and wait for more purchase signals to therefore lower your average more so you can take profit at the next sell location. Please backtest this yourself within our YinYang Purchase Strategy on the pair and timeframe you are wanting to trade on. Please also note, that previous results will not always reflect future results. Please assess the risk yourself. Don't trade what you can't afford to lose. Sometimes it is better to strategically take a loss and continue on making profit than to stay in a bad trade for a long period of time.
Stack Grid Sells: Stacking Sell Grids is when the Close crosses multiple Sell Grids within the same bar. Should we still only sell the value of 1 Sell Grid OR stack the grid sells based on how many sell grids it went through.
Stop Loss Type: This is when the Close has pushed the Bottom of the Buy Grid More. Do we Stop Loss or Purchase More?? By default we recommend you stay true to the DCA part of this strategy by Purchasing More, but this is up to you.
Sell Some At: Where if selected should we 'Sell Some', this may be an important way to sell a little bit at a good time before the price may correct. Also, we don't want to sell too much incase it doesn't correct though, so its a 'Sell Some' location. Basis Line refers to our Moving Basis Line created from 2 Bollinger Bands and Percent refers to a Percent difference between the Lower Inner and Upper Inner bands.
Sell Some At Percent Amount: This refers to how much % between the Lower Inner and Upper Inner bands we should well at if we chose to 'Sell Some'.
Sell Some Min %: This refers to the Minimum amount between the Lower Inner band and Close that qualifies a 'Sell Some'. This acts as a failsafe so we don't 'Sell Some' for too little.
Sell % At Strong Sell Signal: How much do we sell at the 'Strong Sell' Signal? It may act as a strong location to sell, but likewise Grid Sells could be better.
Grid and Donchian Settings:
Donchian Channel Length: How far back are we looking back to determine our Donchian Channel.
Extra Outer Buy Width %: How much extra should we push the Outer Buy (Low) Width by?
Extra Inner Buy Width %: How much extra should we push the Inner Buy (Low) Width by?
Extra Inner Sell Width %: How much extra should we push the Inner Sell (High) Width by?
Extra Outer Sell Width %: How much extra should we push the Outer Sell (High) Width by?
Machine Learning:
Rationalized Source Type: Donchians usually use High/Low. What Source is our Rationalized Source using?
Machine Learning Type: Are we using a Simple ML Average, KNN Mean Average, KNN Exponential Average or None?
Machine Learning Length: How far back is our Machine Learning going to keep data for.
k-Nearest Neighbour (KNN) Length: How many k-Nearest Neighbours will we account for?
Fast ML Data Length: What is our Fast ML Length?? This is used with our Slow Length to create our KNN Distance.
Slow ML Data Length: What is our Slow ML Length?? This is used with our Fast Length to create our KNN Distance.
If you have any questions, comments, ideas or concerns please don't hesitate to contact us.
HAPPY TRADING!

Manual Buy&Sell Alerts [Starbots]This is a simple Strategy created to help you manually execute open or close orders via Alerts on Exchanges or Platforms.
More and more Exchanges and Platforms allow Tradingview Alert trading and sometimes we come to a problem that we can not sell an open order on the exchanges other way than signaling a sell or buy from Tradingview Alerts.
This is a tool to solve that problem as your are able to manually:
- send alert on limit targets (Long limit target, Short limit target, Take Profit limit target, Stop Loss limit target)
- send alert when new live bar opens on the market (simple way for closing your open trades on the Exchange/Platform - it will sell your open Long/Short order after new live bar is opened on the market)
Functions:
- 🕛Start
Define a start time for strategy to open/close trades
- 🕐Stop Trading after your Order is Closed
If you wish to stop opening/closing trades after your first position is successfully closed keep this turned on. If you wish to keep opening/closing trades indefinitely when the conditions are met keep this turned off.
🏁Buy&Sell By Limit Target
-Buy Price
-Take Profit
-Stop Loss
-🟢Enable Long Limit Orders
-🔴Enable Short Limit Orders
If you enable Enable Long or Short limit orders you will be able to execute trades when the price reaches your limit target lines.
Please Note that if you turn on Shorting, your Take Profit limit target must be 'UNDER' your buy price and Stop Loss limit target must be 'ABOVE' your buy price.
Type in your limit values manually or re-apply the strategy to your chart to select limit targets again with a mouse - you can also drag the limit lines to your wanted areas.
(I recommend using low time-frame charts - 30s, 1minute for fast executions)
🏁Buy&Sell After New Bar Opens
-🟢Open Long
-Close Long on a new Open Bar
-🔴Open Short
-Close Short on a new Open Bar
This is a simple way for closing your open trade on Exchanges. If you select Open Long/Short and then Close Long/Short on a new Open bar it will sell your open order and send sell alert when the new bar is opened on the market. Choose your time-frame and execute immediate sell order when a new bar is opened. You can select low 15s-30s-1minute charts to quickly get a sell alert.
Alerts
Long Message
Short Message
Exit Long Message
Exit Short Message
You can type in your webhook alert messages in this inputs. Write this code in 'Message' when creating Alert for strategy to send your Buy/Sell messages from above inputs.
{{strategy.order.alert_message}}
If you trade on exchanges and use different dynamic alert message to trade from Strategies, then you can just leave Alert inputs empty and write down your message alert in 'Message' box when creating new alert normally.
>> Do not forget to also set order size and pyramiding in properties tab correctly in this case.
