Z-Score with Buy & Sell SignalsThis is my open-source indicator of z-score with buy and sell indicators.
I see there are other z-score indicators, I just am particular about how I like my z-scores calculated and so decided to make my own and add buy and sell signals to help guide me. And I figured I could share it openly here!
What is a Z-Score
A z-score is a statistical measures of the distance, in standard deviations, a value is from its given mean. It is expressed as a standard deviation (or SD). The further a value (in this case, a stock) is from their mean, the more likely a regression to the mean is possible (i.e. a return to the average). So if a stock is trading at 3 standard deviations away from its mean, then we can anticipate it wanting to regress back towards 1 to 0 standard deviations from its mean (i.e. sell off back to a value that brings it closer to that SD).
The inverse is true if it is trading below.
Z-Scores and Stocks
Stocks, like everything in nature, like to trade between -1 and +1 SD away from its mean. Anything above this, we can interpret that there is "stress" on the stock. Anything over 2.50 is tremendous stress on the stock and we can anticipate that it will want to revert to its mean in the near future and bring that value down to at least 1, ideally between the -0.5 and 0.5 range.
Please note, I set the standard VERY high for the indicator to issue a buy and sell signal (/=2.50). Lately with the volatility, stocks have been entering these ranges frequently and so there have been plenty of signals, but traditionally in a stable environment you may not get these signals. I set the bar extremely high because I want to avoid false buy and sell signals (you will still get them though, nothing is perfect!). So the value in this indicator is in interpreting the actual z-score itself, so please be sure you understand exactly what the Z-score is (see the description above).
How the indicator works
The indicator works by calculating the average Z-Score between a stocks high and low. This indicator will present the average deviation a stock has from its high and low average. The higher the Z-Score, the more "overbought" the stock is. The lower the z-score, the more "oversold" the stock is. It uses the previous 500 candles worth of data to calculate its SMA and its Standard deviation in order to calculate the z-score.
Anytime a stock trades 2.50 SDs or more above or below its mean, you will be presented with a Buy or Sell signal, as generally, statistically speaking, after something has travelled 2.50 SDs aware from its mean, there is an increased probability of a reversion happening.
You can use this indicator to determine whether the stock is trading within normal parameters or not and to help you in your analysis as to whether or not a stock could be shorted or longed.
I personally like this for swing trading on the 1 hour chart; however, this can be used on any time from 1 minute to 1 hour. It also allows you to track a stocks progress in its reversion to the mean.
Examples of it in Use:
Gold ETF (ARCA: GLD) on 1 minute
Dow Jones ETF (ARCA: DIA) on 1 minute (my favourite Stock!)
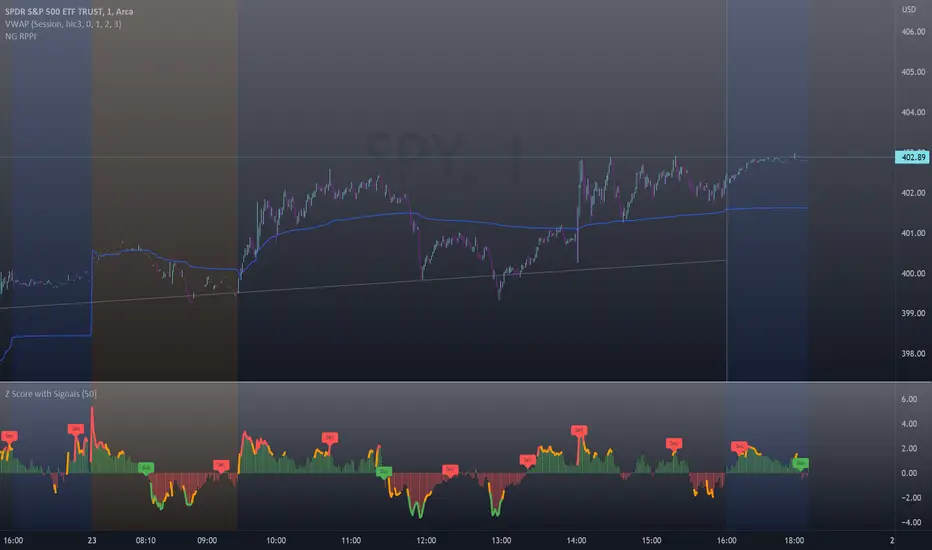
SPY ETF (ARCA: SPY) on 1 hour chart
Disclaimer:
This is not meant to be placed as a sole and single strategy. It should be used in COJUNCTION with your other strategies to help you make a determination.
No indicator is infallible and should never be relied on 100%!
Please let me know your questions/comments/experiences/recommendations below!
Thanks everyone!
Signals
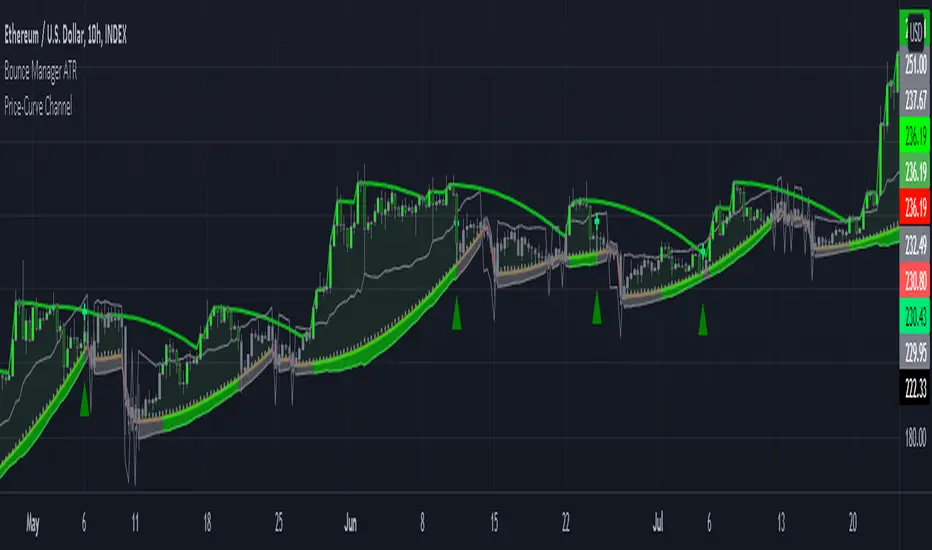
Bounce Manager ATRThis is a tool to turn any line or indicator into a signaller from bounces from the source line.
The ATR version is build to specify what would be considered a worthy entry from the line using ATR multiplier values as inputs.
COMPONENTS:
- Max violation: When price moves past this the script will no longer look for entry until a new trend has been established. The line can also be used as a stop loss.
- Confirmation line: When price touches the line during a trend it
will wait to cross over this line to confirm a reaction from the line.
- Min past distance: A trend filtering system, this is a distance from
the line price has to break to confirm trend direction.
- Stop loss: This can be set to a percentage distance from the low after
bounce. Or it can be set to the max violation line
- Take profit: This can be a fixed take profit target or a risk to reward
based take profit. With risk to reward it will multiply the stop loss
distance by the input and use that to create target (green cross)
- ATR based or % based: there are 2 versions of the script, one for strict
percentage based logic and another one based on ATR values
In bounce manager v1 these stop loss and take profit targets are there only for plotting and visual backtesting purposes. Right now it can only send long and short signals.
Part of the Honest Algo service.
Momentum 2.0 [AstrideUnicorn]Momentum 2.0 is a normalized Momentum oscillator with a moving base-level. The oscillator value is normalized by its standard deviation, similar to the z-score technique. Instead of the zero level, the indicator uses the base-level calculated as the inverted long-term average value of the oscillator. Similar to the zero-level crossing signal used for the Momentum oscillator, our oscillator calculates the base level crossing signal.
The moving base-level helps to reduce the number of false signals. In an uptrend the base-level is below zero, in a downtrend it is above it. This allows us to take into account the trend stability effect. In this case, to form a reversal signal, the oscillator must cross a lower value in an uptrend and a higher value in a downtrend.
HOW TO USE
When the oscillator crosses above the base-level, it gives a bullish signal, when below it gives a bearish signal. The signals are displayed as green and red labels, respectively.
The color of the histogram shows the current direction of the price momentum. Green indicates an upward move and red indicates a downward move. The blue line represents the base-level.
SETTINGS
Oscillator Period - determines the period of the Momentum oscillator
Base Level Period - determines the period used for long-term averaging when calculating the base-level and normalizing the oscillator

Botvenko ScriptI just test&learn pine script...
Damn, what should I write here? So... Its just a differense between the logarithms of two prices of different periods (You can set the period you want)... And it looks really nice... Ahem...
I hope, you enjoy this piece of... Have a nice day, my dear.
Combo 2/20 EMA & Average True Range Reversed This is combo strategies for get a cumulative signal.
First strategy
This indicator plots 2/20 exponential moving average. For the Mov
Avg X 2/20 Indicator, the EMA bar will be painted when the Alert criteria is met.
Second strategy
Average True Range Trailing Stops Strategy, by Sylvain Vervoort
The related article is copyrighted material from Stocks & Commodities Jun 2009
Please, use it only for learning or paper trading. Do not for real trading.
WARNING:
- For purpose educate only
- This script to change bars colors.
Combo 2/20 EMA & ADXR This is combo strategies for get a cumulative signal.
First strategy
This indicator plots 2/20 exponential moving average. For the Mov
Avg X 2/20 Indicator, the EMA bar will be painted when the Alert criteria is met.
Second strategy
The Average Directional Movement Index Rating (ADXR) measures the strength
of the Average Directional Movement Index (ADX). It's calculated by taking
the average of the current ADX and the ADX from one time period before
(time periods can vary, but the most typical period used is 14 days).
Like the ADX, the ADXR ranges from values of 0 to 100 and reflects strengthening
and weakening trends. However, because it represents an average of ADX, values
don't fluctuate as dramatically and some analysts believe the indicator helps
better display trends in volatile markets.
WARNING:
- For purpose educate only
- This script to change bars colors.

Ichimoku Buy/Sell Signals of manual MTF Tenkan crossing KijunIchimoku Buy/Sell Signals based on fast, small time frame Tenkans crossing longer timeframes Kijuns - Manual MTF Analysis
This code marks the potential change of direction based on the input of one timeframe's Ichimoku Tenkan (conversion) line crossing over a higher, longer timeframe's Ichimoku Kijun (base) line.
Feel free to change the inputs if need be and to hide the yellow box. Use Ichimoku rules of Tenkan, Kijun, Lagging Span, and Cloud for Take profit/Stop Losses. It is best to wait 3-5 minutes after the signal to enter to confirm the trend and to confirm if the Lagging Span has broken key levels. I refer to the book Trading with Ichimoku - A Practical Guide to Low-Risk Ichimoku Strategies by Karen Peloille as the Ichimoku rulebook. Good luck.
For day trading/scalping/intraday - 1min/3min/5min
Tenkan Line Timeframe = 1min
Kijun Line Timeframe = 5min
For swing trading - multiple days/weeks - 4HR/Daily/Weekly Charts
Tenkan Line Timeframe = day
Kijun Line Timeframe = week

Money Maykah -- DC-ATR , Stochastic RSI signals v.1-89 --This indicator shows the Stochastic RSI (SSRI) for overbought when the Donchian Channel (DC) is in the upper zone (between basis and upper), and SSRI for oversold when the DC is in the lower zone.
The DC upper and lower have a percentage of the ATR added I call this DC-ATR.
There can be numerous ways to form a strategy based on this. For a bull trend, an ABCD could be traced by A/C = blue signals and B/D = red signals.
Let me know what you think or if there is something wrong with the code. It's probably not the cleanest or more efficient but I am not a pro. If you find a good way to make a strategy from the indicator let me know.
Hope you enjoy!
-Casey R

Candle relative powerThis indicator tries to measure the power of candle.
You can also integrate some candles to measure the power. The “Length” is for integrating candles. If the Length is equal 5, it means indicator calculate power of recent 5 candles.
The second editable factor in “Shadow index” which represent the power of shadows.
The last factor in Average Criteria which is the module of comparing the integrated candles to the past market moves.
This indicator do not supposed to create trading signals! But, you can see every time it breaks the static line it is a sign of bulls or bears power.
I personally use it as a candle power meter so I will evaluate the power of breakouts or trend continuations.

Unicorn Quant Strategy [Astride Unicorn]Deeply customizable trading algorithm with instant back-testing. Its position management and trading signals engines emulate every step of the trading process and display all the actions on the chart. For example, the algorithm shows when to enter or partially close a position, move stop-loss to breakeven, etc. The trader can use these signals in their decision-making and replicate these actions in their trading terminal. The script can also send real-time alerts to the user’s Email.
The trading signals feature calculates entry signals for momentum and trend trading. The calculation is based on trend filtering using our custom filter based on rolling historical volatility. The historical volatility is used to distinguish the market regime and determine the current trend direction. In its calculations, the algorithm uses linear regressions instead of averaging. As our practice shows, it helps to reduce signal lag while keeping the number of false signals low.
HOW TO USE
Set stop-loss and up to three take-profit levels, choose rules for moving the stop-loss level, adjust sensitivity of the entry signals and see the back-test result immediately. If the performance of the strategy satisfies you, proceed with the forward-testing or live-trading.
When using this script, please, keep in mind that past results do not necessarily reflect future results and that many factors influence trading results.
SETTINGS
Use Starting Date - when the flag is turned off, the algorithm uses all available pricing data to calculate back-tests; when turned on, back-tests start from a starting date the user can select in the setting below.
Starting Date - sets a starting date for back-testing.
Trading Signals
Trade Length - defines the length of the trades the algorithm tries to calculate entry signals for. Recommended values are from 1.0 to 6.0.
Sensitivity - controls the sensitivity of the trading signals algorithm. The sensitivity determines the density of trading signals and how close the trailing-stop levels follow the price. The higher the value of this parameter is, the less sensitive the algorithm is. High values of the Sensitivity parameters (100-500) can help to withstand large price swings to stay in longer price moves. Lower values (10-100) work well for short- and medium-term trades.
Signals Type - In the Signals Type dropdown list, there are two options: Market Timing and Market Bias. Market timing is a type of trading signaling when the algorithm tries to find a perfect moment to enter and exit a trade. Market Bias is the type of trading signaling when the algorithm tries to be in a position all the time. When a trade is closed, the algorithm determines a direction to which the market is currently “biased” and immediately opens a trade in this direction.
Position Management
SL - sets stop-loss level measured as a percentage of the trade entry price
TP1, TP2, TP3 - sets take-profit levels measured as a percentage of the trade entry price
Close % at TP1, Close % at TP2, Close % at TP3 - Sets portions of the open position(as a percentage of the initial order size) to close at each of the TP levels
At TP1 move SL to, At TP2 move SL to - Sets the rules for moving stop-loss level in an open trade to protect the floating profit
Dashboards
Active Position Information - turns on/off a dashboard that shows the current SL and TP levels for the active position.
Recommended SL,TP Settings - turns on/off a dashboard that shows recommended settings for the SL and TP levels.

OnBalanceVolume by DGTComparing relative action between price bars and On-Balance Volume (OBV) generates more actionable signals, and plotting OBV on top of price chart alows to visually emphasis the relation between the price bars and OBV.
The On Balance Volume indicator (OBV) is a good metric for measuring buying and selling pressure. Many people believe that buying and selling pressure precede changes in price, making this indicator valuable. The actual individual quantitative value of OBV is not relevant. Instead, traders and analysts look to the nature of OBV movements over time; the slope of the OBV line carries all of the weight of analysis.
* Trend Identification - On Balance Volume (OBV) is useful for identifying or confirming overall market trends, when both price and OBV are moving in the same direction the underlying trend is likely to continue.
* Devrgence - divergence occurs when price movement is not confirmed by the indicator. In many cases, these divergences can indicate a potential reversal
* During a trading range, if the OBV is rising, accumulation may be taking place—a warning of an upward breakout, and coversly if the OBV is falling, distribution may be taking place—a warning of a downward breakout.
Note of caution in using the On Balance Volume
- It is a leading indicator, meaning that it may produce predictions, but there is little it can say about what has actually happened in terms of the signals it produces. Because of this, it is prone to produce false signals. It can therefore be balanced by lagging indicators. Add a moving average line to the OBV to look for OBV line breakouts; you can confirm a breakout in the price if the OBV indicator makes a concurrent breakout
- A large spike in volume on a single day can throw off the indicator for quite a while. For instance, a surprise earnings announcement, being added or removed from an index, or massive institutional block trades can cause the indicator to spike or plummet, but the spike in volume may not be indicative of a trend
This study additionally presents
- Volume Histogram with a Volume Moving Average
- Volume Weighted Colored Bars
Other alternatives where OBV is used as source of creating indicators : RelativeStrength of VolumeIndicators , Neglected-Volume , StochX Indicator of Indicators , etc
As with most indicators however, it is best to use OBV with additional technical analysis tools
Disclaimer: Trading success is all about following your trading strategy and the indicators should fit within your trading strategy, and not to be traded upon solely
The script is for informational and educational purposes only. Use of the script does not constitutes professional and/or financial advice. You alone the sole responsibility of evaluating the script output and risks associated with the use of the script. In exchange for using the script, you agree not to hold dgtrd TradingView user liable for any possible claim for damages arising from any decision you make based on use of the script

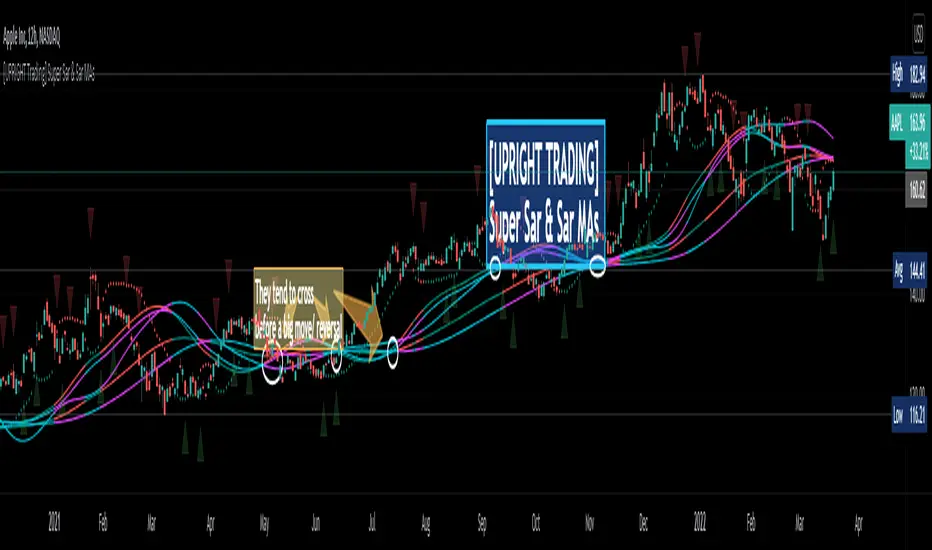
[UPRIGHT Trading] Super Sar & (New) Sar Moving Averages (cc)Hello Traders,
(This is an original creation and a proof of concept.)
As most of you know the PSAR, parabolic SAR indicator, was developed by J. Welles Wilder Jr. and used to determine trend direction and potential reversals in price. This technical indicator uses a trailing stop and reverse method, 'SAR,' or "stop and reverse," to find potential exit and entry points.
My question was: Is it possible to create meaningful Moving Averages by using PSAR?
Turns out, the answer is yes.
As you can see on the above chart, not only is it possible, it does work.
Features:
I've created buy/sell signals, which act as early indication of a potential reversal.
5 original MAs.
My Super Sar
Customizability: For now, the ability to adjust the length and turn on/off the MAs (maybe more features to come).
Enjoy!
As always, please: Like, Follow, Support, etc...
Cheers,
Mike
(UPRIGHT Trading)
Kahlman HullMA / WT Cross StrategyA strategy created using Hull Moving Average and WT Cross .
Hull Moving Average turns green and WT Cross crossover this is a long. Otherwise short.
Stop Loss and Take Profit settings are available. You can set it to the level you want or turn it off.
According to my measurements, it shows the best performance in the 4-hour period. But you can find the best settings that are correct from the Strategy settings.

TT Price/Trend IndicatorThe TT Price/Trend Indicator identifies potential trend changes and advises of safe places to set orders at retracements.
Main Signals:
When a "BUY" signal prints, it is suggested to set a buy order at the Blue trendline and wait until price retraces back.
When a "SELL" signal prints, it is suggested to set a short order at the Blue trendline and wait until price rises up.
Take Profit:
The Reactive Trendline (the thick line that switches from Green to Red, and Red to Green frequently) is good at finding local bottoms.
It is suggested to Take Profit on your Long once you see the first switch from Green to Red. If the Reactive Trendline is already Red when your LONG order is filled, wait until it goes from Red-Green-Red to Take Profit.
It is suggested to Take Profit on your Short once you see the first switch from Red to Green. If the Reactive Trendline is already Green when your SHORT order is filled, wait until it goes from Green-Red-Green to Take Profit.
Stop Loss Suggestions:
If you are LONG (BUY), set your Stop/Loss to slightly below the last Higher Low (HL)
If you are SHORT (SELL), set your Stop/Loss to slightly above the last Lower High (LH)
Alternatively, if you want to maximise your Risk:Reward ratio, you can CLOSE your order once a candle engulfs and closes over both the Blue Line AND the Grey Line. Once these levels are broken and you are underwater, the risk to hold that position is no longer worth it. However, this approach can shake you out of winning trades, so I advise you to use other strategies such as Volume, Fibonnaci and RSI etc to help you make a final decision.
Important: If you are taking this approach, don't panic sell - wait for the close of the current engulfing candle to make this decision, because quite often it will just be a wick up or down in your favour.
What are the best Strategies?
The best timeframes are as follows:
- 1 Hour
- 2 Hour
- 4 Hour
- 1 Day
- 1 Week
My Favourite is 1 Hour.
Scalping for advanced traders:
- 1 minute
- 5 minutes
If you are scalping, it is highly recommended to use the TT Volume Indicator as well, to confirm price with volume (see scripts under my profile). Price on its own will not be good enough.
I also recommend the RSI with a 14 SMA to identify Strength breakouts.
Other Features:
- VWAP (Dotted Red/Green line) - this is common liquidity and can be one of the most important Support/Resistance levels in Crypto, which is why it is included.
Can you FOMO order?
Unless you are using this with a combination of other indicators (such as the TT Volume Indicator), it is not recommended to FOMO orders at the "BUY" or "SELL" signal unless you have a clear volume breakout. Please see this explanation on FOMO ordering for further information:

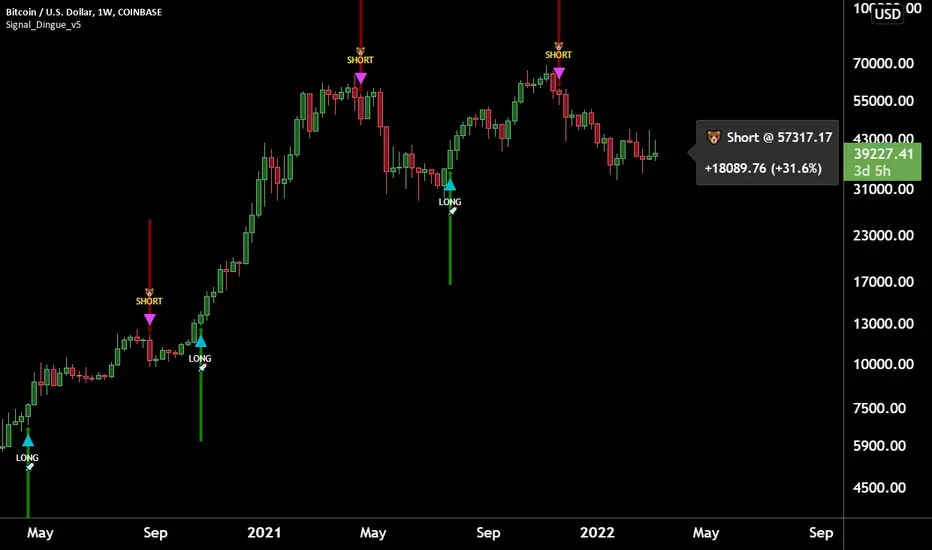
Trading Assistant DiNGUETrading Assistant DiNGUE This indicator is like a trading assistant for your charts.
It helps set your biases and emotions aside and lets you focus on managing trades in an easy visual way.
Get various types of signals to enter your trades (either Long or Short). Then use take profits, stops, or the opposite signal to exit trades.
The signals are created from various indicators and sensibility options you can customize any way you want. Works on every timeframe.
You can customize every setting or used the preset ones. Preset settings adjust automatically based on the timeframe you are using on the chart.
The 12 Indicators are Volume - RSI - Stochastic - MacD - Moving Averages (MA) - Rate of Change (ROC) - ADX DMI Directional Movement Index - On Balance Volume (OBV) - Bollinger Bands - VWAP - ATR - Parabolic SAR.
Every indicator can be turned On or Off.
You can adjust the way it creates signals by selecting either 'rise-fall', 'crosses' or by combining both.
You can select the sensitivity of the signal from Normal - Safe - Safer.
You can adjust lengths or use the preset ones.
There are also additional options for each indicator, you can filter weak levels for ADX, filter for tight bands, have ROC above 0…
You can also plot several of those indicators on the screen. 2x Moving Averages, 2x VWAP, 2x ATR, 2x SAR for even easier visualization of the trend.
You can also plot fractals to facilitate once again on trend visualization. Higher high, lower low, higher low, lower high.
Trade with the Trend and Safe Trades:
If you want to have a higher chance of success, you can trade with the trend. First, select the trend timeframe you would like to use. Let's say the “Weekly” trend. Meaning it will generate a signal on the weekly timeframe and based on the result (Long or Short) it will only take trades in that direction. So the trend is LONG on the Weekly and you get a “Long” signal, it will take it. “Short” signals on the other hand will be treated as “stops” and won’t want to go against the trend by going ‘short’.
Safe Trend works in the same manner, but instead of using the signal on a bigger timeframe, it uses an indicator as to the deciding factor. Let's say you select the 200SMA as the “Safe signal”. The indicator will only go “Long” when above the 200SMA and “Short” under the 200SMA. Otherwise, it will put a stop instead of going against the trend.
Stop Loss:
There are 4 different types of stop-loss that you can use at the same time.
- Indicator Stop
- Fib stop
- Fix % stop
- Trailing stop
You can plot the stops directly on the chart AND OR add them to the panel for an easy visualization once again.
With the ‘indicator stop’, you can select one of the two: MA ATR SAR VWAP as a stop.
Fib stop, it uses fib numbers to calculate a stopping point.
Fix %, you can select your max loss in percent. Could be 2%, 5%
A trailing stop is like a fixed stop but that will trail as the price moves in the right direction.
Take Profit:
There are 4 different types of take profit that you can use simultaneously.
- Fix % Take Profit
- ATR multiple Take Profit
- Fib multiple Take Profit
- Bollinger Band Take Profit
Fix % just let you set a fix take profit target in percent.
ATR multiple lets you select a target based on a multiple of the average true range.
Fib multiple lets you select a target based on a fib multiple
Bolling Band lets you take profit based on the Bollinger band settings you select.
Visual Panel:
The visual panel lets you see exactly how is the last trade progressing. It will give you the entry price, profit, stop, and target. You can turn it on or off, as is for the stop and target.
You can also decide to plot 1 position or more, you can even show all the possible signals, add backgrounds with colors. You can also plot the bigger Trend and Safe Signals explained above.
If you have any questions, suggestions, or comments, feel free to do so!
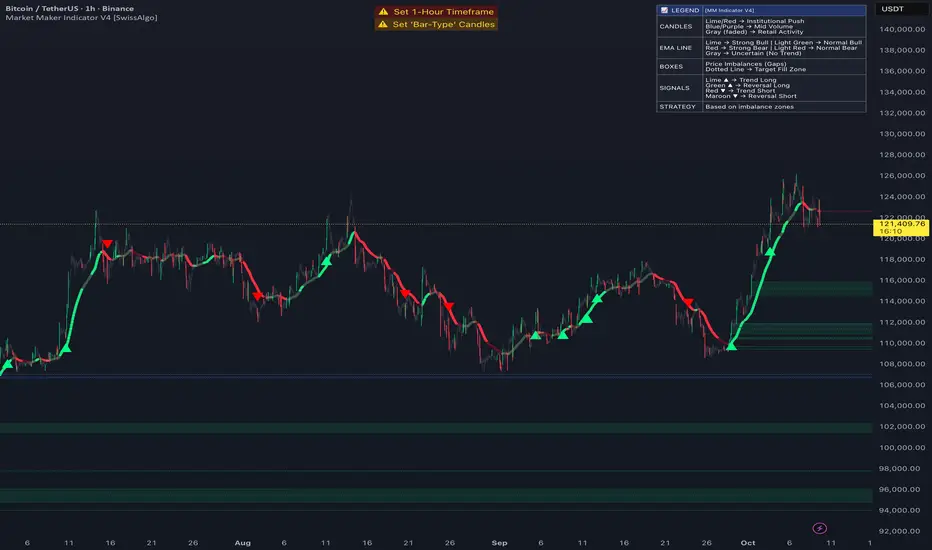
Market Maker Indicator V2 [tecnocrypto]This indicator is based on the idea that prices are generated by the interaction between a Market Maker on one side (sometimes also called the "Composite Man") and Retail Traders on the other side (Retail Traders include simple retail, professional traders, whales, institutions...as a single entity). These two opposite entities "play" the trading game on trading platforms/exchanges (crypto), which are neutral to the game.
Market makers are liquidity providers, and make profits either by charging a spread between buy and sell prices, and (also) by trapping retail traders into specific positions.
Trading is a "zero sum" game in the sense that it generates a transfer of resources between these two specific players, which are indeed the Market Maker and Retail Traders. If Retail Traders are in profit, Market Maker is (temporarily) in loss, and viceversa. Market Maker goal is to squeeze profits out of Retail Traders, by inducing them to take wrong positions.
The Market Maker Method Indicator executes the following:
1) Identifies and plots candles that are generated by the Market Maker's moves (called "Shift Candles"); shift candles are "artificial" price/volumes moves, generated to induce retail traders into specific zones which are, essentially, traps. They are called Shift Candles as they generate abnormal (and mostly unexpected) price movements in either direction. They move the price from one zone to the next to execute the Market Maker strategy. Observe how often sudden (apparent) prices increases are followed by price crashes (stop hunt rise, drop); and observe how often sudden (apparent) price collapses are followed by price uptrends (stop hunt low, rise); sometimes these movements are made in progressive steps (generally, 3).
2) Plots open long/open short alerts based on the assumption that when Market Maker plots upwards shift candles, vivid green color, they are preparing for an upcoming price reversal (down); same, but opposite sign, for downwards shift candles. This is a counterintuitive logic for Retail Traders, that generally open long when price is rising, and open shorts when price is falling - jumping into Market Makers traps.
3) Plots the areas where price is expected to return (upwards or downwards) based on previous shift candles (called "Recovery Zones")
You can use this indicator on any timeframe and for any asset.
The Market Maker indicator V2 provides long / short entry signals based upon the market maker manipulative moves described above.
Long alerts are triggered by manipulative price push-downs by the marker maker, which will be followed by price increases (while price was decreasing, market maker was purchasing from retail). Additional factors are taken into consideration to plot long entry signals, , mainly volume build up and mean reversion, around this basic concept.
Short alerts are triggered by manipulative price push-ups by the marker maker, which will be followed by price drops (while price was increasing, market maker was selling to retail). Additional factors are taken into consideration to plot short entry signals, mainly volume build up and mean reversion, around this basic concept.
The indicator is based on the Traders Reality indicator, but improved with alerts, that can be used with trading bots, and additional possibilities to customize the behavior of the indicator.
A strategy associated with this indicator is also available.
Best results on the 1H timeframe.
Contact me for further info.
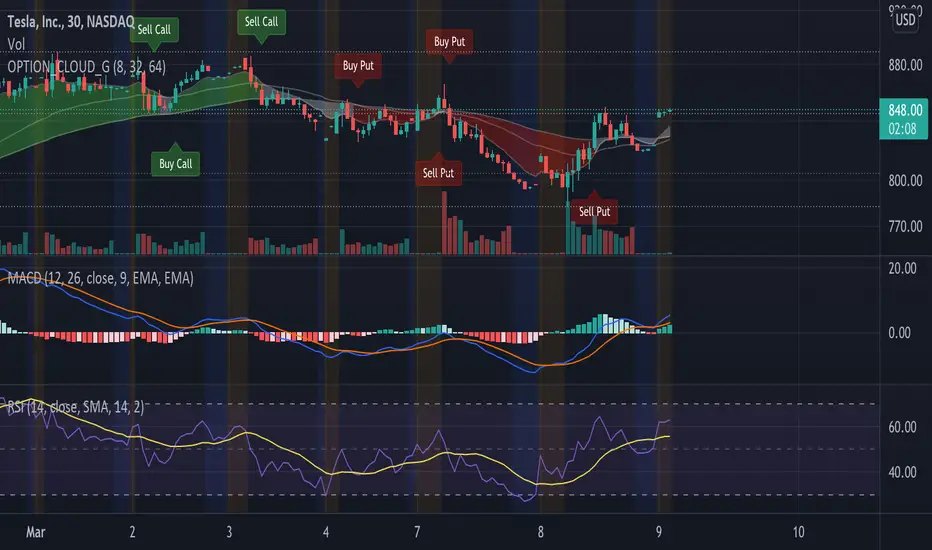
EMA Options Clouds With SignalsEMA Clouds for Options!
This indicator can help you confidently open and close options positions. Note that you should set stop a little below midline EMA . Risk reward for good signals is fairly consistent in profit. Most of the simulations I ran got between 1:2 and 1:4 profits. The losers usually can be avoided by making sure you are not in a choppy trading channel. Wait for EMAs to start separating and don't blindly follow every buy/sell.
3 wave EMA + Clouds:
Defaults:
EMA 8/32/64
Signals (off by default - turn on in settings):
Buy Call/Sell Call (open/exit call positions)
Buy Put/Sell Put (open/exit put positions)
Enter signals bullish:
Close over Middle EMA AND Short EMA > Middle EMA > Long EMA
Exit signals bullish:
Close under Middle EMA OR trend turns bearish (Short EMA < Middle EMA < Long EMA )
Enter signals bearish:
Close under Middle EMA AND Short EMA < Middle EMA < Long EMA
Exit signals bearish:
Close over Middle EMA OR Short EMA > Middle EMA > Long EMA
Cloud Colors (Default)
Green: Bullish
Red: Bearish
White: Chop/Transition
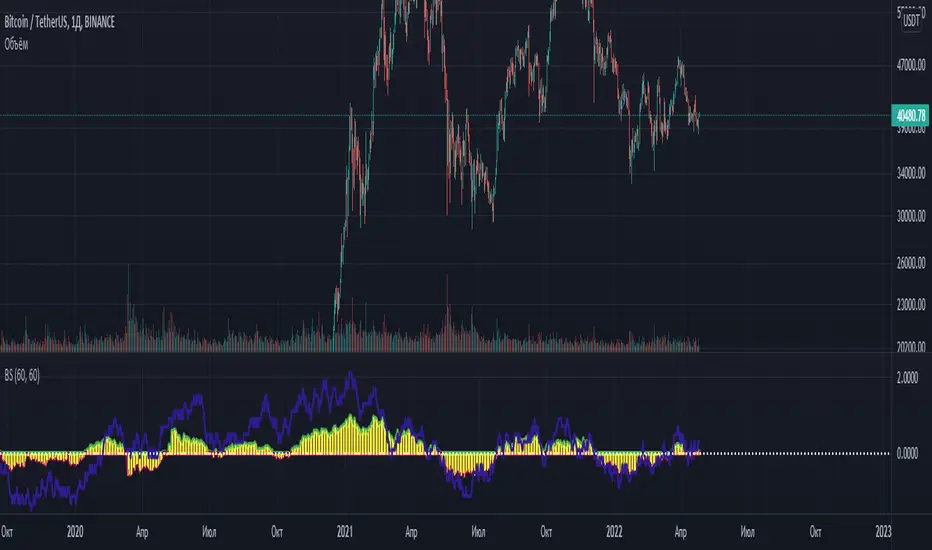
Accumulation/Distribution Bands & Signals (BTC, 1D, BITSTAMP) This is an accumulation/distribution indicator for BTC/USD (D) based on variations of 1400D and 120D moving averages and logarithmic regression. Yellow plot signals Long Term Accumulation, which is based on 1400D (200W) ALMA, orange plot signals Mid Term Accumulation and is based on 120D ALMA, and finally the red plot signals Long Term Distribution that's based on log regression. It should be noted that for red plot to work BTC 1D BITSTAMP graph must be used, because the function of the logarithmic regression was modified according to the x axis of the BITSTAMP data.
Signal bands have different coefficients; long term accumulation (yellow) and and the log regression (red) plots have the highest coefficients and mid term accumulation (orange) has the lowest coefficients. Coefficients are 6x, 3x and 1.5x for the red (sell) and yellow (buy) plots and 1x, 2x and 3x for the orange (buy) plot. Selling coefficient for the yellow and the orange plots are respectively 2x and 1x. Buy and sell signals are summed up accordingly and plotted at the top of the highest band.
Acknowledgement: Credits for the logarithmic regression function are due @memotyka9009 and Benjamin Cowen

[Fedra Algotrading LR + TTP Indicator Lite]How it works?
- It calculates the linear regression of the last X candles and define a range based on a linear regression deviation (represented by the 3 parallel lines over the last candle).
-Open trades based on the breakout of the deviation of the linear regression (represented by the yellow triangle).
-Advanced trend filter to not open trades against the trend consist in 2 SMA cross and and a few other conditions, including sptionally super trend (Represented by the red and green background).
-Percentage take profit (represented by the horizontal green line. configurable)
-Percentage stop loss (represented by the horizontal red line. Configurable
-Break even when a trade has already opened and there is a change of trend. Calculated in 1.5% when the price is under the yellow SMA.
Alerts in each case to receive notifications (BUY & SELL, TP BE SL).
Added labels with entry price and PnL of each closed trade to facilitate optimization

[UPRIGHT] Awesome DMI+Hello Traders,
Today I'm releasing a spin on an 'oldie but goodie'; the Directional Movement Index (DMI).
DMI is a combination of 3 different indicators developed by the famous J. Welles Wilder. DMI has 3 different plots: the ADX, +DI, and -DI. The first is the ADX (Average Directional Index), which Wilder created in 1978 to show the strength of a trend by comparing the current price with the previous price range. The other two are the +DI (positive directional indicator) and the -DI show up as two separate lines, +DI is the difference between the highest price of the current day and the highest price of the day before, and -DI does the same calculation with the current and previous day's lows.
How does it work?
When the ADX line is above 25 (as a general rule, some traders use a different threshold, +/- 5), the trend is strong. When the +DI line is above the -DI line, the asset (stock) is moving in an uptrend, and the opposite means the asset is in a downtrend.
How is this different?
Uses multiple calculations to produce signals for an indicator than normally doesn't have any.
Multiple ADX's, +DI's, and -DI's for better accuracy and clearer direction changes.
Ability to use 2 different background highlight signals and several buy/sell signals.
Fully customizable (as always), ability to turn on or off any signals, change any of the colors to suit your needs.
Added pre-filled Alerts.
The ribbons created by the fill make it easier to see the change in direction of each plot.
The chart should look like:
Cheers,
Mike
(UPRIGHT TRADING)

Average True Range (VStop) Cloud SignalsThis indicator extends the built-in Volatility Stop indicator to a visual signals type indicator based on the crossover of a small VStop value (default 1.5x ATR) and a larger VStop value (default 3x ATR). The two values form a "cloud" with default coloring based on RSI/strength of trend.

CryptoGraph Multi Algo StrategyThis is a summary of how this strategy works.
CryptoGraph Multi Algo Strategy is the second profitable real-time trading strategy by the CryptoGraph team, that generates trade signal with exact entires, exits and risk management. The strategy is intended to work nearly every crypto coin pair, stock or index.
Principles behind the strategy
Entry:
Detection of trend direction with the use of an EMA . Default setting is a length of 550.
Detection of shorter term trend direction with the use of multiple Supertrend Indicators.
Detection of an even shorter term direction with the use of a crossover of the Stochastic RSI , below or above certain levels. This would be the final condition for an entry signal.
Exit:
Once an entry signal has fired, the script will look at the current ATR Value. In the script settings there will be an option to adjust the ATR factor. While ATR factor is equal to 1, it means it will use the default ATR value distance from the candle close. When ATR factor is for example 2, it will use two times the ATR distance from the candle close.
This is a simple representation of how this strategy works, in reality there are more underlying factors.
To find the best settings for the crypto coin pair or stock you want the strategy to trade with, simply switch up the EMA , ATR Profit Multiplier and ATR Stop Multiplier and experiment which settings would fit your style best.
What to look for when testing coins or stocks?
EMA, default exponential moving average is set to 550. When above the line, it will only look for longs, when below it will only look for shorts.
The Take Profit and Stop Loss are based on ATR multiplications, adjust these in the inputs interface and you will see the exits change.
Default parameters of the strategy
This is only an example of a profitable combination of all parameters. This would be the 30 minute timeframe Bybit chart on Bitcoin.
ATR take profit at x2, ATR stop loss at x4.1.
In this example we are using an initial capital of $1.000,- while each trade 100% of this capital is used and compounds over time. Meaning every profit or loss will be added to the next trade. Also there is a 0.05% commission used based on Bybit, since we expect most trades to market in and limit out.

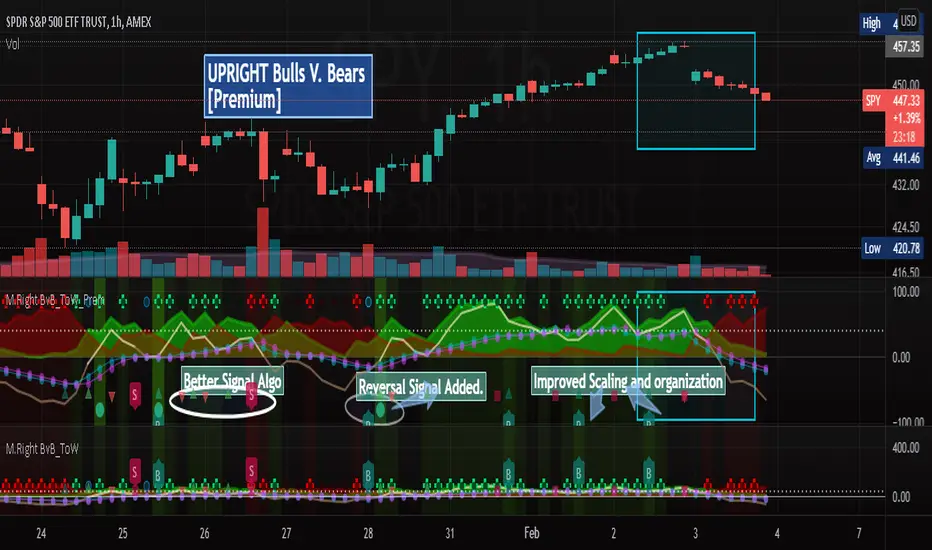
[UPRIGHT] Bulls-V-Bears Tug-of-War SquidGame [Premium] (cc)Hello Traders,
Today I'm updating the Bull V. Bears with a Premium version. (Note: the other version is shown below the Premium on the chart above)
……"The game is Tug of War, the side that pulls the rope from the middle to their side wins. Let the game begin."……
How it works:
This indicator is not a typical one.
1) It shows visually when Bull volume or Bear volume is ‘pulling the rope to their side’.
2) It uses several different formulas to get an accurate read on the level of volume , but still keeps peaks and troughs within 100 for easy reading.
3) Update: It was originally meant to be used strictly with other indicators, but it can now be used as a standalone indicator.
__________________________________
Legend:
1) The top line signals give the major signals –
a. Red cross = Bearish volume strength and continuation.
b. Green cross = Bullish volume strength and continuation.
i. + Green Dot inside enhances signal.
ii. + Red Dot inside weakens signal.
c. Blue circle = Can indicate the beginning of a reversal to the upside or downside.
d. Pink circle = Can indicate the beginning of a reversal to the downside.
2) The Bottom signals are triggered when one circle-rope crosses over the other, these signals give confirmation to the top line signals – Red bearish / Green bullish .
3) As shown on the chart, the Reversal setup usually consists of a blue circle, followed by a red or green cross, then confirmation from the bottom signal.
4) Without the signals: green obviously is Bullish especially above the threshold set --Red bearish . The regular rope gives trend indication.
I've added tooltips to make it easy to understand, feel free to leave a comment if you still have a question!
__________________________________
Features:
-Tooltips (hover over - Info) for understanding.
-Works well on all timeframes; even 5min, I made a tooltip for recommended lengths.
-Customizable Signals; with the ability to turn on and off.
-Reversal signals: Pink and Blue circles can indicate reversals coming.
-Works well as a leading standalone indicator.
-Adjustable top signal row.
-Background Highlights.
-Alerts
-Rules added (hover over).
__________________________________
Premium :
-Better signal algo (will likely be updated again soon)
-Reversal Signal added (Large Circle)
-Improved Scaling and Organization - Now easier to see large moves/signals on Multiple timeframes.
Chart should look like:
Cheers,
Mike
(UPRIGHT Trading)