Hull Trend with KahlmanThis is an update to the idea of
The Kahlman smoother makes the signal more precise (by one candle).
Signals

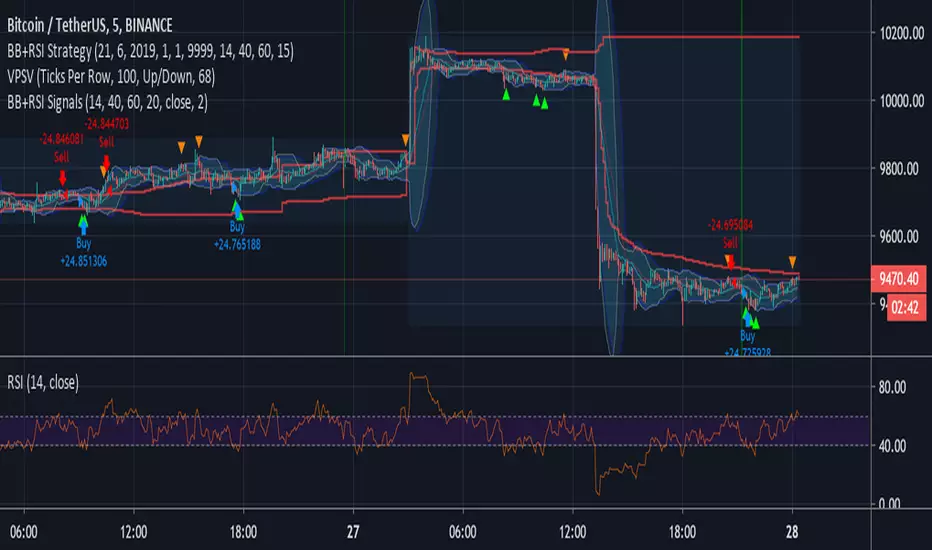
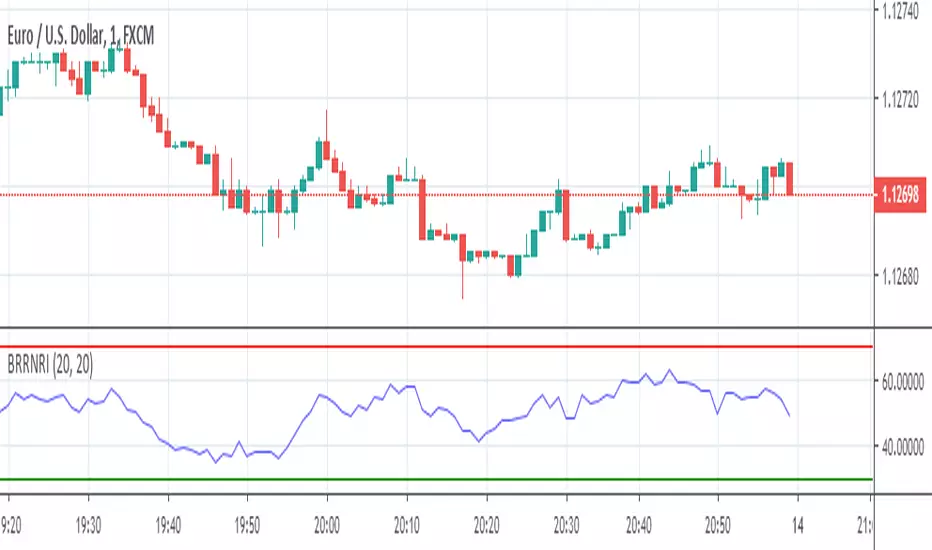
Bollinger + RSI Signals (by Bader Kamal)This idea originally by ChartArt on January 14, 2015 as Strategy, and I modify it to become as Signals on 26 July 2019.
This signals uses a modified RSI to sell when the RSI increases over the value of 60 (or to buy when the value falls below 40), with the classic Bollinger Bands strategy to sell when the price is above the upper Bollinger Band (and to buy when this value is below the lower band).
This signals only triggers when both the RSI and the Bollinger Bands indicators are at the same time in a overbought or oversold condition.
Crypto Fund indicatorThis indicator is just a slight modified version of the godmode indicator developed by xSilas.
It helps to spot and extreme building selling or buying pressure.
I use it mainly for BTC on the 1h chart but can do the job on other crypto-assets and timeframes such as 5min, 30min etc.

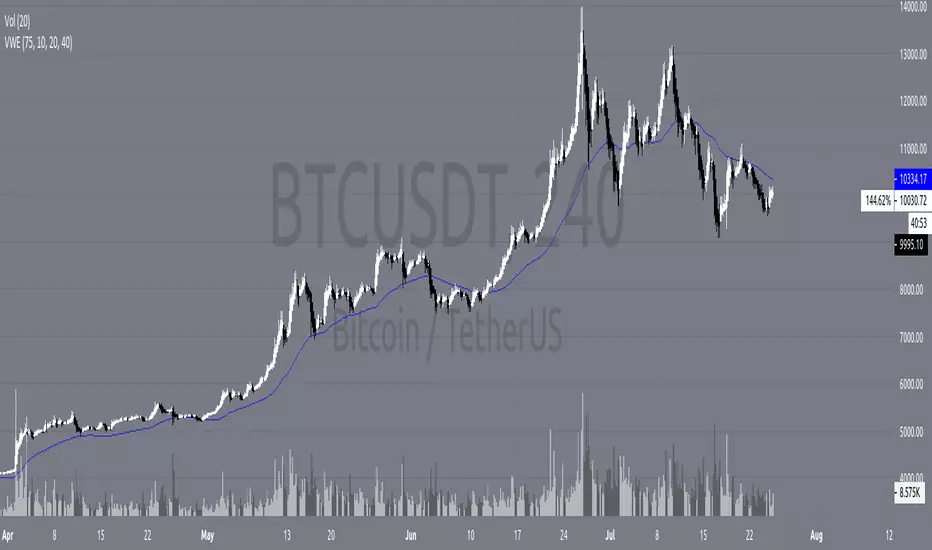
Volume Weighted EMAAn EMA using the Volume Oscillator to integrate volume fluctuations into the EMA calculations.
Especially useful for Crypto and Forex
Oasis Trading SuiteOasis Trading Suite
Introduction: The Oasis Trading Suite is a TradingView indicator designed to make following trend and finding key pivot points very easy. It provides the trader with advanced trend coloring for candles, pivot points both high and low, and a trail that will follow price and give signals when a “buy the dip” or “sell the rally” opportunity is presented.
Part One: Candle Coloring
The Oasis Trading Suite colors candles based on a trending bullish or bearish bias; this will override the default red/green coloring of candles which is based on closes.
Bullish Candles will be denoted with a green color by default.
Bearish Candles will be denoted with a red color by default.
Neutral Candles will be denoted with a gray candle by default. These are candles that do not have a trending bias.
Part Two: Pivots
In addition to the normal red/green/gray candles there are also blue and orange candles. These candles are pivot bars.
Blue bars denote Bottom Pivots
Orange bars denote Top Pivots
These pivots are not exactly support and resistance, but more of a zone of influence. They can act as support and resistance, swing zones, and breakout points. These are not standard pivots, they do not repaint, they form live and once closed will not move candles.
Part Three: Trail
Finally, the Oasis Trading Suite gives the trader a trailing line that will turn green or red depending on trend. If price falls to the trail and the low (for green trail) is the only thing below the trail it will give a “buy the dip” signal. If the high (for red trail) is the only thing above the trail it will give a “sell the rally” signal. This trail is slightly lagging, so when trend is shifting there will sometimes be false signals at the final shifting point. I am experimenting with removing as many as possible using the “Strict Mode” found in the input settings for the Oasis Trading Suite.
Buy the Dip will be denoted by a Blue Arrow
Sell the Rally will be denoted by an Orange Arrow
For Access or Questions: Private message us. Thank you.

Oasis Trend StrategyThis is a simple script developed to give a quick visual of trend on any given time frame.
This is a script that gives signals of trend switches. Can be used to for buying and selling signals.
On larger time Frames we use the Aqua and Fuchsia Clouds to express the larger time frame trends.
This can be used for long term swing trades especially useful with the 4hr, 6 hr, and daily chart to cancel out all the noise within the larger trends. The smaller Blue/Red Clouds can be used within trend if you are a skillful trader.
On smaller time frames (Intraday), we used the Blue and Red intraday price action. Is meant to be used
alongside with the Aqua/Fuchsia to create short term trades decisions within the short term trends indicated by the Aqua and Fuchsia.
The 9 ema is used to keep a close eye on short term directional changes.
You would want to see if price stays above or below this level along with its price action.
This should give you initial signs of strength or weakness.
The 55 ema (Black) is used to determine larger trend directional changes and for confirmation of trend shifts.
If interested, you can learn a lot just by watching the price react to these levels and can really visualize the price action that encompasses these averages.
We recommend that all traders study Technical patterns, Price action, Financial risk management, and other pre-trade planning strategies to minimize drawdown risk.
Please give us a like and a follow if you like this indicator. Its simple and very easy to use.
We are not financial advisors. We do not give financial advise. Please use this indicator at your free will.
We are not responsible for any financial losses or claims.
If you find this indicator very useful as I have, we do appreciate any amount of tips.
This will fund us to create more indicators to be made for your use.
BTC - 3PmVmmsnuLedg7umzVkLnarKRo43g6P5Tp
ETH - 0x9a1Ba8809687D8d9A1D32Ed1602abEef48060aF1
LTC - MAgqbC6Kev1x3L2GvNwzhZacyBRxCKJ8Mi
ZCash - t1UYRLzQxeaHCNYfA9cLChfBX5mbcNqworA
0x - 0x2B07D8BFB20b6eDb9A498113764082211cdFA2cE
Many free Tradingview users can benefit from our indicators as we employ many many useful indicators that can be toggled in each script to surpass the indicator limits.


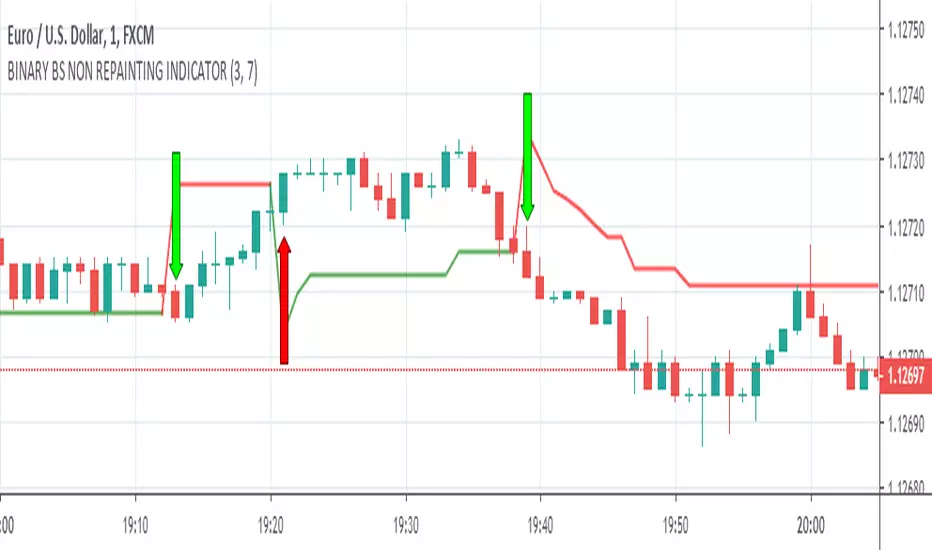
BINARY BS NON REPAINTING INDICATOR
Hello Binary Options traders, do you worry about loss in binary, now no need to worry, search my page in Fb, named "IQ Option Traders PK " ,like my page and send me a message, i will send you details of my strategy free of cost.
or comment below i will respond you.
thanks
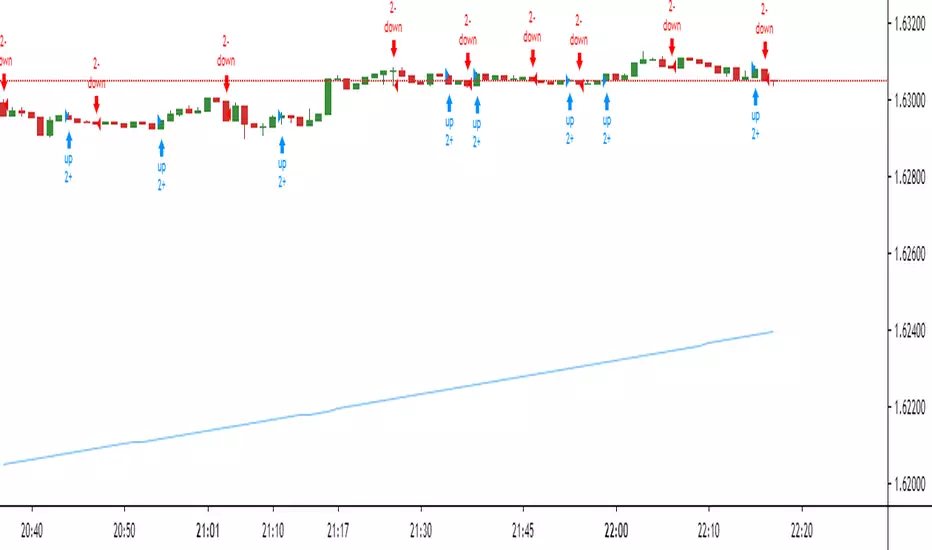
BINARY RR NON REPAINTING INDICATOR
Hello Binary Options traders, do you worry about loss in binary? now no need to worry, search my page in Fb, named "IQ Option Traders PK " ,like my page and send me a message, i will send you details of my strategy free of cost.
or comment below i will respond you.
thanks
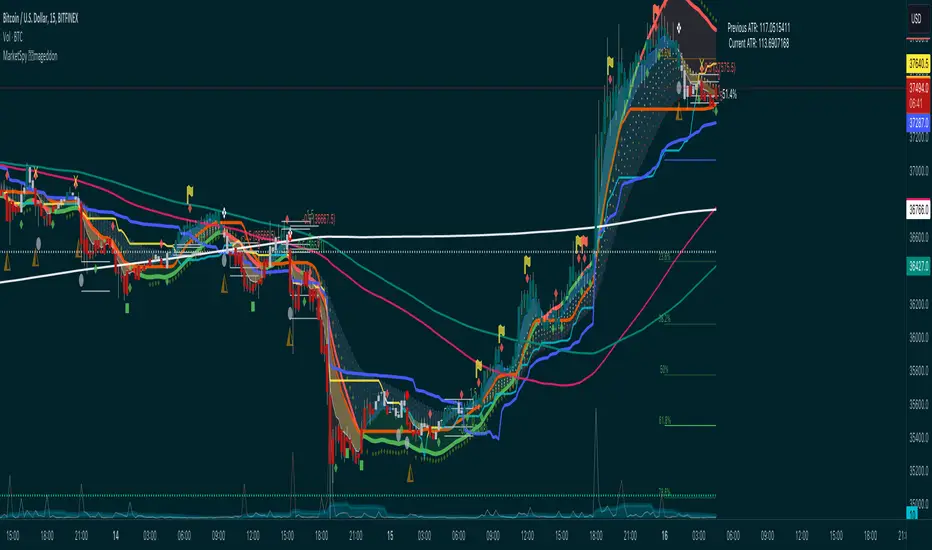
MarketSpy ARmageddonMarketSpy trading suite was designed to sniff out momentum swings and allow you to profit riding the wave. No matter what market, no matter the timeframe - this is all you need, from here on out this is your trading desk.
It's made up of three main components (with future add-ons in development):
1. MarketSpy X - the ultimate entry and exit tool that is built using custom momentum algorithm to find exact moments of reversals - without a fail. It's the one on the bottom with "green pulse dot" buy signals and "blood diamond" sell indicators.
2. MarketSpy ARmageddon (Augmented Reality) - price action overlay that analyses trends and is a confirmation tool for MarketSpy X. Can show confluence from top 5 market indicators, gives signals of reversals or chop zones, predicts prices(!) and is fully dynamic that reacts to market conditions LIVE.
3. MarketSpy S/R - This thing sniffs out and draws support and resistance based on math, not human eye. This means that MarketSpy effectively can go head to head with bots and algorithms and see right through the market to give you incredibly accurate points of interest where machines and humans sell and buy - ride the way together with the whales. Sounds cliche until you try it.
For more - visit our discord.
MarketSpy XMarketSpy trading suite was designed to sniff out momentum swings and allow you to profit riding the wave. No matter what market, no matter the timeframe - this is all you need, from here on out this is your trading desk.
It's made up of three main components (with future add-ons in development):
1. MarketSpy X - the ultimate entry and exit tool that is built using custom momentum algorithm to find exact moments of reversals - without a fail. It's the one on the bottom with "green pulse dot" buy signals and "blood diamond" sell indicators.
2. MarketSpy ARmageddon (Augmented Reality) - price action overlay that analyses trends and is a confirmation tool for MarketSpy X. Can show confluence from top 5 market indicators, gives signals of reversals or chop zones, predicts prices(!) and is fully dynamic that reacts to market conditions LIVE.
3. MarketSpy S/R - This thing sniffs out and draws support and resistance based on math, not human eye. This means that MarketSpy effectively can go head to head with bots and algorithms and see right through the market to give you incredibly accurate points of interest where machines and humans sell and buy - ride the way together with the whales. Sounds cliche until you try it.
For more - visit our discord.

3PDivLong
Test 2 : 27 June - 11 July 2019
- 5 m chart (best profit)
- 0.075% commission (Bitmex)
- leverage 1x

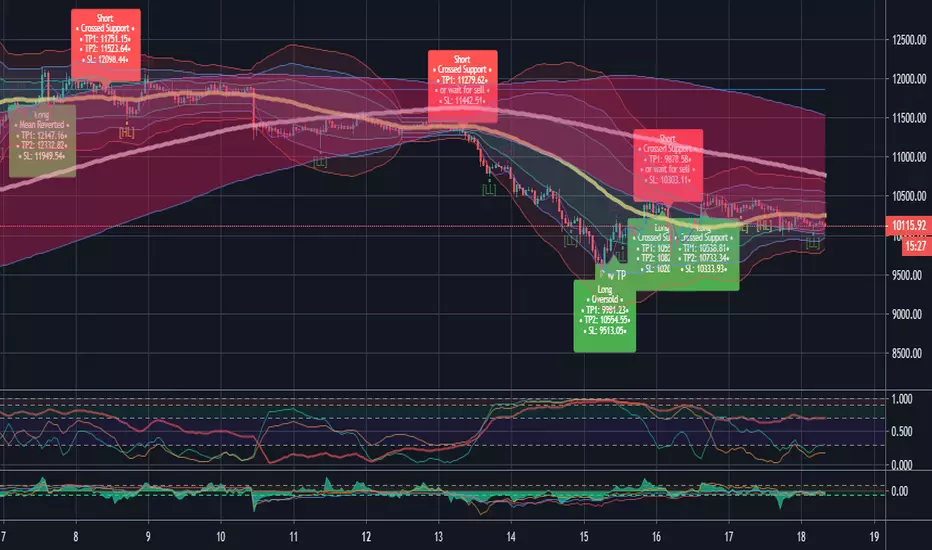
Odin - Bitmex EasymodeThree years ago we started a journey to building a trading framework that was intended to design a framework to stop trading time for money. Today I'm releasing the first version of that hard work as a simple, buy sell indicator optimised for crypto, but can be applied to almost any market.
This indicator was designed as a starting framework for new traders who are unsure of market trends and market movements when entering leveraged trading. Future releases will be coming soon that will include Take profit and stop loss targets and colouring candles with trend, as well as trend lines .
Odin is best used as a swing trader looking to find your peaks and bottoms when we have large shifts in trend. The indicator comes with several options including:
Turning on more signals for riskier trades.
Adjusting the aggressiveness of the algorithm.
Turn on lower lows and highs and higher highs and lows.
Persistence factor to find and counter trade certain trends early.
If you would like to learn more about Odin and whats going on behind the scenes you are welcome to join us.
Adaptive Autonomous Recursive Moving AverageIntroduction
Using conditions in filters is a way to make them adapt to those, i already used this methodology in one of my proposed indicators ARMA which gave a really promising adaptive filter, ARMA tried to have a flat response when dealing with ranging market while following the price when the market where trending or exhibiting volatile movements, the filter was terribly simple which is one of its plus points but its down points where clearly affecting its performance thus making it almost impractical.
Today i propose a new filter A2ARMA which aim to correct all the bad behaviours of ARMA while having a good performance on various markets thanks to the added adaptivity.
Fixes And Changes
ARMA was dealing with terribles over/under-shoots which affected its performance, adding a zero-lag option made the thing even worse, in order to fix those mistakes i first cleaned the code, then i removed the offset for src in d , this choice is optional but the filter is sometimes more accurate this way.
The major change is the use of an adaptive moving average instead of the triangular moving average that smoothed the output, this adaptive moving average is calculated using exponential averaging while using the efficiency ratio as smoothing variable, this choice surprisingly removed the majority of overshoots while adding more adaptivity to the filter.
The Indicator
The Indicator work the same way as ARMA, not reacting during flat market periods while following the price when this one is volatile or trending. length control the smoothing amount while gamma determine how the filter is affected during flat market periods, gamma = 0 is just a double smoothed adaptive moving average, higher values of gamma will filter flat markets with a certain degree.
On Intel Corp with gamma = 0, i want to filter the flat period starting at July 10, gamma = 3 will certainly help us on this task.
Hooray, the problem appear to be solved ! Lower values of gamma also produce desirable effect as shown below :
gamma = 2
So far so good, but gamma or length might have different optimal values depending on the market, also problems still exists as shown here :
Seagate is tricky, gamma at 2.4 might help
The relationship between length and gamma is somewhat complicated.
On Different Markets
While some filters will process market price the same way no matter the market they are affected, A2ARMA will change drastically depending of the market.
On AMD
On EURUSD
On BTCUSD
Comparison With ARMA
ARMA with parameters roughly matching A2RMA, overall most of the problems i wanted to fix where indeed fixed.
Conclusion
A huge thanks for the support i received during this "Blank Page" period i'am suffering, ARMA was an indicator i really wanted to further develop without giving up on the code simplicity and i think this version might provide useful results, we can also notice that the decision making is easier with this version of the indicator thanks to the added coloring (which would have been impossible with ARMA).
My work don't have license attached to it, feel free to modify and share your findings, mentioning is appreciated :)
Thanks for reading !

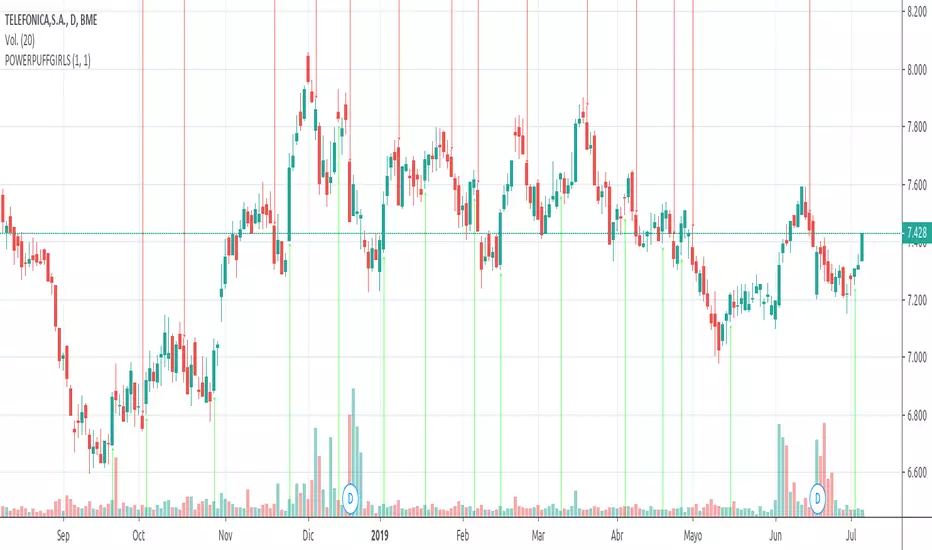
The four Kings MFI OBV CCI MACD [MesattoCapital]MFI OBV CCI MACD Combo Indicator by MesattoCapital
Version 2.0
Enjoy, check screenshot for more info!
BR/PT Version:

POWERPUFFGIRLS WE ARE GIRLS PROGRAMMING GREAT CODES, WE CREATE THIS INDICATOR THAT GIVE YOU THE CONTROL OVER THE ALERTS, JUST BUY IT WHEN GREEN ARROW APPEARS, AND SELL HEN THE RED ONE COMES OUT, GOOD LUCK
BOSS| Trade Like A Bitcoin and Ethereum WhaleTHE BEST BITCOIN AND ETHEREUM INDICATOR FOR TRADINGVIEW.COM
Quantum Technology – You won’t find any other indicator out there that predicts the probability of the next candle being bullish or bearish .
No Lag, No delay, No repaint!
Quality of Signals – The new Boss Quantum allows you to be in control of the outcome probability. Higher accuracy!
Buy/Long on Long Signal
Sell/Short on Short Signal
SET ALERTS TO ONCE PER BAR CLOSE
//////////////////////////////////////////////////////////////////////
Breakouts, Profit Points, and ReEntry's
This indicator will alert you of when to take profits, when to reenter a trade, and when a breakout occurs.
TAKING PROFITS
When in a long position take long profits on teal circle which, will be above candle.
When in a short position take short profits on purple circle which, will be below candle.
I typically exit 25-50% of position and reenter 25-50% on next candle.
If a Long or Short signal on BOSS quantum is still present the long or short trade is still active.
ReENTRY's
Long ReEntry's
If in a long position and a purple circle appears below candle this indicates a great place to either reenter trade or add more to position.
If a green triangle appears below candle you can either reenter or add more to long position as this signifies a long breakout/ strong upward movement.
Short ReEntry's
If in a short position and a teal circle appears above candle this indicates a great place to either reenter trade or add more to position.
If a red triangle appears below candle you can either reenter short or add more to short position as this signifies a short breakout/ strong downward movement.
Breakout's
Green Triangle
If a green triangle appears below candle you can either reenter or add more to long position as this signifies a long breakout/ strong upward movement.
Red Triangle
If a red triangle appears above candle you can either reenter short or add more to short position as this signifies a short breakout/ strong downward movement.
SET ALERTS TO ONCE PER BAR
Available At: Bosscripts.com
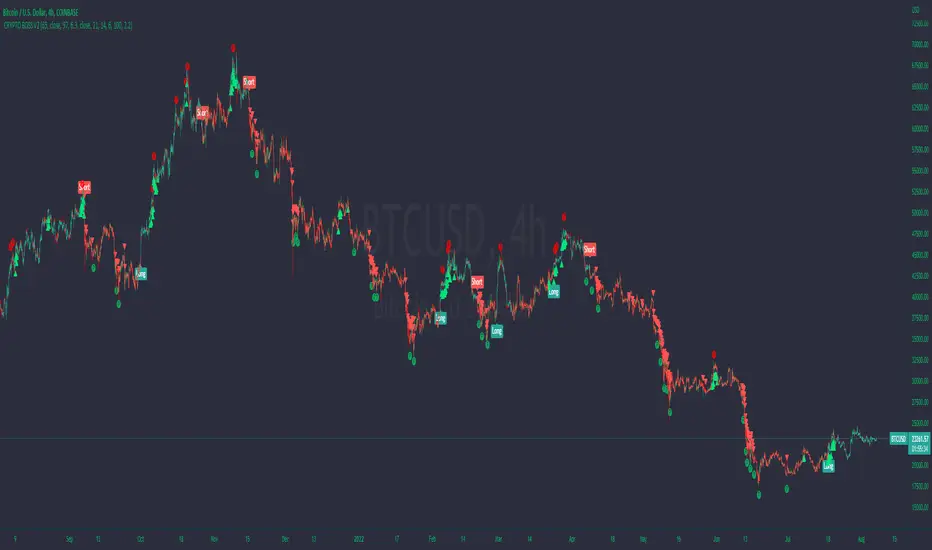

Sheek SwingBot OfficialPros:
Ability to setup Alerts for buy/sell signals
Trend identification
Stand-alone for decision making
Cons:
Choppy sideways action results in meh/bad signals
Strategy is simple
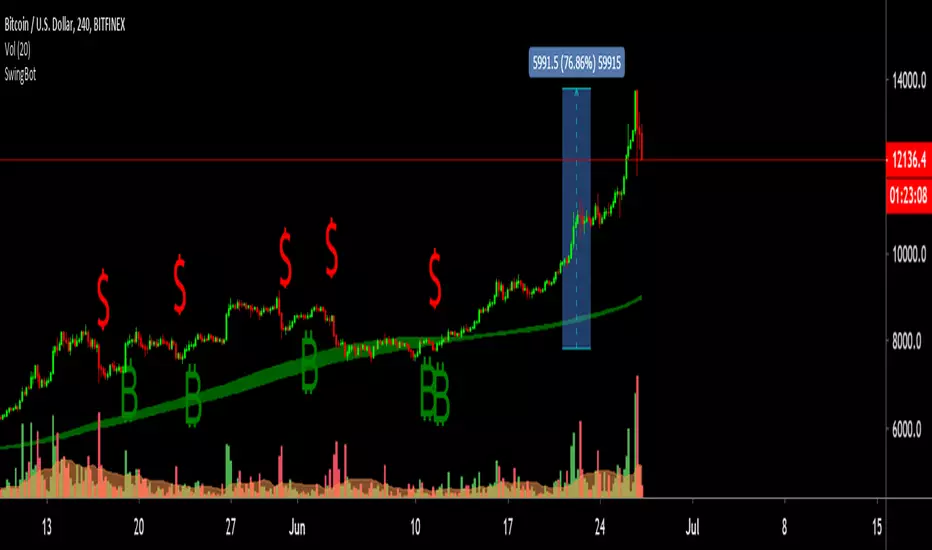
Buy if bitcoin symbol is present and price is trading above the green cloud , DONT take the short signals only the buy
Short if Dollar symbol is present and price is trading below the red cloud .Again DONT take the anti trend calls
The cloud is your trend indicator
Have some limits inside the cloud
Risk management is advised!!!
, Happy Trading
MADMEX XBTUSD (1.6 + Hedge)I thought I share some progress on the lastest version of my Madmex XBTUSD trading setup.
The backtest data actually matches 95% with the real live trading of the past few months. This strategy is trading in a real/production environment for a while now and the numbers add up.
Improvements
- Dynamic Position Sizing
- Adaptive ATR Exits and Take Profit Orders
- Adaptive Pyramid Buying based on Liquidity and Bitmex Order Book Data
- Hedging / 1x Short Algorithm
Here the last two trades from the live trading environment:
imgur.com

S&R Zone SignalsThis indicator allows you to specify price zones in which to detect basic candlestick patterns.
In the example above, I have specified the most immediate support and resistance zones on GBP/USD and set the script to detect engulfing candles. If a bearish engulfing candle occurs within the resistance zone a signal will be generated; likewise for bullish engulfing candles within the support zone .
The purpose of this indicator is to generate trading alerts when these patterns occur in order to reduce the screen-time required to monitor setups. This indicator is intended for structure traders primarily, although it could be used by anyone who uses zones and candlestick patterns to enter trades.
If you leave either zone set to 0 then that zone will not be used, meaning that you can use this to detect both support and resistance signals, or only signals at support, or only signals at resistance.
Settings:
R1: First Resistance Price
R2: Second Resistance Price
S1: First Support Price
S2: Second Support Price
Draw Signals: Enable/Disable Visual Signals
How Far To Look Back: Used For Detecting Fractal Highs/Lows
Doji Size (in pips): This Changes the Size of Detected Doji Candles
Hammer Wick Size: This Changes the Size of Detected Hammers/Shooting Stars
Engulf Wick: If Enabled, Only Engulfing Candles That Engulf the Wick Will Be Valid
Show Engulfing Candles: Enable/Disable Visual Signals For Engulfing Candles
Show Doji Candles: Enable/Disable Visual Signals For Doji Candles
Show Hammer Candles: Enable/Disable Visual Signals For Hammer/Shooting Star Candles
Source Code:
Go to zenandtheartoftrading.com for the source code – it’s free!

